

Abstract
Altered tumor microenvironment (TME) arising from a bidirectional crosstalk between the pancreatic cancer cells (PCCs) and the pancreatic stellate cells (PSCs) is implicated in the dismal prognosis in pancreatic ductal adenocarcinoma (PDAC), yet effective strategies to disrupt the crosstalk is lacking. Here, we demonstrate that gold nanoparticles (AuNPs) inhibit proliferation and migration of both PCCs and PSCs by disrupting the bidirectional communication via alteration of the cell secretome. Analyzing the key proteins identified from a functional network of AuNP-altered secretome in PCCs and PSCs, we demonstrate that AuNPs impair secretions of major hub node proteins in both cell types and transform activated PSCs toward a lipid-rich quiescent phenotype. By reducing activation of PSCs, AuNPs inhibit matrix deposition, enhance angiogenesis, and inhibit tumor growth in an orthotopic co-implantation model in vivo. Auto- and heteroregulations of secretory growth factors/cytokines are disrupted by AuNPs resulting in reprogramming of the TME. By utilizing a kinase dead mutant of IRE1-α, we demonstrate that AuNPs alter the cellular secretome through the ER-stress-regulated IRE1-dependent decay pathway (RIDD) and identify endostatin and matrix metalloproteinase 9 as putative RIDD targets. Thus, AuNPs could potentially be utilized as a tool to effectively interrogate bidirectional communications in the tumor microenvironment, reprogram it, and inhibit tumor growth by its therapeutic function.
Keywords: gold nanoparticles, stellate cells, tumor microenvironment, pancreatic cancer
Graphical Abstract
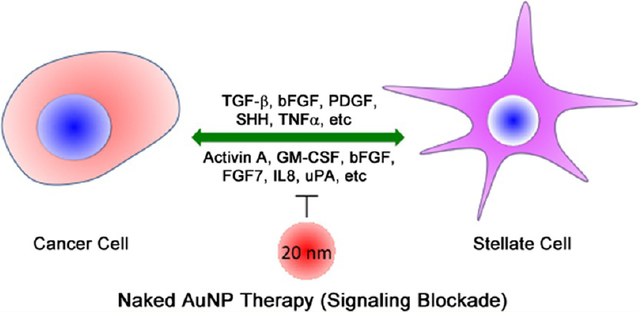
Desmoplasia is a hallmark of pancreatic ductal adenocarcinoma (PDAC) and characterized by the development of a fibrous connective tissue mass arising from the bidirectional communication between the pancreatic cancer cells and the pancreatic cancer associated fibroblasts, also known as pancreatic stellate cells (PSCs).1–3 Though the molecular mechanisms are poorly understood,4–8 a number of growth factors (GFs) and cytokines such as transforming growth factor β (TGFβ), basic fibroblast growth factor (FGF2), connective tissue growth factor (CTGF), interleukin-1β (IL-1β), vascular endothelial growth factor (VEGF), platelet derived growth factor (PDGF), and sonic hedgehog (SHH) are recognized to play major roles in the bidirectional crosstalk and perpetual activation of PSCs.9–11 Thus, molecularly targeted therapy aimed at disrupting a single pathway has only met with limited success in improving therapeutic outcome in PDAC.12 It is recently reported that activated PSCs that are characterized by overexpression of alpha smooth muscle actin (α-SMA) and low vitamin A content can be reversibly transformed back to their nonactivated, quiescent form.13 Treatment with the vitamin D analogue, Calcipotriol, suppresses pancreatitis and desmoplasia in the transgenic KPC (KrasLSL·G12D/+; p53R172H/+; PdxCretg/+) model of pancreatic cancer by reprogramming activated PSCs to quiescence.14
Desmoplasia varies within the tumor as well as between patients.15 The combination of high stromal activity (characterized by high α-SMA expression) and low collagen deposition was reported to have a worse outcome than the combination of high collagen deposition and low stromal activity, indicating that the crosstalk between PSCs and PCCs is important for PDAC outcome.16 Interestingly, a positive role of fibrotic stroma in restraining PDAC cells from undergoing metastasis has also been recently reported.17,18 Together these studies emphasize the importance of interrogating and disrupting cellular communications between PSCs and PCCs to improve therapeutic efficacy, however, effective strategies are limited.
In this context, we recently reported that gold nanoparticles (AuNPs) possess intrinsic therapeutic property.19 We demonstrated that 20 nm AuNPs (among 5, 10, 20, and 100 nm) demonstrated the highest efficacy in inhibiting tumor growth and metastasis in two preclinical orthotopic models of ovarian cancer by inhibiting activation of mitogen-activated protein kinase (MAPK) and reversing epithelial-mesenchymal transition (EMT) via downregulation of a number of heparin binding growth factors (HB-GFs) such as PDGF, bFGF, TGF-β, and HGF.19 These GFs are also responsible for bidirectional crosstalk in the TME of PDAC.9–11 Therefore, the 20 nm AuNPs present an opportunity to disrupt the PCC–PSC crosstalk, inhibit MAPK-activation, reverse EMT in PCCs, and reprogram the pancreatic tumor microenvironment. Hence, in the present report, we investigated whether unmodified 20 nm AuNPs could be utilized to disrupt the PCC–PSC crosstalk and reprogram tumor microenvironment to inhibit PDAC growth.
RESULTS AND DISCUSSION
We synthesized 20 nm AuNPs by the citrate reduction method19 using endotoxin-free water and characterized their physicochemical properties by UV–vis spectroscopy (UV–vis), dynamic light scattering (DLS), zeta potential measurements, and transmission electron microscopy (TEM) (Supplementary Figures S1A–E and S2). UV–vis spectrum of as synthesized AuNPs exhibits a surface-plasmon resonance (SPR) band centered at 522 nm (Figure 1A). DLS and zeta potential measurements demonstrate that as synthesized particles of hydrodynamic diameter of 20 ± 1.2 nm (based on volume, Figure 1B) with a mean zeta potential of −44.3 ± 2.8 mV (Figure 1C) are formed by this method. The core size of the nanoparticles is further confirmed by TEM analysis that showed nanoparticles of nearly 20 nm are formed by this method (Supplementary Figure S2). Next, we investigated stability of 20 nm AuNPs under different cell culture conditions such as in serum-free culture media, conditioned media (CM) from cells, and serum-supplemented culture media. A red-shift in the SPR band of as synthesized AuNP was observed when incubated with the conditioned media and serum containing media, possibly due to the binding of proteins from the CM and serum containing media or some extent of aggregation (Figure 1D). However, a dramatic red shift in SPR band was observed when as synthesized AuNPs were incubated with serum-free media, suggesting aggregation of AuNPs in absence of proteins either from serum or from CM. DLS measurements, exhibiting increase in hydrodynamic diameter of as synthesized AuNPs after incubation with media recapitulating different culture conditions, further support the conclusion of the UV–vis studies (Figure 1E). Results from UV–vis and DLS measurements were further confirmed by TEM, where nicely dispersed AuNPs were observed in water and in serum containing media, whereas AuNP aggregates were seen in serum-free as well as conditioned media (Figure S2). The stability results suggest that citrate-capped AuNPs, while prone to aggregation in serum-free culture media, but the presence of secreted proteins either in conditioned media from cells or in serum, form a protective coating which prevents them from substantial aggregation.
Figure 1.

Treatment with 20 nm AuNP affects growth of PCCs and PSCs and reprograms pancreatic stellate cells to quiescence. (A) Effect of various doses of 20 nm AuNP on the proliferation of PCCs (AsPc1 and Panc-1) ascertained through 3H-thymidine incorporation assay post 48 h treatment. (B) Effect of various doses of 20 nm AuNP on the proliferation of PSCs (CAF19 and iTAF) ascertained through 3H-thymidine incorporation assay post 48 h treatment. (C) Immunoblotting analysis showing dose-dependent inhibition of MAPK signaling by 20 nm AuNP in PCCs and PSCs after 48 h treatment. (D) Effect of 20 nm AuNP on the expression of various ECM components and activation marker, α-SMA, by immunoblotting in PSCs. (E) qRT-PCR analyses of mRNA levels of ECM components and activation markers, α-SMA and FAP, in PSCs after 48 h 20 nm AuNP (25 μg/mL) treatment. (F) BODIPY493/503 staining for neutral lipids in iTAF cells post 48 h treatment with 20 nm AuNP (25 μg/mL) treatment. Scale bar is 10 μm. (G) Effect of 48 h treatment with 20 nm AuNP on mRNA levels of important lipid metabolism genes in PSCs determined through qRT-PCR. Data represent mean ± s.d. of three individual experiments (n = 3) each time in triplicate, and statistical analyses were performed using two-tailed students t test * p ≤ 0.05, ** p ≤ 0.01; p/t indicates ratio of phosphorylated protein to total protein. All other densitometric analyses are with respect to loading control.
To investigate the effect of AuNPs on PCCs and PSCs, we utilized two well-established PCC cell lines, AsPc1 and Panc-1, and two patient-derived PSCs, CAF19 and iTAF, that were characterized by Western blot and qRT-PCR. Compared to PCCs or the noncancerous pancreatic ductal epithelial cells (HPDECs), PSCs expressed higher levels of fibronectin, collagen I, collagen III, collagen IV, and α-SMA (Supplementary Figure S3A,B). Subsequently, we determined the effect of different concentrations of AuNP on the proliferation of PCCs and PSCs by 3H-thymidine incorporation assay. To demonstrate the ability of AuNPs to disrupt the cross-talk between PCCs and PSCs due to secretory growth factors/cytokines, all the proliferation experiments were carried out in serum-free media. A dose-dependent inhibition in proliferation of either PCCs or PSCs was observed, reaching a maximum of ~70–80% inhibition at 48 h with 50 μg/mL AuNP (AsPc1: Control: 1 ± 0.18 vs 0.19 ± 0.03 AuNP; Panc-1: Control: 1 ± 0.06 vs 0.33 ± 0.08 AuNP; CAF19: Control: 1 ± 0.1 vs 0.3 ± 0.2 AuNP; iTAF: Control: 1 ± 0.2 vs 0.29 ± 0.14 AuNP; p < 0.05) (Figure 1A,B). However, to test whether AuNPs retain their antiproliferative activity in the presence of serum, we additionally carried out the proliferation experiments under varying concentrations of serum (5% and 10%). Importantly, AuNPs retained their antiproliferative activity under serum-replete conditions as well (Supplementary Figure S4A). Previous studies from various groups including ours have demonstrated that 20 nm AuNPs do not affect the proliferation of normal cells like ovarian surface epithelial cells nor do they show systemic toxicity after multiple injections over a period of 3–4 weeks,19,20 indicating their nontoxic behavior against normal cells. In line with these observations, 20 nm AuNPs did not significantly affect the proliferation of normal HPDECs and nonmalignant NIH3T3 fibroblast cells under serum-free or serum-replete conditions (Supplementary Figure S4B,C, respectively).
Next, we investigated cellular uptake of AuNP by PCCs and PSC and their intracellular location under the same experimental conditions used in proliferation assays. Instrumental neutron activation analysis revealed that both PCCs and PSCs significantly internalized AuNPs, intracellular uptake being higher in PCCs (~40% of the treated dose) than in PSCs (~30%) (Supplementary Figure S5A). Furthermore, TEM analyses revealed that internalized particles are mostly localized in double membrane bound vesicles or in multivescular bodies (Supplementary Figure S5B).
Next we investigated the mechanisms by which AuNPs inhibit proliferation of PCCs and PSCs. Since growth factor-mediated signaling converges at mitogen activated protein kinase (MAPK), signaling cascades that increase proliferative activity of the cells, we determined whether AuNPs inhibited activation of MAPK.21 In both PCCs and PSCs, we observed a dose-dependent inhibition of p42/44 MAPK and p38 MAPK at 48 h of AuNP treatment (Figure 1C). We also examined the levels of Akt phosphorylation, critical for the progression of pancreatic cancer.22 However, Akt phosphorylation was not significantly reduced in PCCs and PSCs (Supplementary Figure S6).
Previous reports demonstrated that quiescent PSCs, once activated, support their own growth and remodel ECM in an autocrine manner through an expanded secretome.23 To determine any effect of AuNP on PSC-mediated ECM synthesis, we performed immunoblot analyses of key ECM components such as fibronectin, collagens I, III, and IV, and α-SMA after treating CAF19 or iTAF with increasing doses of AuNP for 48 h. Treatment with AuNP dose-dependently reduced expression of collagens I and III, α-SMA, and fibronectin in PSCs, whereas collagen IV levels remained unaffected (Figure 1D). Similar results were obtained in three additional patient-derived PSCs (Figure 1D). Furthermore, treatment with AuNP reduced mRNA expression of collagens I and III in all of the PSCs tested except in PTAF2 (Figure 1E). Notably, the effects of AuNP on mRNA expression of fibronectin and collagen IV were congruent with their protein levels. Moreover, a significant attenuation in the mRNA expression of α-SMA and FAP (fibroblast-activating protein) was indicative of PSCs transitioning to a more quiescent phenotype. To further investigate the effect of AuNP treatment on reverse activated fibroblasts to a more quiescent phenotype, we determined the neutral lipid content in AuNP-treated or untreated PSCs using BODIPY493/503 (Figure 1F and Supplementary Figure S7) since vitamin A-storing neutral lipid droplets indicate PSC quiescence.24 AuNP treatment (25 μg/mL for 48 h) resulted in a significant increase in neutral lipid droplet accumulation inside PSCs, whereas these droplets were nearly absent in untreated controls. To further investigate the ability of AuNP in lipid droplet accumulation, we evaluated mRNA levels of lipid metabolism genes associated with PSC quiescence following AuNP treatment14,24 (Figure 1G). The results demonstrate an increase in expression of fatty acid binding protein FABP3, FABP4, and FABP7 in a cell-type-dependent manner, suggesting additional complexities in the reprogramming events. Additionally, AuNP treatment increased the mRNA levels of Perilipin-1 (PLIN1), Perilipin-4 (PLIN4), and fatty acid synthase (FASN). SREBP1a and SREBP2 mRNA levels were, however, unaltered by AuNPs in majority of the PSCs studied. Together, these results suggest that AuNPs promote lipid synthesis/accumulation in PSCs, a key modulator of their quiescence status, which is a subject of future investigation.
We next investigated the ability of AuNPs to disrupt the PCC–PSC crosstalk using a conditioned media (CM)-based approach as reported in the literature.25–27 Accordingly, we first generated the CM from PSCs with or without AuNP treatment under starving conditions and treated PCCs to determine proliferation (Figure 2A). Treatment of PCCs with CM of AuNP-treated PSCs decreased PCCs proliferation (determined by fold 3H-thymidine incorporation) as compared to CM of control PSCs without AuNP treatment (Panc-1: CAF19-CM: 2.94 ± 0.17 fold vs CAF19-AuNP-CM: 1.95 ± 0.34 fold, p < 0.05; iTAF-CM: 4.86 ± 0.36 fold vs iTAF-AuNP-CM: 2.72 ± 0.41 fold, p < 0.001), (AsPc1: CAF19-CM: 3.16 ± 0.27 fold vs CAF19-AuNP-CM: 1.38 ± 0.09 fold, p < 0.001; iTAF-CM: 1.74 ± 0.07 fold vs iTAF-AuNP-CM: 1.36 ± 0.12 fold, p < 0.05) (Figure 2B,C). Similarly, we observed a significant reduction in PSC proliferation using CM from AuNP-treated PCCs (CAF19: Panc-1-CM: 3.77 ± 0.7 fold vs Panc-1-AuNP-CM: 2.1 ± 0.46 fold, p < 0.05; AsPc1-CM: 5.5 ± 0.58 fold vs AsPc1-AuNP-CM: 1.5 ± 0.9 fold, p < 0.01), (iTAF: Panc-1-CM: 1.7 ± 0.09 fold vs Panc-1-AuNP-CM: 1.2 ± 0.08 fold, p < 0.05; AsPc1-CM: 2.7 ± 0.4 fold vs AsPc1-AuNP-CM: 1.0 ± 0.23 fold, p < 0.01) (Figure 2D,E). To appreciate the role of bidirectional crosstalk in proliferation of PCCs and PSCs, we also investigated the effect of CM derived from the mixed coculture of AsPc1 and CAF19 cells on the proliferation of AsPc1 and CAF19 cells individually (Supplementary Figure S8A,B). We observed that CM obtained from a PCC–PSC coculture enhanced proliferation of AsPc1 cells by ~1.5-fold as compared to CAF19 CM only and nearly 2-fold in CAF19 cell proliferation as compared to AsPc1 CM only. These results suggest that AuNP treatment by altering the levels of secreted factors from PSCs and PCCs might disrupt their bidirectional communication. Therefore, next, we investigated the ability of AuNPs to disrupt the crosstalk between PCCs and PSCs using Boyden chamber-based co-culture migration assays (Figure 2F). AuNP significantly inhibited PSC-induced migration of PCCs as compared to untreated control (AsPc1 migration by CAF19:1.68 ± 0.06 fold vs CAF19–50 μg-AuNP: 1.22 ± 0.07 fold, p < 0.001; iTAF: 2.32 ± 0.2 fold vs iTAF-50 μg-AuNP: 1.06 ± 0.21 fold, p < 0.001) (Figure 2G,H). Similarly, compared to untreated PCCs, migration of PSCs was significantly reduced when cocultured with AuNP-treated PCCs. (CAF19: Untreated AsPc1:1.99 ± 0.13 fold vs AsPc1–50 μg-AuNP: 0.98 ± 0.06, p < 0.001; Untreated Panc-1:3.23 ± 0.4 fold vs Panc-1–50 μg-AuNP: 1.52 ± 0.4, p < 0.05). Thus, the combined results of proliferation and migration experiments confirm that AuNPs disrupt the cross-talk between the pancreatic cells and the stellate cells likely by decreasing the levels of key secretory molecules and inhibiting their functions.
Figure 2.

20 nm AuNPs disrupts PCC–PSC crosstalk in vitro. (A) Schematic representation of the method for generating CM from PCCs and PSCs. (B) and (C) Effect of 20 nm AuNP treatment on induction of proliferation in Panc-1 and AsPc1 cells by untreated and AuNP-treated (25 μg/mL) PSC CMs for 48 h determined through MTS assay. (D) and (E) Effect of 20 nm AuNP treatment on induction of proliferation in CAF19 and iTAF cells by untreated and AuNP-treated (25 μ/ml) PCC CMs for 48 h determined through MTS assay. (F) Schematic representation of the employed method for study of AuNP effects on induction of directed migration in indirect coculture between PCCs and PSCs. (G) and (H) Effect of various doses (0, 5, 25, and 50 μg/mL) of 20 nm AuNP treatment on PSCs to induce migration of AsPc1 cells. (I) and (J) Effect of various doses (0, 5, 25, and 50 μg/mL) of 20 nm AuNP on PCCs to induce migration of CAF19 cells. All experiments were performed in triplicate, and statistical analysis was done using One-Way ANOVA followed by Newman–Keuls post-test. Data represent mean ± s.d. of three individual experiments (n = 3), and statistical analyses were performed using One-Way Anova *p ≤ 0.05, **p ≤ 0.01, ***p ≤ 0.001.
Previously, we reported that AuNPs bind HB-GFs such as VEGF165, FGF-2, and PIGF and alter their conformation that inhibits their function.28,29 We also demonstrated that AuNPs inhibited ovarian tumor growth and metastasis by inhibiting HB-GFs like TGF-β1, bFGF, and PDGFAA secretion.19 In the current study, we sought to identify the key molecules mediating the crosstalk between PCCs and PSCs in PDAC. We determined the expression of 56 angiogenesis-related proteins in the CM derived from both AuNP-treated PCCs and PSCs using a commercially available angiogenesis array kit. Expression of a number of the proteins present in the array was significantly reduced in the CM of both AuNP-treated PSCs and PCCs as compared to untreated control CM (Supplementary Table S1). As determined from the quantitative analysis of the blotted membrane, TGF-β1, endostatin/ColXVIII, AREG, DPPIV/CD26, matrix metalloproteinase 9 (MMP-9), EG-VEGF, THBS1, PlGF, and CCL2 proteins were the most prominently downregulated secretory molecules (≥2-fold decrease, p < 0.05) in PCCs, suggesting a potential role of these molecules in mediating the PCC–PSC crosstalk (Figure 3A). Interestingly, TGF-β1, THBS1, endostatin, CCL2, and MMP-9 are known to negatively regulate angiogenesis and promote fibrosis.25,26 Thus, AuNPs by depleting the pro-fibrotic molecule in the CM might potentially inhibit desmoplasia. We also determined the mRNA expression of these factors after treating PCCs with AuNP for 48 h (Figure 3B). We observed a marked decrease in mRNA expression of all of the above molecules except for TGF-β1. In PSCs, AuNP treatment reduced the expression of pro-angiogenic factors like bFGF (>6-fold, p < 0.01) and uPA (~2-fold, p < 0.05). Interestingly, the levels of multiple pro-fibrotic GFs such as angiopoietin-1 (ANGPT1), THBS1, and Activin A (INHBA) (Figure 3C, Supplementary Table S2) were also decreased (ANGPT1: 2.3-fold, p < 0.01; THBS1: 2.1-fold, p < 0.05; INHBA: 2.8-fold, p < 0.05), suggesting a switch toward an angiogenic phenotype. Additionally, IL-8, GM-CSF, Pentraxin-3, Activin A, PDGFAA and Persephin, implicated in pancreatic tumorigenesis, were also downregulated by AuNP-treatment3,30–34 (Figure 3C). Similarly, treatment of PSCs with AuNP for 48 h also significantly decreased mRNA expression of many of these factors (Figure 3D). Together these results indicate that AuNPs reduced secretion of a number of proteins critical for autocrine and paracrine signaling in PCCs and PSCs.
Figure 3.

Treatment with AuNPs alters secretory profile of pancreatic cancer and stellate cells. (A) Relative levels of significantly (*p ≤ 0.05) altered angiogenesis-related proteins in AsPc1 and Panc-1 conditioned media upon treatment with 25 μg/mL dose of 20 nm AuNP for 48 h. Folds are with respect to untreated controls. (B) qRT-PCR analysis of altered angiogenesis-related proteins in untreated and 25 μg/mL AuNP-treated AsPc1 cells analyzed 48 h post-treatment. GAPDH was used as an internal control. (C) Relative levels of significantly (p ≤ 0.05) altered angiogenesis-related proteins in iTAF and CAF19 conditioned media upon treatment with 25 μg/mL of 20 nm AuNPs for 48 h. Folds are with respect to untreated controls. (D) qRT-PCR analysis of altered angiogenesis-related proteins in untreated and 25 μg/mL AuNP-treated iTAF and CAF19 cells analyzed 48 h post-treatment. GAPDH was used as an internal control. Data represent mean ± s.d. of three individual experiments (n = 3).
We next investigated the ability of AuNPs to disrupt PCC-induced activation of PSC to promote fibrogenesis and matrix production (Figure 4A,B). Notably, CM from untreated PCCs upregulated expression of several ECM components in PSCs such as fibronectin, collagens I, III, and IV, and activation marker, α-SMA, in comparison to CM from AuNP-treated PCCs. To identify potential key regulators responsible for altered tumor microenvironment among the secretory molecules downregulated by AuNP such as Activin A, TGF-β1, PDGFAA, HGF, and bFGF, we treated serum-starved CAF19 cells with these secretory molecules and investigated their effect on α-SMA (maker of activated stellate cells) and ECM components (Figure 4C). Interestingly, while expression of α-SMA was marginally increased by Activin A, TGF-β1, and HGF, only Activin A and TGF-β1 significantly increased expression of fibronectin (Activin A, ~10-fold induction; TGF-β1, ~30-fold induction). However, expression of collagen I was modestly upregulated by TGF-β1 (2-fold) and HGF (1.3-fold), indicating disruption of key regulatory factors responsible for the desmoplastic reaction in PDAC by AuNP.
Figure 4.

AuNP treatment inhibits mounting of fibrogenic response in PSCs by PCCs and signaling in PCCs by PSCs. (A) and (B) Immunoblot analysis of CAF19 and iTAF cells for ECM markers and α-SMA upon treatment with serum-free media, serum-supplemented culture media, untreated/AuNP-treated (25 μg) AsPc1 conditioned media for 24 h. α-Tubulin was used as the loading control. (C) Effect of various growth factors on the ECM components and α-SMA protein levels determined by immunoblotting after 24 h of treatment in CAF19 cells. (D) and (E) Immunoblot analysis of AsPc1 cells (10 μg protein) to study Akt and MAPK signaling upon treatment with serum-free media, complete-10% FBS media, CAF19/iTAF CM, or various doses of AuNP-treated CAF19/iTAF CM for 24 h. GAPDH was used as the loading control; p/t indicates ratio of phosphorylated protein to total protein. All other densitometric analysis are with respect to loading control.
To further determine how alteration of the PSC secretome affects critical signaling pathways in PCCs responsible for growth and survival, we treated serum-starved PCCs with CM of untreated or AuNP-treated PSCs (Figure 4D,E). Dose-dependent reduction in the activation of Akt and p42/44 MAPK signaling in PCCs was observed when incubated with the CM of AuNP-treated PSCs as compared to the untreated CM. Oncogenic mutant k-Ras in PDAC utilizes three major pathways: Raf/MEK/ERK, PI3K/Pdk1/Akt, and the Ral/GEF.35 The results described above indicate that PSC-derived secretory factors further exacerbate these pathways and suggest that disruption of these pathways by AuNP treatment may inhibit PDAC growth.
To dissect further the mechanism of AuNP action, we determined which secreted factors from AsPc1 cells directly bind to AuNPs (Supplementary Figure S8C). To investigate the direct binding of secretory molecules with AuNP, we incubated the CM from untreated AsPc1 cells with or without 25 μg AuNPs for 6 h and then analyzed the spun down supernatant for 56 important GFs/cytokines using commercially available antibody array kit as we used in the experiments discussed above. Notable decreases (>50% decrease, p ≤ 0.05) in the levels of DPPIV/CD26, THBS1, CXCL16, Coagulation Factor III (F3), and SerpinE1 were observed. Interestingly, a marginal increase of SerpinE1 was observed when AsPc1 cells were directly treated with AuNPs, suggesting that besides binding and sequestering the secreted proteins, AuNPs also functionally affect the secretory profile of PCCs and PSCs and consequently affect the expression of a large number of other secreted factors. To further decipher the molecular interactions among the secretory molecules altered upon AuNP treatment, we adopted a systems biology approach driven by biological network analysis. To test the functional significance of the proteins downregulated by AuNPs, we constructed and used network topology parameters to prioritize proteins for functional experiments. A functional network with differentially secreted proteins from iTAF cells yielded 22 nodes based on 94 interactions derived from multiple data types (coexpression: 76.65%; colocalization: 10.71%; shared-protein domain: 8.29%; protein–protein interaction: 2.94%, and protein participating in same pathways: 1.41%) (Figure 5A, Supplementary Table S3). Proteins (CSF2, CCL2, INHBA, and VEGFA) in the network were enriched for complement and coagulation cascades and dissolution of fibrin clot (PLAU and SERPINE1) (Supplementary Figure S9; Tables S4 and S5 and SuppNetworkAnalysis.xlsx). Node prioritization analysis suggested that GFs such as Activin A (INHBA), THBS1, PLAU (uPA), TIMP1, IL-8, SERPINE1, and PTX3 were “hub” proteins (having maximal informational connections with other genes) and could direct gene expression over many functional pathways. To validate the role of these hub proteins in autoregulation (regulating self-expression) as well as heteroregulation (regulating expression of other proteins in the network) of other key hub node proteins, we treated iTAF with Activin A (100 ng/mL), PDGFAA (10 ng/mL), bFGF (10 ng/mL), THBS1 (1 nM), uPA (1 nM), and HGF (10 ng/mL) for 24 h and analyzed the mRNA expression of the secretory molecules (Figure 5B). Although no appreciable decrease in PDGFA and HGF was observed in iTAF upon AuNP treatment, we still tested their role to further validate their role in heteroregulation. Activin A not only enhanced its transcription by ~1.6-fold implying autoregulation but also enhanced expression of IGFBP2, GDNF, coagulation factor F3, CSF2 (>1.5-fold). However, expression of HGF was decreased by 2.6 fold, indicating a negative heteroregulation by Activin A. A broader heteroregulatory loop was observed with PDGFAA in PSCs. While induction by PDGFAA increased the transcripts of PTX3, IGFBP1, IGFBP2, and IL-8 by more than 2-fold, a modest increase was observed for Activin A, HGF, bFGF, uPA, F3, and CSF2, indicating the existence of a complex heteroregulatory network in the tumor microenvironment partly dominated by PDGFAA. PDGFAA, however, did not induce its own transcript, indicating absence of any autoregulation. Although FGF2 did not exhibit any autoregulation, it caused a modest but significant increase in transcript levels of PTX3, CSF2, and IGFBP2 (>1.3-fold) and a marginal decrease (1.4-fold) of PDGFA mRNA. Interestingly, THBS1 demonstrated strong autoregulation (2.4-fold) and also modest heteroregulation (~1.5 fold increase) of other proteins such as Activin A, bFGF, IL8, and uPA mRNAANGPT1, PTX3, and GDNF. uPA also demonstrated lack of autoregulation in iTAF. Importantly, regulation of many of these key secretory molecules is unknown. Together, network analysis and prioritization in PSCs indicate that altered expression of GF/cytokine transcripts by AuNP might be a consequence of complex auto- and heteroregulations mediated by the hub node proteins.
Figure 5.

AuNPs alter the secretome through growth factor auto and heteroregulation. (A) Functional network of differentially secreted proteins from iTAF cells showing putative interactions generated using GeneMania. Highlighted nodes in black are proteins differentially secreted upon AuNP treatment; edge color indicates different types of interaction type. (B) Heatmap representing the effect of key growth factors/cytokines on the expression of differentially expressed genes in iTAF cells after 24 h of treatment determined by qRT-PCR. The mean values of three independent experiments were plotted in OriginPro 8.1 to generate the heatmap. (C) Functional network of differentially secreted proteins from AsPc1 cells showing putative interactions and results from network analysis visualized using Cytoscape. Node size corresponds to the degree of a node; node color corresponds to the radiality score (green-to-yellow-to-red). Edge color represents the evidence of interaction between the nodes (cyan: coexpression; blue: colocalization; pink: pathways; brown: physical protein–protein interactions; green: shared-protein domains; gray: text-mining) (D) Heatmap representing the effect of key growth factors/cytokines on the expression of differentially expressed genes in AsPc1 cells after 24 h of treatment determined by qRT-PCR. The mean values of three independent experiments were plotted in OriginPro 8.1 to generate the heatmap.
To further investigate the effect on PCCs, we established a network with 16 altered secretory molecules in AsPc1 cells (Figure 5C, Supplementary Table S6). A functional network with 16 nodes with 42 interactions (coexpression: 53.7%; colocalization: 14.6%; shared-protein domain: 2.4%; protein–protein interaction: 17.1%; and proteins participating in same pathways: 2.4%) was constructed. The network showed enrichment of the plasminogen activating cascade (F3 and PLAU) and regulation of cell migration (EDN1, ANGPT1, SERPINE1, CCL2, THBS1, FGF2, F3, and VEGFA) (Figure S9, Tables S4 and S5, and SuppNetworkAnalysis.xlsx). Computing the network properties revealed that MMP-9 (12 nodes) and THBS1 (11 nodes) could be key “hub” proteins followed by uPA/PLAU (8 nodes) and IL-8 (9 nodes). To validate the functional connectivity, we studied the mRNA expression of altered secretory factors after treating AsPc1 cells with either 10 ng/mL TGF-β1, 1 nM THBS1, 10 ng/mL PDGFAA, or 1 nM uPA for 24 h (Figure 5D). We selected these doses based on literature reports.36–39 TGF-β1 demonstrated strong positive autoregulation (>3-fold increase) and only enhanced expression of EG-VEGF, MMP-9, and endostatin as observed in the network analysis. THBS1 significantly upregulated the mRNA levels of endostatin, PLGF, MMP-9, EG-VEGF, and PDGFAA. PDGFAA treatment marginally increased TGF-β1 mRNA expression (1.5-fold) but decreased mRNA expressions of DPPIV/CD26, MMP-9, IL-8 and AREG. uPA demonstrated significant (≥1.5-fold) positive regulation of MMP-9, PlGF, PDGFA, DPPIV/CD26, IL8, AREG, and THBS1 but did not exhibit autoregulation. These results indicate that uPA, TGF-β1, and THBS1 are critical GFs from PCCs driving autocrine and paracrine signaling. Together, the auto- and heteroregulation studies indicate AuNPs may be utilized to decipher the complexity of molecular interactions in the tumor microenvironment.
Recently, ER-stress has been suggested to be a plausible mechanism of AuNP-mediated growth inhibition in cancer cells.20 To investigate this possibility, we conducted immunoblot analysis of AsPc1 and CAF19 lysates for ER-stress markers after treating with various concentrations of AuNP for 48 h. Treatment with AuNP demonstrated a dose-dependent induction of key ER-stress proteins IRE1α and IRE1β in AsPc1 cells (Figure 6A). Also an increase in phospho-IRE1 was noted, although no significant changes in the expression of other ER-stress markers were observed. Similar results were also obtained with CAF19 cells. Induction of IRE1α and IRE1β demonstrates that AuNP treatment induces ER-stress in PCCs and PSCs activating the IRE1 arm. Activation of IRE1 results in IRE1-dependent XBP-1 cleavage and also in regulated Ire1-dependent decay of mRNAs (RIDD).40,41 This dual function is more pronounced for IRE1α than IRE1β. Since activation of IRE1α under ER-stress could degrade ER-resident mRNA,42 we transiently overexpressed wt-IRE1α or its kinase-dead mutant IRE1α-K599A (RIDD inactive) in AsPc1 cells (Figure 6B) and determined the mRNA expression of altered GFs (Figure 6C). Nearly 2-fold reduction in TGF-β1, endostatin, THBS1, MMP-9, PDGFA, and uPA transcripts was observed in wt-IRE1α expressing cells compared to the IRE1α-K599A mutant expressing cells, suggesting involvement of the RIDD pathway. It is also reported that IRE1α cleaves ER-resident mRNA with a consensus XBP-1 like cleavage site having a CUGCAG sequence. To further investigate the involvement of XBP-1 like cleavage site, we analyzed the mRNA sequence of TGF-β1, endostatin, MMP-9, PDGFA, and uPA, which revealed the presence of 1 site for TGF-β1, PDGFA, and MMP-9 and 6 and 3 sites for endostatin and uPA, respectively. To further confirm which of these secretory molecules are indeed regulated through RIDD upon AuNP treatment, we studied their mRNA expression post 48 h AuNP treatment in wt-IRE1α or IRE1α-K599A expressing AsPc1 cells (Figure 6D). The expression of endostatin and MMP-9 remained unaltered in the RIDD-inactive AsPc1 cells compared to wt-IRE1α expressing cells, indicating that their downregulation is through the RIDD activity of IRE1α. These results support our hypothesis that alteration of the secretory profile of PCCs and PSCs by AuNP is likely due to deprivation of key hub proteins that heteroregulate other secretory proteins and additionally through RIDD-dependent cleavage of ER-localized mRNA induced by ER-stress.
Figure 6.

AuNP-induced ER-stress activates RIDD to alter the secretome. (A) Immunoblot analysis of AsPc1 cells (10 μg protein) 48 h post-treatment with various doses of AuNPs for markers of ER-Stress. (B) Immunoblot analysis to confirm overexpression of wt-IRE1α and IRE1α-K599A. α-Tubulin is used as the loading control. (C) qRT-PCR analysis of altered growth factors/cytokines in wt-IRE1α-expressing AsPc1 cells compared to RIDD-inactive IRE1α-K599A. (D) qRT-PCR analysis of altered mRNAs in stable wt-IRE1α and mutant IRE1α-K599A expressing AsPc1 cells upon treatment with 20 nm AuNP (25 μg/mL) for 48 h. Experiments were performed in triplicate, and two-tailed student t test was performed to determine statistical significance. *p ≤ 0.05, **p ≤ 0.01. Densitometric analysis are with respect to loading control.
To determine the ability of AuNP to inhibit tumor growth in vivo, we used a previously reported orthotopic co-implantation model by surgically implanting a mixture of AsPc1 and CAF19 cells into the tip of the pancreas (Figure 7A,B).43 Mice that received either AsPc1 or CAF19 cells alone were used as controls for the co-implantation group. Each group was further divided into two subgroups, one receiving an intraperitoneal injection of 100 μg of AuNPs in a volume of 100 μL daily for 21 days, starting on day 4 after tumor cell implantation (experimental cohort). The dose of AuNP was decided based on our previous reports that demonstrated dose-dependent reduction of tumor growth and metastasis in two orthotopic models of ovarian cancer.19,44 The control group received only 100 μL of the HBSS (vehicle cohort). Animals were euthanized after treatment for 21 days, and tumor size and volume were determined. The co-implantation group formed significantly (p < 0.05) larger tumors (mean tumor mass: 469 mg) than the AsPc1 only group (mean tumor mass: 353 mg). As previously described, the animals implanted with PSCs (CAF19) alone did not form any tumor.45 Compared to the HBSS-treated control group, AuNPs significantly reduced tumor growth in the AsPc1 as well as in the co-implantation (AsPc1/CAF19) group. AuNP-treated AsPc-1 only group had a mean tumor mass of 210 mg as compared to 353 mg in HBSS-treated group, whereas AuNP-treated AsPc1/CAF19 tumors had a mean tumor mass of 303 mg as compared to 468 mg in the HBSS-treated control group (p < 0.01) (Figure 7A). Similar trend was also observed in tumor volume (Supporting Figure S10A). There was no appreciable change in body weight between AuNP and HBSS-treated group, confirming a lack of systemic toxicity due to AuNP as previously reported (Figure 7C).46,47 To estimate the distribution of gold in the tumor and major organs like spleen, liver, kidney, and lungs, we carried out instrumental neutron activation analysis (INAA) analysis (Supplementary Figure S10B). Highest accumulation of gold was found in the tumor, spleen, and liver, whereas accumulation in the lungs and kidneys were significantly lower. Furthermore, immunostaining for Ki-67 showed a substantial reduction in proliferating cell nuclei in AuNP-treated groups, further confirming the inhibition of tumor growth upon AuNP treatment (Figure 7D,E). The above observation was further supported by TUNEL staining of apoptotic cells where both AuNP-treated AsPc1 only or AsPc1/CAF19 tumors demonstrated a significant increase in the number of TUNEL positive nuclei than the HBSS-treated group (Figure 7F,G), indicating significant induction of apoptosis in the AuNP-treated groups. To further investigate if inhibition of tumor growth correlated with the status of PSC activation, IHC for αSMA was performed on tumor tissues obtained from AuNP-treated and HBSS-treated control animals (Figure 8A,B). We noted that the HBSS-treated co-implantation group (16 ± 4.3% αSMA positive area) showed a higher stained area than the HBSS-treated AsPc1-only group (9.8 ± 2.6% αSMA positive area) group. αSMA staining was significantly reduced in AsPc1 (5.7 ± 2.3%) and co-implantation AsPc1/CAF19 (6.85 ± 2.8%) upon AuNP treatment, confirming the in vivo ability of AuNP to inhibit stromal activation. To further evaluate if the stromal deactivation was accompanied by the changes in the expression of extracellular matrix proteins, we performed IHC for fibronectin and collagen, key components of the desmoplastic reaction.3 Treatment of AsPc1 and AsPc1/CAF19-bearing animals with AuNPs significantly decreased (~50%, p < 0.01) expression of fibronectin (reflected by a ~ 34 fold reduction in the number of strongly stained pixels) as compared to the control HBSS-treated groups (Figure 8C,D). The evaluation of collagen levels in tumors as determined by Sirius Red staining revealed a similar trend (Figure 8E,F). Specifically, we observed that compared to HBSS-treated control animals, AuNP treatment resulted in a significant reduction of Sirius Red positive areas in both the AsPc1 (2.8-fold, p < 0.01) and AsPc1/CAF19-bearing tumors (2.3-fold, p < 0.001). We further investigated whether reprograming of the tumor microenvironment and downregulation of pro-fibrotic molecules by AuNPs actually increased intratumoral vascularity as determined by CD31 staining (Figure 8G,H). Notably, treatment with AuNP increased the number of CD31-positive vessels in AsPc1/CAF19 tumors (44 vessels/10× field) as compared to HBSStreated animals (30 vessels/10× field, p ≤ 0.01). However, AuNP treatment resulted in a decrease in CD31 positive vessels (18 vessels/10× field) in the AsPc1 only group as compared to the control HBSS-treated group 28 vessels/10× field, p ≤ 0.01), further confirming the contribution of PSCs toward altering tumor microenvironment in PDAC and its reprogramming by AuNP. Any systemic toxicity due to AuNP treatment was assessed by H&E immunohistochemical staining of the major organs viz. liver, lung, and kidney. No apparent toxicity was noticed in the stained areas from these organs, thereby, indicating nontoxic behavior of 20 nm AuNPs toward normal cells within the investigated dosage (Supplementary Figure S11). Together, these results support the effect of AuNPs on inhibiting pancreatic tumor growth and reprogramming of the tumor microenvironment.
Figure 7.

Inhibition of tumor growth in orthotopic models of pancreatic cancer by AuNP. (A) Scattered plot of tumor weight in HBSS-treated (sham) or 100 μg/daily i.p. Twenty nm AuNP-treated animals post 21 days of treatment. Statistical analysis was performed using One-way ANOVA followed by Newman–Keuls multiple comparison test. (B) Representative H&E stained sections of (i) AsPc1-HBSS, (ii) AsPc1-AuNP, (iii) AsPc1/CAF19-HBSS, and (iv) AsPc1/CAF19-AuNP groups. Statistical analysis was performed using One-way ANOVA followed by Newman–Keuls multiple comparison test. (C) Animal body weight changes over time in CAF19 only, AsPc1 only, and AsPc1+CAF19 cells injected animals receiving HBSS or AuNP daily demonstrating apparent nontoxic behavior of AuNPs. (D) Whiskers min-to-max plot of Ki-67 stained nuclei in HBSS or AuNP-treated AsPc1 or AsPc1/CAF19 tumors. (E) Representative Ki-67 stained sections of tumors from (i) AsPc1-HBSS, (ii) AsPc1-AuNP, (iii) AsPc1/CAF19-HBSS, and (iv) AsPc1/CAF19-AuNP groups. Images were acquired using 4× objective and quantified using ImageJ (NIH). (F) Histograms representing number of tunnel stained nuclei in HBSS or AuNP-treated AsPc1 only or AsPc1/CAF19 tumors. (G) Representative tunnel stained sections of tumors from (i) AsPc1-HBSS, (ii) AsPc1-AuNP, (iii) AsPc1/CAF19-HBSS, and (iv) AsPc1/CAF19-AuNP groups. Images were acquired using 4× objective and quantified using ImageJ (NIH). Statistical analysis was performed using One-way ANOVA followed by Newman–Keuls multiple comparison test. *p ≤ 0.05, **p ≤ 0.01, ***p ≤ 0.001.
Figure 8.

Inhibition of desmoplasia in orthotopic models of pancreatic cancer by AuNP. (A) Whiskers min-to-max plot of α-SMA positive area in HBSS or AuNP-treated AsPc1 or AsPc1/CAF19 tumors and their (B) representative α-SMA stained sections of (i) AsPc1-HBSS, (ii) AsPc1-AuNP, (iii) AsPc1/CAF19-HBSS, and (iv) AsPc1/CAF19-AuNP groups. Statistical analysis was performed using One-way ANOVA followed by Newman–Keuls multiple comparison test. (C) (i) NSR (ratio of strongly stained pixels to positive pixels) of fibronectin levels in HBSS and AuNP-treated AsPc1 only or AsPc1/CAF19 tumors. (ii) Percentage of positively stained pixels with fibronectin in HBSS and AuNP-treated AsPc1 only or AsPc1/CAF19 tumors. (D) Representative fibronectin stained sections of (i) AsPc1-HBSS, (ii) AsPc1-AuNP, (iii) AsPc1/CAF19-HBSS, and (iv) AsPc1/CAF19-AuNP groups. (E) Whiskers min-to-max plot showing percentage Sirius Red stained area in in HBSS or AuNP-treated AsPc1 or AsPc1+CAF19 tumors for determination of collagen levels. (F) Representative Sirius Red stained sections from (i) AsPc1-HBSS, (ii) AsPc1-AuNP, (iii) AsPc1+CAF19-HBSS, and (iv) AsPc1+CAF19-AuNP groups. (G) Whiskers min-to-max plot showing number of CD31-positive vessels per 4× field of view in HBSS or AuNP-treated AsPc1 or AsPc1+CAF19 tumors. (H) Representative CD31 stained sections of tumors from (i) AsPc1-HBSS, (ii) AsPc1-AuNP, (iii) AsPc1/CAF19-HBSS, and (iv) AsPc1/CAF19-AuNP groups.
Pancreatic ductal adenocarcinoma (PDAC) is one of the most aggressive malignancies with a notoriously dismal prognosis and is the fourth leading cause of cancer-related deaths in the United States. Unfortunately, 80–85% patients are diagnosed with unresectable, incurable advanced stage tumors placing the median survival at <6 months and the overall 5-year survival at <5%.48–50 Therefore, new therapeutic strategies are urgently needed to improve the dismal outcome in PDAC patients. The stroma, through the synthesis of extensive fibrotic proteins, presents a major clinical barrier to therapy limiting effective drug delivery in PDAC. Besides inhibiting vessel growth, the secreted stromal factors support a growth promoting niche which harbor cancer stem cells that are unresponsive to standard chemotherapy. Matrix degradation strategies that diminish the fibrotic stroma and enhance intratumoral vasculature have been recently approved by the FDA, resulting in marginal improvement of overall survival in patients with advanced-stage disease.51,52 Therefore, new therapeutic strategies are required that can disrupt the PCC–PSC crosstalk and reprogram the tumor microenvironment.
Here, we demonstrate that unmodified AuNP can effectively disrupt the crosstalk between PCC and PSC by abrogating multiple signaling cascades mediated by secreted GFs/cytokines (Figures 1C and 2B–E). By alteration of the cellular secretome, AuNPs reprogram activated PSCs to a more quiescent phenotype resulting in reduction of ECM synthesis (Figures 1D–G and 3A,C). Analysis of the AuNP-treated PCC secretome demonstrated a decrease in TGFβ1, endostatin, THBS1, and PDGFAA, which are widely implicated in the PCC–PSC crosstalk. Importantly, TGF-β is one of the potent growth factors driving PSC activation.53,54 Antiangiogenic molecules such as endostatin and THBS1, associated with the dismal prognosis in PDAC, showed marked downregulation by AuNPs.55–57 It is likely that the downregulation of antiangiogenic factors by AuNPs tilts the balance toward an angiogenic phenotype and reprograms the tumor microenvironment, resulting in an increase in tumor vasculature in the co-implantation model in vivo. Additionally other important GFs that were implicated in poor prognosis of PDAC, such as angiopoietin-1, Activin A, GM-CSF, IGFBPs, and Pentraxin-3, were also substantially depleted from the CM of PSCs.32,34 Importantly, cytokines like IL-8 and GM-CSF play a major role in PCC stemness and immune suppression, respectively, hence their downregulation by AuNPs could also potentially improve therapeutic outcomes in PDAC.3,33,34 Interestingly, inhibition of autocrine and paracrine signaling by AuNPs not only occurs through the binding and denaturation of secreted GFs, but also these effects extend beyond, altering the secretome (Figure 3B,D). Thus, the multifunctional property of AuNPs to inhibit multiple signaling cascades by a number of GFs/cytokines is promising, considering the challenges in targeting crosstalk between the PCCs and PSCs with a single agent.
Insights into GFs inter-relationship using an integrated bioinformatics approach revealed that AuNPs downregulate key hub proteins, thus affecting expression of other network proteins. This is expected as gene products often act as connected entities to achieve complex functional hierarchy of disease phenotype.58,59 Recently, we exploited such an approach in identifying new therapeutic targets in ovarian cancer.60 From the PSC network, we identified THBS1, PTX3, Activin A, uPA, and bFGF as important “hub” nodes, which were further validated in in vitro experiments (Figure 5A,B). A similar approach in PCCs led to the identification of THBS1, endostatin, and TGF-β1 as important “hub” nodes (Figure 5C). The bioinformatics approach was further validated by the observation that PDGFAA, sharing low connectivity in the network, failed to alter expression of other node proteins, whereas THBS1 with high connectivity had a significantly greater effect (Figure 5D). Interestingly our investigations identify autoregulatory mechanisms for THBS1 and Activin A and also provide an understanding of complex heteroregulatory GF networks that exist in tumor microenvironments. In addition, an integrated bioinformatics approach delineates GF autoregulation and heteroregulation as major contributing factors guiding alteration of the secretome in PCCs and PSCs by AuNPs.
PCCs and activated PSCs due to their high growth rate require an increased rate of protein synthesis and folding.61,62 The ER is the site of regulated production of secretory and membrane-bound proteins, which further ensures proper folding, and misfolded proteins are degraded through the ER-associated degradation (ERAD) and the RIDD pathway. IRE1, a transmembrane protein present in the ER, under stress orchestrates ERAD through XBP-1 cleavage, enhancing activation of ER chaperones and through RIDD reduces translation and protein load in the ER.62 Our results demonstrate that 20 nm AuNP induces ER-stress and activates specifically the IRE1 pathway (Figure 6A) In fact, several secreted proteins including insulin and SPARC have been found to be RIDD targets of IRE1α.40,42 By utilizing RIDD active and inactive IRE1α constructs, we establish downregulation of endostatin and MMP-9 in AsPc1 cells by AuNPs through activation of the RIDD pathway (Figure 6B–D). Thus, the therapeutic property of 20 nm AuNPs is realized through the depletion of important HB-GFs, triggering auto and heteroregulation of secretory proteins and also through activation of IRE1 leading to RIDD-mediated suppression of protein translation.
Using human orthotopic models of pancreatic cancer, we assessed the antitumor and antidesmoplastic property of AuNPs in vivo. AuNP treatment significantly reduced tumor growth that was further confirmed through histologic analysis (Figure 7A,D). The co-implantation model yielded larger tumors as previously reported confirming PCC–PSC crosstalk in vivo.8 Further characterization of the xenografts for fibronectin, collagen, and α-SMA showed significant reduction in these pro-fibrotic components by AuNP, consistent with our in vitro observations (Figure 8A–F). Inhibition of pro-fibrotic components by AuNP resulted in an increase in intratumoral vasculature in the co-implantation model (Figure 8D). Recent studies demonstrate that reprogramming of the tumor stroma induces angiogenesis, thereby, improving drug delivery and enhancing therapeutic efficacy.14 Thus, reprogramming of the tumor microenvironment by AuNP opens up possibilities to improve drug efficacy by enhancing drug delivery and purports future applications as a chemosensitizing agent in PDAC.
CONCLUSION
Although recent studies emphasize the importance of interrogating and disrupting cellular communications between PSCs and PCCs to improve therapeutic efficacy, effective strategies are limited. Here, we used AuNPs as a tool to effectively disrupt multiple signaling pathways that are involved in the perpetual activation of PSCs and the PCC–PSC crosstalk. Our findings present AuNP as a promising tool to interrogate tumor microenvironments and identify critical molecules responsible for poor outcomes.
METHODS
Chemicals and Media.
Details of Materials are provided in the Supporting Information (SI) Materials and Methods.
Synthesis and Characterization of 20 nm AuNP.
Twenty nm AuNPs were synthesized and characterized as described previously in endotoxin-free water from G Biosciences (St. Louis, MO, U.S.A.).19 More details are provided in the SI Materials and Methods.
Instrumental Neutron Activation Analysis (INAA).
Gold content in the nanoparticle solution, cell pellets, and tissues was determined by instrumental neutron activation analysis at the University of Missouri Research Reactor Center as previously described.19,43,63,64 In brief, nanoparticle solution/cell pellet/tissue samples were weighed into high-density polyethylene irradiation vials and lyophilized to a dry weight. Samples were then irradiated for 90 s in a thermal flux density of approximately 5 × 10¹³ n cm−2 s−1 and allowed to decay for 24–48 h, followed by counting on a high-purity germanium detector for 3600 s at a sample-to-detector distance of approximately 5 cm. Gold content in each sample was determined by measuring 411.8 keV gamma ray from the β- decay of 198Au (t1/2 = 2.7 days) using the Genie ESP spectroscopy package from Canberra. Comparator standards of 0.1 μg (n = 3) and 1.0 μg (n = 3) prepared from certified standard solutions (High-Purity Standards) were used with each sample set.
Transmission Electron Microscopy (TEM).
TEM samples (cell pellets and tissues) were fixed in fixative solution and processed as previously described.43,63 Ultrathin sections were stained with lead citrate and uranyl acetate before viewing on a Hitachi H7600 transmission electron microscope at 80 kV equipped with a 2k × 2k AMT digital camera.
Cell Lines and Culture.
Isolation of PSCs65 and culture conditions for various cell lines are provided in the SI Materials and Methods.
Conditioned Media (CM) Experiments.
CM from untreated or AuNP-treated cells were generated as follows: On day 0, 2 × 10⁶ cells of PCCs or PSCs were plated in 150 mm culture dishes. After 24 h, on day 1, the media was replaced with serum-free media. On day 2 (24 h interval), the media was again replaced with fresh serum-free media and treated with various doses of freshly prepared 20 nm AuNP. After 48 h treatment, on day 4, the media was collected, spun down at 3500 rpm for 15 min to remove cell debris and AuNPs, filtered through a 0.22 μm filter, and diluted with an equal volume of fresh serum-free media before subsequent experiments, as reported previously.27
3H-Thymidine Incorporation Assay.
This assay was performed as described previously.19 Details of the procedure are provided in the SI Materials and Methods.
Immunoblotting.
Immunoblotting was performed following a previous reported literature procedure.66 The details of all antibodies used are provided in Supplementary Table S7.
Real-Time PCR (qRT-PCR).
Quantitative real-time PCR was performed as reported earlier.19 The details of method (SI Materials and Methods) and the primers used are provided in Supplementary Table S8.
Cell Viability Assay.
MTS assay was performed on PCC treated with PSC CM and vice versa following the reported protocol and manufacturers’ instruction (Promega).66
Antibody Arrays.
This assay was performed following literature reported methods.19 Details are provided in the SI Materials and Methods.
Animal Studies.
48 female athymic nude mice (NCrnu; 5–6 wk old) were divided into 3 groups receiving 1 × 10⁶ CAF19 cells or 1 × 10⁶ AsPc1 cells only or a mixture of 1 × 10⁶ AsPc1 and 1 × 10⁶ CAF19 cells in 100 μL PBS into the head of the pancreas. Four days post-implantation, the animals in each group were randomized and divided into 2 subgroups (8 animals each), receiving daily intraperitoneal injections of 100 μL HBSS or 100 μg of AuNP in 100 μL volume. Treatment was continued for 21 days. After 21 days, the animals were euthanized, and tumors and tissues were collected for further analyses. For details are provided in the SI Materials and Methods.
Immunocytochemistry/Immunohistochemistry.
Immunohistochemistry and immunocytochemistry were performed on formalin-fixed paraffin embedded tissues as reported previously.19 Details of the procedure are given in the SI Materials and Methods.
Statistical Analysis.
For in vitro experiments, comparison between two groups were carried out using two-sided Students t-test, and for comparison between three or more groups, One-way ANOVA followed by Newman–Keuls’ multiple comparison test were performed. For statistical analysis of in vivo data, One-way ANOVA followed by Newman–Keuls’ multiple comparison test were used. The p-value ≤0.05 was deemed significant.
iTAF and AsPc1 Network Construction.
iTAF network was constructed using a list of compiled from 22 proteins using GeneMania database. AsPc1 network was constructed using a list of 16 proteins using GeneMania and STRING databases. Nodes and edges and the source of interactions used to derive networks are provided in SuppNetworkAnalysis.xlsx.
Network Analysis.
We used quantitative network assessment parameters closeness centrality67 and radiality68 to identify hub proteins69 from the iTAF and AsPc1 protein networks.70,71 Details are provided in the SI Materials and Methods.
Enrichment Analysis of Proteins in iTAF and AsPc1 Networks.
Gene Ontology, pathway, and protein domain enrichment analyses of proteins from iTAF network and AsPc1 network were performed using Enrichr using default settings.72–78 Details of the methods used are provided in the SI Materials and Methods.
Supplementary Material
ACKNOWLEDGMENTS
This work was supported by NIH grants CA135011, 2CA136494, UL1TR000067, and U54CA189201.
Footnotes
Supporting Information
The Supporting Information is available free of charge on the ACS Publications website at DOI: 10.1021/acsnano.6b02231.
Experimental details and data (PDF)
Nodes and edges and the source of interactions used to derive networks (XLS)
The authors declare no competing financial interest.
REFERENCES
- (1).Erkan M; Hausmann S; Michalski CW; Schlitter M; Fingerle AA; Dobritz M; Friess H; Kleeff J How Fibrosis Influences Imaging and Surgical Decisions in Pancreatic Cancer. Front. Physiol 2012, 3, 389. [DOI] [PMC free article] [PubMed] [Google Scholar]
- (2).Erkan M; Hausmann S; Michalski CW; Fingerle AA; Dobritz M; Kleeff J; Friess H The Role of Stroma in Pancreatic Cancer: Diagnostic and Therapeutic Implications. Nat. Rev. Gastroenterol. Hepatol 2012, 9, 454–467. [DOI] [PubMed] [Google Scholar]
- (3).Mahadevan D; Von Hoff DD Tumor-Stroma Interactions in Pancreatic Ductal Adenocarcinoma. Mol. Cancer Ther 2007, 6, 1186–1197. [DOI] [PubMed] [Google Scholar]
- (4).Apte MV; Wilson JS Dangerous Liaisons: Pancreatic Stellate Cells and Pancreatic Cancer Cells. J. Gastroenterol. Hepatol 2012, 27, 69–74. [DOI] [PubMed] [Google Scholar]
- (5).Omary MB; Lugea A; Lowe AW; Pandol SJ The Pancreatic Stellate Cell: A Star on the Rise in Pancreatic Diseases. J. Clin. Invest 2007, 117, 50–59. [DOI] [PMC free article] [PubMed] [Google Scholar]
- (6).Apte MV; Park S; Phillips PA; Santucci N; Goldstein D; Kumar RK; Ramm GA; Buchler M; Friess H; McCarroll JA; Keogh G; Merrett N; Pirola R; Wilson JS Desmoplastic Reaction in Pancreatic Cancer: Role of Pancreatic Stellate Cells. Pancreas 2004, 29, 179–187. [DOI] [PubMed] [Google Scholar]
- (7).Mueller MM; Fusenig NE Friends or Foes - Bipolar Effects of the Tumour Stroma in Cancer. Nat. Rev. Cancer 2004, 4, 839–849. [DOI] [PubMed] [Google Scholar]
- (8).Vonlaufen A; Joshi S; Qu C; Phillips PA; Xu Z; Parker NR; Toi CS; Pirola RC; Wilson JS; Goldstein D; Apte MV Pancreatic Stellate Cells: Partners in Crime with Pancreatic Cancer Cells. Cancer Res. 2008, 68, 2085–2093. [DOI] [PubMed] [Google Scholar]
- (9).Seton-Rogers S Pancreatic Cancer: Fibroblast Co-conspirators. Nat. Rev. Cancer 2011, 11, 758. [DOI] [PubMed] [Google Scholar]
- (10).Apte MV; Wilson JS; Lugea A; Pandol SJ A Starring Role for Stellate Cells in the Pancreatic Cancer Microenvironment. Gastroenterology 2013, 144, 1210–1219. [DOI] [PMC free article] [PubMed] [Google Scholar]
- (11).Bailey JM; Swanson BJ; Hamada T; Eggers JP; Singh PK; Caffery T; Ouellette MM; Hollingsworth MA Sonic Hedgehog Promotes Desmoplasia in Pancreatic Cancer. Clin. Cancer Res 2008, 14, 5995–6004. [DOI] [PMC free article] [PubMed] [Google Scholar]
- (12).Torrisani J; Bournet B; Cordelier P; Buscail L New Molecular Targets in Pancreatic Cancer. Bull. Cancer 2008, 95, 503–512. [DOI] [PubMed] [Google Scholar]
- (13).Abramovitch S; Dahan-Bachar L; Sharvit E; Weisman Y; Ben Tov A; Brazowski E; Reif S Vitamin D Inhibits Proliferation and Profibrotic Marker Expression in Hepatic Stellate Cells and Decreases Thioacetamide-Induced Liver Fibrosis in Rats. Gut 2011, 60, 1728–1737. [DOI] [PubMed] [Google Scholar]
- (14).Sherman MH; Yu RT; Engle DD; Ding N; Atkins AR; Tiriac H; Collisson EA; Connor F; Van Dyke T; Kozlov S; Martin P; Tseng TW; Dawson DW; Donahue TR; Masamune A; Shimosegawa T; Apte MV; Wilson JS; Ng B; Lau SL; et al. Vitamin D Receptor-Mediated Stromal Reprogramming Suppresses Pancreatitis and Enhances Pancreatic Cancer Therapy. Cell 2014, 159, 80–93. [DOI] [PMC free article] [PubMed] [Google Scholar]
- (15).Sinn M; Denkert C; Striefler JK; Pelzer U; Stieler JM; Bahra M; Lohneis P; Dorken B; Oettle H; Riess H; Kleeff J Alpha-Smooth Muscle Actin Expression and Desmoplastic Stromal Reaction in Pancreatic Cancer: Results From the CONKO-001 Study. Br. J. Cancer 2014, 111, 1917–1923. [DOI] [PMC free article] [PubMed] [Google Scholar]
- (16).Erkan M; Michalski CW; Rieder S; Reiser-Erkan C; Abiatari I; Kolb A; Giese NA; Esposito I; Friess H; Kleeff J The Activated Stroma Index Is a Novel and Independent Prognostic Marker in Pancreatic Ductal Adenocarcinoma. Clin. Gastroenterol. Hepatol 2008, 6, 1155–1161. [DOI] [PubMed] [Google Scholar]
- (17).Rhim AD; Oberstein PE; Thomas DH; Mirek ET; Palermo CF; Sastra SA; Dekleva EN; Saunders T; Becerra CP; Tattersall IW; Westphalen CB; Kitajewski J; Fernandez-Barrena MG; Fernandez-Zapico ME; Iacobuzio-Donahue C; Olive KP; Stanger BZ Stromal Elements Act to Restrain, Rather Than Support, Pancreatic Ductal Adenocarcinoma. Cancer Cell 2014, 25, 735–747. [DOI] [PMC free article] [PubMed] [Google Scholar]
- (18).Ozdemir BC; Pentcheva-Hoang T; Carstens JL; Zheng X; Wu CC; Simpson TR; Laklai H; Sugimoto H; Kahlert C; Novitskiy SV; De Jesus-Acosta A; Sharma P; Heidari P; Mahmood U; Chin L; Moses HL; Weaver VM; Maitra A; Allison JP; LeBleu VS; et al. Depletion of Carcinoma-Associated Fibroblasts and Fibrosis Induces Immunosuppression and Accelerates Pancreas Cancer with Reduced Survival. Cancer Cell 2014, 25, 719–734. [DOI] [PMC free article] [PubMed] [Google Scholar]
- (19).Arvizo RR; Saha S; Wang E; Robertson JD; Bhattacharya R; Mukherjee P Inhibition of Tumor Growth and Metastasis by a Self-Therapeutic Nanoparticle. Proc. Natl. Acad. Sci. U. S. A 2013, 110, 6700–6705. [DOI] [PMC free article] [PubMed] [Google Scholar]
- (20).Tsai YY; Huang YH; Chao YL; Hu KY; Chin LT; Chou SH; Hour AL; Yao YD; Tu CS; Liang YJ; Tsai CY; Wu HY; Tan SW; Chen HM Identification of the Nanogold Particle-Induced Endoplasmic Reticulum Stress by Omic Techniques and Systems Biology Analysis. ACS Nano 2011, 5, 9354–9369. [DOI] [PubMed] [Google Scholar]
- (21).Dhillon AS; Hagan S; Rath O; Kolch W MAP Kinase Signalling Pathways in Cancer. Oncogene 2007, 26, 3279–3290. [DOI] [PubMed] [Google Scholar]
- (22).Albury TM; Pandey V; Gitto SB; Dominguez L; Spinel LP; Talarchek J; Klein-Szanto AJ; Testa JR; Altomare DA Constitutively Active Akt1 Cooperates with KRasG12D to Accelerate In Vivo Pancreatic Tumor Onset and Progression. Neoplasia 2015, 17, 175–182. [DOI] [PMC free article] [PubMed] [Google Scholar]
- (23).Wehr AY; Furth EE; Sangar V; Blair IA; Yu KH Analysis of the Human Pancreatic Stellate Cell Secreted Proteome. Pancreas 2011, 40, 557–566. [DOI] [PMC free article] [PubMed] [Google Scholar]
- (24).Apte MV; Haber PS; Applegate TL; Norton ID; McCaughan GW; Korsten MA; Pirola RC; Wilson JS Periacinar Stellate Shaped Cells in Rat Pancreas: Identification, Isolation, and Culture. Gut 1998, 43, 128–133. [DOI] [PMC free article] [PubMed] [Google Scholar]
- (25).Kang N; Shah VH; Urrutia R Membrane-to-Nucleus Signals and Epigenetic Mechanisms for Myofibroblastic Activation and Desmoplastic Stroma: Potential Therapeutic Targets for Liver Metastasis? Mol. Cancer Res 2015, 13, 604–612. [DOI] [PMC free article] [PubMed] [Google Scholar]
- (26).Iovanna JL; Marks DL; Fernandez-Zapico ME; Urrutia R Mechanistic Insights into Self-Reinforcing Processes Driving Abnormal Histogenesis During the Development of Pancreatic Cancer. Am. J. Pathol 2013, 182, 1078–1086. [DOI] [PMC free article] [PubMed] [Google Scholar]
- (27).Straussman R; Morikawa T; Shee K; Barzily-Rokni M; Qian ZR; Du J; Davis A; Mongare MM; Gould J; Frederick DT; Cooper ZA; Chapman PB; Solit DB; Ribas A; Lo RS; Flaherty KT; Ogino S; Wargo JA; Golub TR Tumour MicroEnvironment elicits Innate Resistance to RAF Inhibitors Through HGF Secretion. Nature 2012, 487, 500–504. [DOI] [PMC free article] [PubMed] [Google Scholar]
- (28).Mukherjee P; Bhattacharya R; Wang P; Wang L; Basu S; Nagy JA; Atala A; Mukhopadhyay D; Soker S Antiangiogenic Properties of Gold Nanoparticles. Clin. Cancer Res 2005, 11, 3530–3534. [DOI] [PubMed] [Google Scholar]
- (29).Arvizo RR; Rana S; Miranda OR; Bhattacharya R; Rotello VM; Mukherjee P Mechanism of Anti-Angiogenic Property of Gold Nanoparticles: Role of Nanoparticle Size and Surface Charge. Nanomedicine 2011, 7, 580–587. [DOI] [PMC free article] [PubMed] [Google Scholar]
- (30).Kondo S; Ueno H; Hosoi H; Hashimoto J; Morizane C; Koizumi F; Tamura K; Okusaka T Clinical impact of Pentraxin Family Expression on Prognosis of Pancreatic Carcinoma. Br. J. Cancer 2013, 109, 739–746. [DOI] [PMC free article] [PubMed] [Google Scholar]
- (31).Neesse A; Michl P; Frese KK; Feig C; Cook N; Jacobetz MA; Lolkema MP; Buchholz M; Olive KP; Gress TM; Tuveson DA Stromal Biology and Therapy in Pancreatic Cancer. Gut 2011, 60, 861–868. [DOI] [PubMed] [Google Scholar]
- (32).Lonardo E; Hermann PC; Mueller MT; Huber S; Balic A; Miranda-Lorenzo I; Zagorac S; Alcala S; Rodriguez-Arabaolaza I; Ramirez JC; Torres-Ruiz R; Garcia E; Hidalgo M; Cebrian DA; Heuchel R; Lohr M; Berger F; Bartenstein P; Aicher A; Heeschen C Nodal/Activin Signaling Drives Self-Renewal and Tumorigenicity of Pancreatic Cancer Stem Cells and Provides a Target for Combined Drug Therapy. Cell Stem Cell 2011, 9, 433–446. [DOI] [PubMed] [Google Scholar]
- (33).Chen LY; Fan J; Chen H; Meng ZQ; Chen Z; Wang P; Liu LM The IL-8/CXCR1 Axis Is Associated with Cancer Stem Cell-Like Properties and Correlates with Clinical Prognosis in Human Pancreatic Cancer Cases. Sci. Rep 2014, 4, 5911. [DOI] [PMC free article] [PubMed] [Google Scholar]
- (34).Bayne LJ; Beatty GL; Jhala N; Clark CE; Rhim AD; Stanger BZ; Vonderheide RH Tumor-Derived Granulocyte-Macrophage Colony-Stimulating Factor Regulates Myeloid Inflammation and T Cell Immunity in Pancreatic Cancer. Cancer Cell 2012, 21, 822–835. [DOI] [PMC free article] [PubMed] [Google Scholar]
- (35).Eser S; Schnieke A; Schneider G; Saur D Oncogenic KRAS Signalling in Pancreatic Cancer. Br. J. Cancer 2014, 111, 817–822. [DOI] [PMC free article] [PubMed] [Google Scholar]
- (36).Xu Z; Shen MX; Ma DZ; Wang LY; Zha XL TGF-Beta1-Promoted Epithelial-to-Mesenchymal Transformation and Cell Adhesion Contribute to TGF-Beta1-Enhanced Cell Migration in SMMC-7721 Cells. Cell Res 2003, 13, 343–350. [DOI] [PubMed] [Google Scholar]
- (37).Ferreira MC; Witz CA; Hammes LS; Kirma N; Petraglia F; Schenken RS; Reis FM Activin A Increases Invasiveness of Endometrial Cells in an in vitro Model of Human Peritoneum. Mol. Hum. Reprod 2008, 14, 301–307. [DOI] [PubMed] [Google Scholar]
- (38).Accornero P; Miretti S; Starvaggi Cucuzza L; Martignani E; Baratta M Epidermal Growth Factor and Hepatocyte Growth Factor Cooperate to Enhance Cell Proliferation, Scatter, and Invasion in Murine Mammary Epithelial Cells. J. Mol. Endocrinol 2010, 44, 115–125. [DOI] [PubMed] [Google Scholar]
- (39).Watzlawik JO; Warrington AE; Rodriguez M PDGF is Required for Remyelination-Promoting IgM Stimulation of Oligodendrocyte Progenitor Cell Proliferation. PLoS One 2013, 8, e55149. [DOI] [PMC free article] [PubMed] [Google Scholar]
- (40).Maurel M; Chevet E; Tavernier J; Gerlo S Getting RIDD of RNA: IRE1 in Cell Fate Regulation. Trends Biochem. Sci 2014, 39, 245–254. [DOI] [PubMed] [Google Scholar]
- (41).Hollien J; Lin JH; Li H; Stevens N; Walter P; Weissman JS Regulated Ire1-Dependent decay of Messenger RNAs in Mammalian Cells. J. Cell Biol 2009, 186, 323–331. [DOI] [PMC free article] [PubMed] [Google Scholar]
- (42).Lipson KL; Ghosh R; Urano F The Role of Ire1Alpha in the Degradation of Insulin mRNA in Pancreatic Beta-Cells. PLoS One 2008, 3, e1648. [DOI] [PMC free article] [PubMed] [Google Scholar]
- (43).Kudgus RA; Szabolcs A; Khan JA; Walden CA; Reid JM; Robertson JD; Bhattacharya R; Mukherjee P Inhibiting the Growth of Pancreatic Adenocarcinoma in vitro and in vivo Through Targeted Treatment with Designer Gold Nanotherapeutics. PLoS One 2013, 8, e57522. [DOI] [PMC free article] [PubMed] [Google Scholar]
- (44).Xiong X; Arvizo RR; Saha S; Robertson DJ; McMeekin S; Bhattacharya R; Mukherjee P Sensitization of Ovarian Cancer Cells to Cisplatin by Gold Nanoparticles . Oncotarget 2014, 5, 6453–6465. [DOI] [PMC free article] [PubMed] [Google Scholar]
- (45).Mantoni TS; Lunardi S; Al-Assar O; Masamune A; Brunner TB Pancreatic Stellate Cells Radioprotect Pancreatic Cancer Cells Through Beta1-Integrin Signaling. Cancer Res 2011, 71, 3453–3458. [DOI] [PMC free article] [PubMed] [Google Scholar]
- (46).Fraga S; Brandao A; Soares ME; Morais T; Duarte JA; Pereira L; Soares L; Neves C; Pereira E; Bastos Mde L; Carmo H Short- and Long-Term Distribution and Toxicity of Gold Nanoparticles in the Rat after a Single-Dose Intravenous Administration. Nanomedicine 2014, 10, 1757–1766. [DOI] [PubMed] [Google Scholar]
- (47).Hainfeld JF; Slatkin DN; Focella TM; Smilowitz HM Gold nanoparticles: A New X-Ray Contrast Agent. Br. J. Radiol 2006, 79, 248–253. [DOI] [PubMed] [Google Scholar]
- (48).Wolfgang CL; Herman JM; Laheru DA; Klein AP; Erdek MA; Fishman EK; Hruban RH Recent Progress in Pancreatic Cancer. Ca-Cancer J. Clin 2013, 63, 318–348. [DOI] [PMC free article] [PubMed] [Google Scholar]
- (49).Kleeff J; C M; Friess H; Buchler MW Pancreatic Cancer: From Bench to 5-Year Survival. Pancreas 2006, 33, 111–118. [DOI] [PubMed] [Google Scholar]
- (50).Jemal A; R S; Xu J; Ward E Cancer Statistics, 2010. Ca-Cancer J. Clin 2010, 60, 277–300. [DOI] [PubMed] [Google Scholar]
- (51).Provenzano PP; Cuevas C; Chang AE; Goel VK; Von Hoff DD; Hingorani SR Enzymatic Targeting of the Stroma Ablates Physical Barriers to Treatment of Pancreatic Ductal Adenocarcinoma. Cancer Cell 2012, 21, 418–429. [DOI] [PMC free article] [PubMed] [Google Scholar]
- (52).Neesse A; Frese KK; Bapiro TE; Nakagawa T; Sternlicht MD; Seeley TW; Pilarsky C; Jodrell DI; Spong SM; Tuveson DA CTGF Antagonism with mAb FG-3019 Enhances Chemotherapy Response Without Increasing Drug Delivery in Murine Ductal Pancreas Cancer. Proc. Natl. Acad. Sci. U. S. A 2013, 110, 12325–12330. [DOI] [PMC free article] [PubMed] [Google Scholar]
- (53).Leask A; Abraham DJ TGF-Beta Signaling and the Fibrotic Response. FASEB J 2004, 18, 816–827. [DOI] [PubMed] [Google Scholar]
- (54).Grotendorst GR Connective Tissue Growth Factor: A Mediator of TGF-Beta Action on Fibroblasts. Cytokine Growth Factor Rev 1997, 8, 171–179. [DOI] [PubMed] [Google Scholar]
- (55).Ohlund D; Ardnor B; Oman M; Naredi P; Sund M Expression Pattern and Circulating Levels of Endostatin in Patients with Pancreas Cancer. Int. J. Cancer 2008, 122, 2805–2810. [DOI] [PubMed] [Google Scholar]
- (56).Tobita K; Kijima H; Dowaki S; Oida Y; Kashiwagi H; Ishii M; Sugio Y; Sekka T; Ohtani Y; Tanaka M; Inokuchi S; Makuuchi H Thrombospondin-1 Expression as a Prognostic Predictor of Pancreatic Ductal Carcinoma. Int. J. Oncol 2002, 21, 1189–1195. [PubMed] [Google Scholar]
- (57).Kazerounian S; Yee KO; Lawler J Thrombospondins in Cancer. Cell. Mol. Life Sci 2008, 65, 700–712. [DOI] [PMC free article] [PubMed] [Google Scholar]
- (58).Barabasi AL; Oltvai ZN Network Biology: Understanding the Cell’s Functional Organization. Nat. Rev. Genet 2004, 5, 101–113. [DOI] [PubMed] [Google Scholar]
- (59).Dudley JT; Tibshirani R; Deshpande T; Butte AJ Disease Signatures Are Robust Across Tissues and Experiments. Mol. Syst. Biol 2009, 5, 307. [DOI] [PMC free article] [PubMed] [Google Scholar]
- (60).Giri K; Shameer K; Zimmermann MT; Saha S; Chakraborty PK; Sharma A; Arvizo RR; Madden BJ; McCormick DJ; Kocher JP; Bhattacharya R; Mukherjee P Understanding Protein-Nanoparticle Interaction: A New Gateway to Disease Therapeutics. Bioconjugate Chem 2014, 25, 1078–1090. [DOI] [PMC free article] [PubMed] [Google Scholar]
- (61).Apte MV; Pirola RC; Wilson JS Pancreatic Stellate Cells: A Starring Role in Normal and Diseased Pancreas. Front. Physiol 2012, 3, 344. [DOI] [PMC free article] [PubMed] [Google Scholar]
- (62).Ozcan L; Tabas I Role of Endoplasmic Reticulum Stress in Metabolic Disease and Other Sisorders. Annu. Rev. Med 2012, 63, 317–328. [DOI] [PMC free article] [PubMed] [Google Scholar]
- (63).Khan JA; Kudgus RA; Szabolcs A; Dutta S; Wang E; Cao S; Curran GL; Shah V; Curley S; Mukhopadhyay D; Robertson JD; Bhattacharya R; Mukherjee P Designing Nanoconjugates to Effectively Target Pancreatic Cancer Cells in vitro and in vivo. PLoS One 2011, 6, e20347. [DOI] [PMC free article] [PubMed] [Google Scholar]
- (64).Arvizo RR; Rana S; Miranda OR; Bhattacharya R; Rotello VM; Mukherjee P Mechanism of Anti-Angiogenic Property of Gold Nanoparticles: Role of Nanoparticle Size and Surface Charge. Nanomedicine 2011, 7, 580–587. [DOI] [PMC free article] [PubMed] [Google Scholar]
- (65).Bachem MG; Schneider E; Gross H; Weidenbach H; Schmid RM; Menke A; Siech M; Beger H; Grunert A; Adler G Identification, Culture, and Characterization of Pancreatic Stellate Cells in Rats and Humans. Gastroenterology 1998, 115, 421–432. [DOI] [PubMed] [Google Scholar]
- (66).Bhattacharyya S; Saha S; Giri K; Lanza IR; Nair KS; Jennings NB; Rodriguez-Aguayo C; Lopez-Berestein G; Basal E; Weaver AL; Visscher DW; Cliby W; Sood AK; Bhattacharya R; Mukherjee P Cystathionine Beta-Synthase (CBS) Contributes to Advanced Ovarian Cancer Progression and Drug Resistance. PLoS One 2013, 8, e79167. [DOI] [PMC free article] [PubMed] [Google Scholar]
- (67).Newman MEJ A measure of betweenness centrality based on random walks. Social Networks 2005, 27, 39–54. [Google Scholar]
- (68).Brandes U A Faster Algorithm for Betweenness Centrality. J. Math. Sociol 2001, 25, 163–177. [Google Scholar]
- (69).Jeong H; Mason SP; Barabasi AL; Oltvai ZN Lethality and Centrality in Protein Networks. Nature 2001, 411, 41–42. [DOI] [PubMed] [Google Scholar]
- (70).Yoon J; Blumer A; Lee K An Algorithm for Modularity Analysis of Directed and Weighted Biological Networks Based on Edge-Betweenness Centrality. Bioinformatics 2006, 22, 3106–3108. [DOI] [PubMed] [Google Scholar]
- (71).Doncheva NT; Assenov Y; Domingues FS; Albrecht M Topological Analysis and Interactive Visualization of Biological Networks and Protein Structures. Nat. Protoc 2012, 7, 670–685. [DOI] [PubMed] [Google Scholar]
- (72).Chen EY; Tan CM; Kou Y; Duan Q; Wang Z; Meirelles GV; Clark NR; Ma’ayan A Enrichr: Interactive and Collaborative HTML5 Gene List Enrichment Analysis Tool. BMC Bioinf 2013, 14, 128. [DOI] [PMC free article] [PubMed] [Google Scholar]
- (73).Kanehisa M; Goto S; Sato Y; Kawashima M; Furumichi M; Tanabe M Data, Information, Knowledge and Principle: Back to Metabolism in KEGG. Nucleic Acids Res 2014, 42, D199–205. [DOI] [PMC free article] [PubMed] [Google Scholar]
- (74).Mi H; Lazareva-Ulitsky B; Loo R; Kejariwal A; Vandergriff J; Rabkin S; Guo N; Muruganujan A; Doremieux O; Campbell MJ; Kitano H; Thomas PD The PANTHER Database of Protein Families, Subfamilies, Functions and Pathways. Nucleic Acids Res 2005, 33, D284–288. [DOI] [PMC free article] [PubMed] [Google Scholar]
- (75).Croft D; Mundo AF; Haw R; Milacic M; Weiser J; Wu G; Caudy M; Garapati P; Gillespie M; Kamdar MR; Jassal B; Jupe S; Matthews L; May B; Palatnik S; Rothfels K; Shamovsky V; Song H; Williams M; Birney E; et al. The Reactome Pathway Knowledgebase. Nucleic Acids Res 2014, 42, D472–477. [DOI] [PMC free article] [PubMed] [Google Scholar]
- (76).Huntley RP; Sawford T; Mutowo-Meullenet P; Shypitsyna A; Bonilla C; Martin MJ; O’Donovan C The GOA Database: Gene Ontology Annotation Updates for 2015. Nucleic Acids Res 2015, 43, D1057–1063. [DOI] [PMC free article] [PubMed] [Google Scholar]
- (77).Finn RD; Bateman A; Clements J; Coggill P; Eberhardt RY; Eddy SR; Heger A; Hetherington K; Holm L; Mistry J; Sonnhammer EL; Tate J; Punta M Pfam: The Protein Families Database. Nucleic Acids Res 2014, 42, D222–230. [DOI] [PMC free article] [PubMed] [Google Scholar]
- (78).Mitchell A; Chang HY; Daugherty L; Fraser M; Hunter S; Lopez R; McAnulla C; McMenamin C; Nuka G; Pesseat S; Sangrador-Vegas A; Scheremetjew M; Rato C; Yong SY; Bateman A; Punta M; Attwood TK; Sigrist CJ; Redaschi N; Rivoire C; et al. The InterPro protein Families Database: The Classification Resource after 15 Years. Nucleic Acids Res 2015, 43, D213–221. [DOI] [PMC free article] [PubMed] [Google Scholar]
Associated Data
This section collects any data citations, data availability statements, or supplementary materials included in this article.