Abstract
Effective cancer therapy largely depends on inducing apoptosis in cancer cells via chemotherapy and/or radiation. Monitoring apoptosis in real-time provides invaluable information for evaluating cancer therapy response and screening preclinical anticancer drugs. In this work, we describe the design, synthesis, characterization and in vitro evaluation of caspase probe 1 (CP1), a bimodal fluorescence-magnetic resonance (FL-MR) probe that exhibits simultaneous FL-MR turn-on response to caspase-3/7. Both caspases exist as inactive zymogens in normal cells but are activated during apoptosis and are unique biomarkers for this process. CP1 has three distinct components: a DOTA-Gd(III) chelate that provides the MR signal enhancement, tetraphenylethylene as the aggregation induced emission luminogen (AIEgen), and DEVD peptide which is a substrate for caspase-3/7. In response to caspase-3/7, the water-soluble peptide DEVD is cleaved and the remaining Gd(III)-AIEgen (Gad-AIE) conjugate aggregates leading to increased FL-MR signals. CP1 exhibited sensitive and selective dual FL-MR turn-on response to caspase-3/7 in vitro and was successfully tested by fluorescence imaging of apoptotic cells. Remarkably, we were able to use the FL response of CP1 to quantify the exact concentrations of inactive and active agents and accurately predict the MR signal in vitro. We have demonstrated that the aggregation-driven FL-MR probe design is a unique method for MR signal quantification. This probe design platform can be adapted for a variety of different imaging targets, opening new and exciting avenues for multimodal molecular imaging.
Graphical Abstract
INTRODUCTION
Apoptosis is a highly regulated biochemical process that irreversibly eliminates dysfunctional cells.1 Along with controlled proliferation, apoptosis establishes the basis for tissue homeostasis. In contrast, cancer is unrestricted cell growth and often acquires oncogenic mutations to evade apoptosis.2 To effectively treat cancer, anticancer therapy largely depends on inducing apoptosis in cancer cells.3 As a result, the field of apoptosis imaging was developed to monitor therapeutic response at the molecular level. The ultimate goal of these studies is to improve patient management as well as develop new therapies.4
Caspase-3 and caspase-7 are the major executioner caspases carrying out mass proteolysis that ultimately leads to apoptosis. 1c, 5 Both caspases exist as inactive zymogens in normal cells but are activated during apoptosis. As a result, elevated caspase-3/7 activities serve as unique biomarkers for apoptosis and monitoring their activities provides invaluable information for tumor therapy as well as preclinical anticancer drug selection. Through the development of molecular imaging agents sensitive to caspase-3/7, a variety of biomedical imaging techniques such as fluorescence, MRI, PET have been used to monitor apoptosis in vivo.4
MR imaging is at the forefront of experimental and clinical radiology because it has unlimited tissue penetration depth, excellent soft tissue contrast and spatiotemporal resolution without the use of ionizing irradiation. The use of paramagnetic Gd(III) based chelates further enhances the MR image contrast and improves diagnostic accuracy. Based on these Gd(III) chelates, our group pioneered the design of bioresponsive or activatable MR probes6, a unique class of molecular probes that alter the MR signal in response to biological stimuli such as pH,7 metal ion binding,8 endogenous molecule,9 enzyme activities,6b, 10 and more.11 They represent a frontier in clinical molecular imaging with a focus on probing diseases at the molecular level and developing tailored treatment options accordingly.
A fundamental challenge using bioresponsive MR probe for molecular imaging is signal validation.12 Because the local concentration of the probe is unknown, MR signal enhancement cannot be specifically assigned to activated probes versus pooling of the inactive agents. This uncertainty stems from the relatively low sensitivity of MR imaging and the limited dynamic range of most bioresponsive MR probes.12
A solution to this problem is bimodal imaging by creating a fluorescence-magnetic resonance (FL-MR) bioresponsive probe that exhibits simultaneous FL-MR signal enhancement after activation. Because fluorogenic probes have excellent sensitivity and large dynamic range, the FL signal change can be used to substantiate the MR signal enhancement in response to the biological stimulus. While a few examples of bimodal FL-MR probes have been reported, none have provided accurate MR signal quantification using FL measurements.13
To overcome these challenges, we seek a common activation mechanism for both the FL and MR components of the probe. One such mechanism is the responsive self-assembly of aggregation induced emission luminogens (AIEgens), which are fluorophores that become fluorescent upon aggregation.14 The aggregation-driven florescence mechanism has been exploited to develop AIE-based bioresponsive FL probes.15 Prior to activation, these AIE-based bioprobes remain molecularly dispersed in water. In this state, the “propeller-shaped” AIEgens have access to nonradiative decay pathways due to rotations of the phenyl rings that effectively dissipate the excited state energy and quench the fluorescence.14a Post activation, these probes form aggregates through pi-pi stacking that restricts the intramolecular motions, decreasing the nonradiative decay rate and increasing fluorescence.
Self-assembly is also a promising approach to enhance the MR signal of Gd(III)-based MR probes.10d, 16 Gd(III) chelates are able to reduce the longitudinal relaxation time (T1) and the transverse relaxation time (T2) of water protons, which translates to brighter (T1-weighted) or darker (T2-weighted) MR images, respectively. The degree to which 1 mM Gd(III) chelate can decrease the T1/T2 of water protons is expressed as relaxivity r1/r2 (mM−1s−1). At clinically relevant field strengths (0.5–3 T), the relaxivity r1 of low molecular weight Gd(III)-based CAs is positively correlated with its rotational correlation time (τR). As such, if the Gd(III) MR probe forms larger aggregates that tumble slower in solution, the τR will be lengthened allowing for more efficient Gd(III)-induced relaxation of water protons, hence enhanced T1 and T2 MR signals.17
Here we exploit the AIE aggregation as a common mechanism for both FL and MR probe activations. We describe the design, synthesis, characterization and in vitro evaluation of Caspase Probe 1 (CP1), a bimodal FL-MR probe that exhibits simultaneous FL-MR turn-on response to caspase-3/7 (Scheme 1). CP1 provides fast and robust dual turn-on response to caspase-3/7 in vitro as well as in apoptotic cells, representing the first smart FL-MR imaging probe that reports on enzyme activities. Remarkably, we were able to use the FL response of CP1 to quantify the percentage of activated probe and then quantify the MR signal. We envision that the modular design of CP1 provides a general FL-MR bimodal platform where different bioresponsive moieties can be installed to generate a variety of different bimodal molecular probes.
Scheme 1.
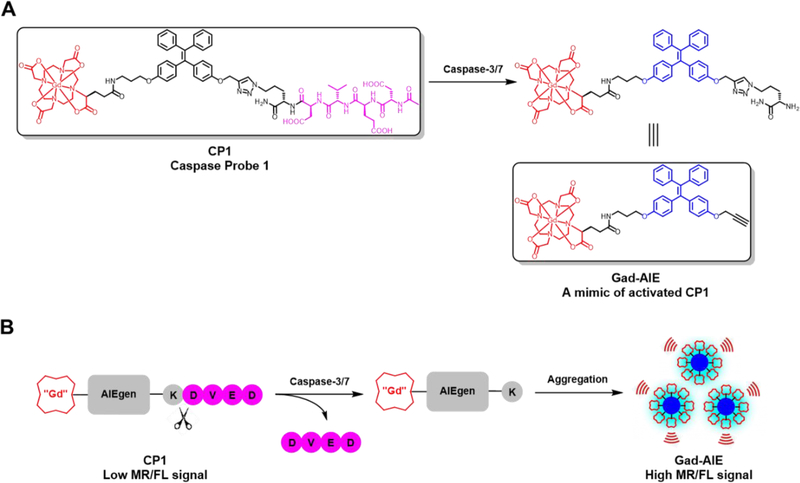
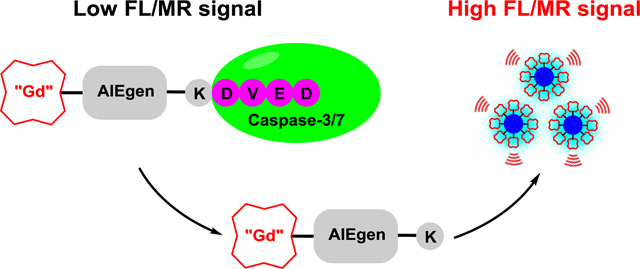
(A) Chemical structures of CP1 and Gad-AIE. Note that Gad-AIE is a mimic of the activated CP1. (B) Caspase-3/7 sensing mechanism of CP1. CP1 is soluble and well-dispersed in aqueous solution, hence having low FL/MR signal. In the presence of caspase-3/7, the water-soluble peptide DEVD is enzymatically removed, and the remaining Gad-AIE conjugate aggregates to “turn on” both FL and MR signals.
RESULTS AND DISCUSSION
Synthesis of Caspase Probe 1 (CP1).
CP1 has three key components: (1) a Gd-DOTA MR agent that shortens T1, (2) tetraphenylethylene as the AIEgen and (3) a DEVD peptide as the caspase-3/7 substrate (Scheme 1A). In the absence of caspase-3/7, CP1 remains water soluble and monomeric, hence giving low FL/MR signal. In the presence of caspase-3/7, the water-soluble peptide DEVD is cleaved, and the remaining Gd(III)-AIEgen (Gad-AIE) conjugate will aggregate to enhance both FL and MR signals (Scheme 1B). This modular design provides the ability to generate many bimodal FL-MR probes to image other enzyme of interest with ease by inserting different hydrophilic enzyme substrate instead of the DEVD peptide.
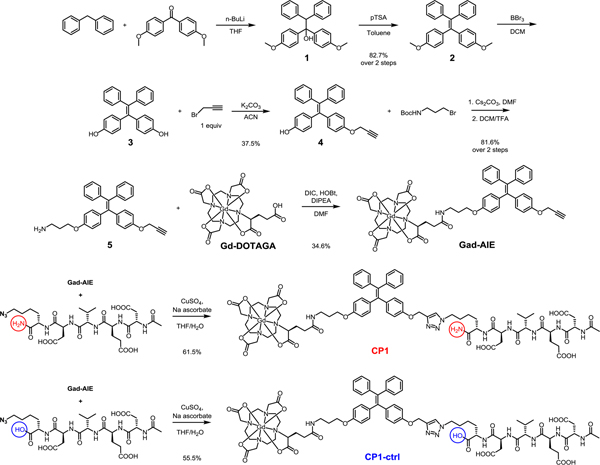
The syntheses of CP1 and CP1-ctrl (control probe) are convergent (Scheme 1). Diphenylmethane was deprotonated with n-butyllithium and subsequently reacted with 4,4’-dimethoxybenzophenone to afford the tertiary alcohol 1, which was dehydrated in the presence of pTSA to furnish the AIE core 2. Mono-propargylated intermediate 4 was obtained after sequential BBr3 demethylation and alkylation with propargyl bromide. The other phenol group in 4 was alkylated with 3-(Boc-amino)propyl bromide and subjected to TFA for Boc deprotection to afford 5. Under amide coupling conditions, 5 was conjugated with Gd-DOTAGA (1,4,7,10-tetraazacyclododececane,1-(glutaric acid)-4,7,10-triacetic acid), which was synthesized separately in 5 steps, to give Gad-AIE conjugate after RP-HPLC purification.18 Finally, the azide-functionalized DEVDK synthesized via solid phase peptide synthesis was coupled with Gad-AIE using Cu(I)-catalyzed click reaction to give CP1 after RP-HPLC purification. CP1-ctrl was synthesized with a free C-terminus in the DEVDK sequence. Since DEVD peptide with charged residue at the P1’ position has very low kcat/KM, we assumed CP1-ctrl to have very weak FL/MR turn-on response in the presence of caspase-3/7.19 We used CP1-ctrl in caspase-3 assays to show that CP1 responds only to caspase-3 and not the other chemicals present in the buffer mixture. The purity of CP1, Gad-AIE and CP1-ctrl were confirmed with analytical HPLC and ESI-MS.
Photophysical properties of CP1 and Gad-AIE.
The Gad-AIE was used as a mimic for the activated CP1 product. The UV-Vis spectrum shows the maximum absorptions for both CP1 and Gad-AIE are located at ~313 nm, which are close to that of a typical TPE fluorophore (Table S2). We evaluated the fluorescence properties of both CP1 and Gad-AIE in caspase assay buffer. A relatively high concentration of 50 μM was used to resemble the high concentration required for the MR imaging. A 50 μM solution of CP1 was not fluorescent, but the same concentration of Gad-AIE was highly fluorescent (Figure 1A). This confirms the design principle that upon cleavage of the DEVD peptide CP1 aggregates and becomes fluorescent. The AIE behavior of Gad-AIE was further studied by measuring its FL in different H2O/DMSO mixtures (Figure 1B). When the water fractions were below 90%, Gad-AIE remained non-fluorescent. However, as the water fraction approached 100%, Gad-AIE became highly emissive, a characteristic behavior of AIEgens. To quantify the concentration-dependent aggregation behavior of Gad-AIE, we measured its critical micelle concentration to be 43 μM by acquiring the FL spectra of Gad-AIE at different concentrations in water.20 This value is much lower than that of CP1 as the latter remained non-aggregated even at concentrations as high as 200 μM (Figure S1). As a result, we concluded that Gad-AIE is much more prone to aggregation than CP1.
Figure 1.
(A) Fluorescence spectra of CP1 (50 μM) and Gad-AIE (50 μM) in caspase-3 buffer. CP1’s fluorescence is quenched as it is the “off” state; whereas Gad-AIE is highly fluorescent as it is the “on” state (B) Relative FL intensities of Gad-AIE (50 μM) in different H2O/DMSO mixtures. Gad-AIE is highly emissive at high water fraction. (C) FL intensity of Gad-AIE at different concentrations. The critical micelle concentration (CMC) is 43 μM which is much lower compared to that of CP1 (CMC > 200 μM)
In vitro fluorescence detection of caspase-3/7 activities by CP1.
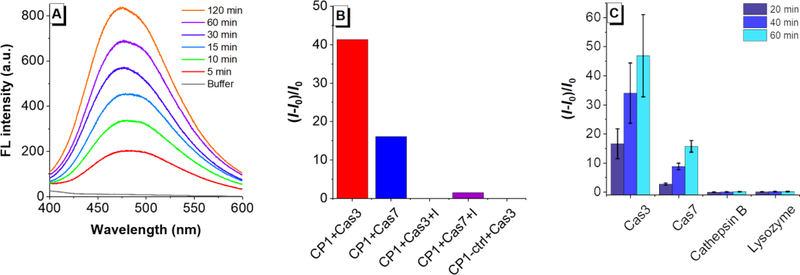
The distinct fluorescence properties of CP1 and Gad-AIE prompted us to use CP1 for caspase-3/7 detection. When CP1 was incubated with caspase-3 (0.4 μg/mL, ca.11.4 nM), it showed a significant fluorescence increase over time with a ca. 45-fold fluorescence increase only after 1 hr incubation at 37 °C (Figure 2A). The cleaved product peak was clearly identified with HPLC-MS(Figure S2). While CP1 has cross-reactivity with caspase-7 (a known DEVDase),19 its fluorescence response to caspase-3/7 was abolished when co-incubated with 50 μM of caspase-3/7 inhibitor (Figure 2B). In contrast, CP1-ctrl showed no apparent fluorescence change in the presence of caspase-3/7, indicating that it is not responsive to caspase-3/7 (Figure 2B). We then evaluated the selectivity of CP1 towards caspase-3/7 and revealed that CP1 has no fluorescence response towards cathepsin B, a possible competing enzyme or lysozyme which is very abundant in cells (Figure 2C). Collectively, these results showed that CP1 exhibited sensitive and selective FL turn-on response to caspase-3/7 in vitro.
Figure 2.
(A) Time-dependent FL turn-on response of CP1(50 μM) with caspase-3 (0.4 μg/mL). (B) Specificity study of CP1 towards caspase-3, −7. From left to right are normalized FL turn-on responses of CP1(50 μM) with caspase-3 (0.4 μg/mL); caspase-7 (0.4 μg/mL); caspase-3 (0.4 μg/mL) and its inhibitor Ac-DEVD-CHO (50 μM); caspase-7 (0.4 μg/mL) and its inhibitor Ac-DEVD-CHO (50 μM), normalized FL turn-on responses of CP1-ctrl (50 μM) with caspase-3 (0.4 μg/mL). (C) Selectivity study of CP1. From left to right are normalized FL turn-on responses of CP1 (50 μM) with caspase-3 (0.4 μg/mL); caspase-7 (0.4 μg/mL); cathepsin B (0.4 μg/mL); lysozyme (0.4 μg/mL). FL intensities were measured at 20 min, 40 min and 60 min.
In vitro fluorescence imaging of apoptotic HeLa cells with CP1.
After demonstrating CP1’s excellent sensitivity and selectivity to caspase-3/7 in vitro, we evaluated the cytotoxicity of CP1 in HeLa cells using MTS assay and found no toxicity observed in HeLa cells after 24 hrs incubation with 0.2 mM CP1 (Figure S3), indicating CP1 is biocompatible. We further evaluated the cellular uptake of CP1 in HeLa cells. After 24 hrs incubation at 50 μM, CP1 has a cellular uptake of 0.05 fmol/cell, which is abundant for FL imaging experiments (Figure S4 & S5). As a result, we tested CP1 for visualizing apoptotic cells. HeLa cells were incubated with 50 μM CP1 for 2 hrs at 37 °C and treated with medium alone or medium containing 1 μM staurosporine (STS, a known apoptosis inducer) for 1 hr.21 Prior to imaging, apoptotic and nonapoptotic cells were stained with Annexin V-Alexa Fluor 594 conjugate that fluorescently labels the exposed phosphatidylserine of apoptotic cells.
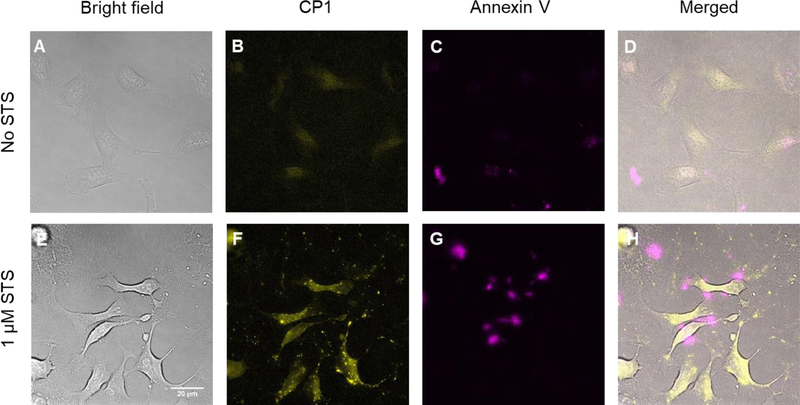
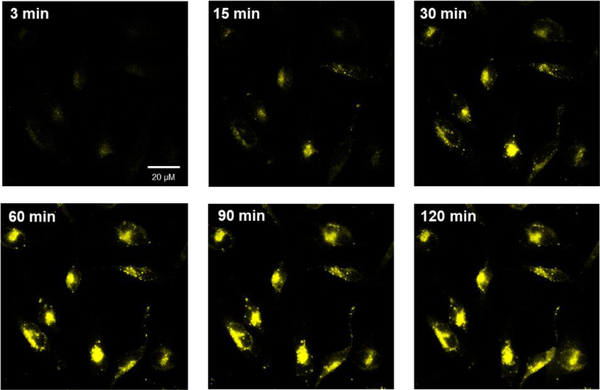
As expected, very low CP1 and Annexin V Alexa Fluor fluorescence were observed for non-apoptotic HeLa cells, indicative of little caspase-3/7 activity for these healthy cells (Figure 3B & 3C). In contrast, the apoptotic cells showed strong fluorescence signal in both CP1 and Annexin V-Alexa Fluor channels (Figure 3F & 3G), indicating elevated caspase-3/7 activities in these cells. We also performed time-lapse fluorescence imaging of apoptotic HeLa cells with CP1 (Figure 4). Healthy HeLa cells were incubated with CP1 (50 μM) for 2hrs, then with STS (1 μM) and immediately placed under the fluorescence microscope. Images were acquired every three mins over three hours. As shown in Figure 4, the fluorescence of HeLa cells increased over time, indicating increased caspase-3/7 activity during apoptosis.
Figure 3.
Fluorescence microscope images of HeLa cells. Top row (A-D) are non-apoptotic Hela cells treated with CP1 (50 μM) and co-stained with Annexin V-Alexa Fluor 594 conjugate. Annexin V-Alexa Fluor 594 labels the exposed phosphatidylserine in apoptotic cells and serves as a positive control. Bottom row (E-H) are apoptotic HeLa cells treated with CP1 (50 μM) and co-stained with Annexin V-Alexa Fluor 594. Co-localization of CP1 and Annexin V-Alexa Fluor 594 confirms CP1’s ability to identify apoptotic cells. Yellow, CP1 fluorescence. Pink, Annexin V-Alexa Fluor 594 fluorescence.
Figure 4.
Time-lapse fluorescence imaging of apoptotic HeLa cells incubated with CP1 (50 μM) prior to apoptosis induction with STS (1 μM). The fluorescence of HeLa cells increased over time, indicating elevated caspase-3/7 activity in HeLa cells during apoptosis.
In vitro MR detection of caspase-3/7 activities with CP1.
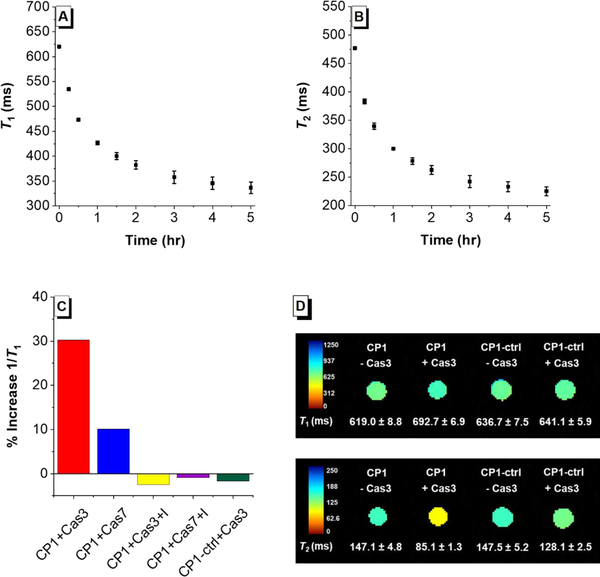
Based on the excellent FL response of CP1 with caspase-3/7, we tested its MR response to caspase-3/7. The T1 and T2 changes of CP1 solution (200 μM) in the presence of caspase-3 (0.4 μg/mL, ca. 11.4 nM) were measured with relaxometry at 1.41 T and 37 °C, and the results showed that CP1 has faster kinetics compared to a previously reported Gd(III) caspase-responsive MR probe.10d Indeed, a 45.3% increase in 1/T1 was observed after 1 hr incubation, and an 84.1% increase after 5 hrs (Figure 5A). The T2 change was even more significant, as a 59.0% increase in 1/T2 was observed after 1 hr incubation, and a remarkable 111.8% increase after 5 hrs (Figure 5B). The specificity of CP1 towards caspase-3/7 was also evaluated through relaxometry, and the results mirror that from the fluorescence assays (Figure 5C). Collectively, these results confirmed our design principle utilizing AIE aggregation as a common mechanism for both FL and MR probe activation.
Figure 5.
(A) Time-dependent T1 decrease of caspase-3 buffer solution in the presence of CP1 (200 μM) and caspase-3 (0.4 μg/mL) measured at 1.41 T. (B) Time-dependent T2 decrease of caspase-3 buffer solution in the presence of CP1 (200 μM) and caspase-3 (0.4 μg/mL) measured at 1.41 T. (C) Selectivity study of CP1 towards caspase-3/7 measured at 1.41 T. From left to right are %T1 increase of CP1(200 μM) with caspase-3 (0.4 μg/mL), caspase-7, caspase-3 (0.4 μg/mL) and its inhibitor Ac-DEVD-CHO (50 μM); caspase-7and its inhibitor Ac-DEVD-CHO (50 μM); CP1-ctrl with caspase-3. (D) Top row: T1-weighted MR images of CP1 and CP1-ctrl solution incubated with and without caspase-3 overnight. Bottom row: T2-weighted MR images of CP1 and CP1-ctrl solution incubating with and without caspase-3 overnight. MR images were acquired at 7 T, ambient temperature. These results indicate that CP1 can be used to detect caspase-3 activity using T2-weighted MR imaging at 7 T.
MR imaging at higher field strength is beneficial as it offers higher signal-to-noise ratio, better resolution and decreased imaging time.22 As such, T1- and T2-weighed MR images were acquired at 7 T for CP1 solution phantoms with and without caspase-3 incubated (Figure 5D). While τR-mediated increase of r1 is well known at low field, it does not necessarily apply at high field where a narrow τR range (0.5–4 ns) is required to achieve high r1.23 This was confirmed by the observed minimal change of T1 from 619.0 ms to 692.7 ms when CP1 was incubated with caspases-3 (Figure 5D, top row). Nonetheless, a significant decrease in T2 from 147.2 ms to 85.1 ms was seen at 7 T when CP1 was incubated with caspase-3 overnight.(Figure 5D, bottom row). Furthermore, the T1 and T2 of CP1-ctrl solution phantom only changed by 0.7 % and 12.9 % respectively in the presence of caspase-3, indicating that CP1-ctrl is not responsive towards caspase-3 in vitro as designed (Figure 5D). Finally, to evaluate whether enough CP1 enters the cells to produce a change in MR signal, we imaged HeLa cells incubated with and without CP1 (Figure S6). The T1 relaxation time of HeLa cells decreased from 1744.2 ms to 1468.0 ms when incubated with CP1, indicating that CP1 can effectively accumulate inside the cells.
Relaxivity measurements.
The relaxivities r1 and r2 of both CP1 and CP1-ctrl with and without caspase-3 overnight incubation were measured at 1.41 T and 7 T (Table 1). At 1.41 T, both the r1 and r2 of CP1 solution increased by ca. 100% in the presence of caspase-3. At 7 T, the r1 of CP1 did not change in the presence of caspase-3 but its r2 increased by 200%. The r1 and r2 of CP1 incubated with caspase-3 closely resemble that of Gad-AIE, even though only about 60% CP1 was converted after overnight incubation with caspase-3 (Figure S2). This indicates that CP1 does not require 100% conversion to achieve significant MR signal enhancement. In contrast to CP1, CP1-ctrl showed no changes in relaxivity in the presence of caspase-3 at either field strength.
Table 1.
Relaxivities of MR probes at 1.41 T (37 °C) and 7 T (25 °C)
| MR Probe |
r1 at 1.41 T (mM−1 s−1) |
r2 at 1.41 T (mM−1 s−1) |
r1 at 7 T (mM−1 s−1) |
r2 at 7 T (mM−1 s−1) |
|---|---|---|---|---|
| CP1 | 8.1 | 9.7 | 5.8 | 10.9 |
| CP1+ caspase3a | 16.7 | 19.7 | 5.9 | 30.6 |
| CP1-ctrl | 8.8 | 10.4 | 8.0 | 20.9 |
| CP1-ctrl + Caspase3 | 8.1 | 10.8 | 6.2 | 18.7 |
| Gad-AIE | 18.9 | 30.5 | 5.8 | 32.8 |
Approximately 60 % conversion was observed after 200 μM CP1 was incubated with caspase-3 (0.4 μg/mL) overnight.
Nuclear magnetic relaxation dispersion.
To confirm that the observed T1-weighted MR signal enhanced at 1.41 T of CP1 is a result of increased rotational correlation time (τR), 1H nuclear magnetic relaxation dispersion (NMRD) profiles of CP1 and Gad-AIE at various concentrations were measured. The NMRD profiles report the water proton relaxivity at different field strengths. Parameters such as τR can be estimated from the analysis of these profiles. The presence of a relaxivity peak around 0.5–2 T (ca. 20–90 MHz proton Larmor frequency) immediately indicates a large τR corresponding to the formation of aggregates, whereas the lack of such a peak is a clear indication of fast mobility. At both 25 °C and 37 °C the relaxivity of CP1 is concentration-dependent, and higher concentration leads to greater relaxivity most likely due to the increasing formation of aggregates at higher concentrations (Figure 6A & B). Notably, the relaxivity profile of CP1 at the lowest concentration (0.25 mM) shows no relaxivity peak in the high field region, indicating the occurrence of fast mobility. In contrast, the relaxivity profiles of Gad-AIE are independent of its concentration, and the presence of a high relaxivity peak clearly indicates the formation of large aggregates (Figure 6A & B), which was confirmed by DLS measurements (Figure S7). From the concentration-dependent relaxivities of CP1, we extrapolated the relaxivity profile of fully non-aggregated CP1 (see SI and Fig 6C) and analyzed it with the Solomon-Bloembergen-Morgan (SBM) model.23c The analysis provided an estimate of τR of about 100 ns at 25 °C and 71 ns at 37 °C (Table S3). The relaxivity profile of Gad-AIE was fit using the modified Florence NMRD program to account for the presence of static ZFS (Figure 6C),24 and indicates a much longer τR of 3500 ns at 25 °C and 2700 ns at 37 °C, supporting our hypothesis that the τR increase leads to the observed MR enhancement. A detailed description for the fitting method as well as other estimated parameters are available (Table S3).
Figure 6.
Relaxivity profiles of Gad-AIE and CP1 measured (A) at 25 °C and (B) 37 °C. At all concentrations measured, Gad-AIE had consistent NMRD profiles while CP1 showed greater relaxivity at higher concentrations. Presumably, this is because Gad-AIE forms large aggregates even at low concentrations while CP1 does not. (C) Best fit profiles of Gad-AIE and of fully non-aggregated CP1, as extrapolated from its concentration dependence.
Correlating the FL and MR signal of CP1 to caspase-3.
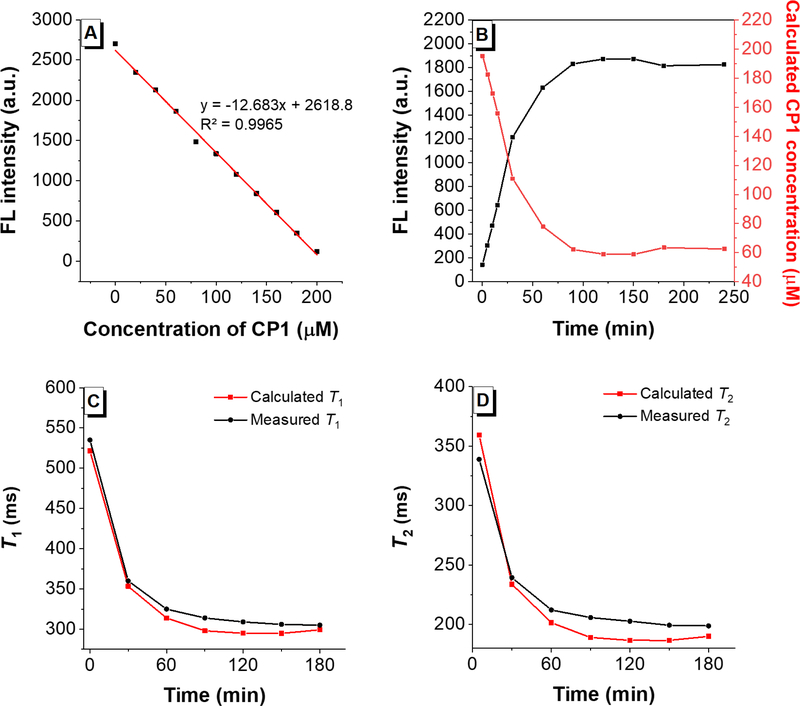
Quantification of the MR signal presents a unique challenge since the MR signal intensity depends not only on the relaxivity change due to activation but also on the concentration of the MR probe. Hence, we utilized the FL signal to quantify the concentrations of CP1 versus Gad-AIE during caspase-3 assay and to quantify the MR signal. To do so, a FL calibration curve was generated using different ratios of [CP1] and [Gad-AIE] while keeping the total concentration (200 μM) constant (Figure 7A). Then, 200 μM CP1 was incubated with caspase-3 and the fluorescence response was monitored over time (Figure 7B, black). By fitting the fluorescence of the assay solution to the FL calibration curve we calculated the concentrations of CP1 at each time point. (Figure 7B, red). The concentration of Gad-AIE at each time point would be (200 μM – [CP1]). Subsequently, the calculated concentrations of CP1 and Gad-AIE were used to compute the T1 and T2 at each point according to eq 1 and eq 2,25 respectively:
| (1) |
| (2) |
where r1/r2 and / are the relaxivities of CP1 and Gad-AIE, respectively, measured at 1.41 T; T1,d and T2,d are the diamagnetic contribution of the caspase buffer solution. The calculated T1 and T2 at each time point were plotted (Figure 7C & D, red) and compared to the measured T1 and T2 (Figure 7C & D, black), and the difference was within 10 ms. To our knowledge, this represents the first quantitative correlation between FL and MR signals of a bimodal FL-MR activated probe in vitro. Importantly, the AIE-based probe platform can differentiate between an enzyme-induced MR turn-on response and a false positive MR signal enhancement originated from the pooling of inactive agents.
Figure 7.
(A) FL intensity of different ratios of [CP1] and [Gad-AIE] with a constant total concentration of 200 μM. As expected, the concentration of CP1 is negatively correlated with the FL intensity. (B) Black: FL intensity of CP1 (200 μM) incubated with caspase-3 over time. Red: calculated CP1 concentration over the course of the assay. (C) Red: calculated time-dependent T1 decrease of caspase-3 buffer solution in the presence of CP1 (200 μM) and caspase-3. Black: measured time-dependent T1 decrease of caspase-3 buffer solution in the presence of CP1 (200 μM) and caspase-3. (D) Same as C but for T2.
CONCLUSION
We have reported the design, synthesis, and in vitro evaluations of a new bimodal caspase-activatable imaging probe CP1 that exhibits FL-MR turn-on response in both in vitro caspase enzymatic assays and apoptotic HeLa cells. Most importantly, the FL signal of CP1 can be used to quantify the concentrations of the active and inactive probes during caspase-3 assay hence accurately predicting the MR response in vitro. This FL imaging capability can potentially enable ex vivo validation of the in vivo MR imaging results, which can be challenging to interpret due to background signal and unknown local concentration of Gd(III). One potential improvement to be made is to further increase the cellular uptake of CP1 through attachment of cancer-targeting ligands. Nonetheless, results from cellular uptake experiment as well as MR imaging of cell pellet phantom indicated that enough CP1 accumulated in cells to produce enhanced MR signal. Finally, the unique AIE-based design provides a modular platform for the bimodal detection of many other biomarkers. Ongoing experiment includes in vivo MR imaging using CP1 to monitor therapy-induced tumor apoptosis followed by ex vivo fluorescence imaging of apoptotic tumors tissue.
Supplementary Material
Scheme 2.
Synthesis of Gad-AIE, CP1 and CP1-ctrl. CP1 is the “off” state prior to DEVD cleavage while Gad-AIE is a chemical mimic of the “on” state post DVED cleavage. CP1-ctrl is a control probe that is not responsive to caspase-3/7 in vitro because it has a charged C-terminus (blue). We used CP1-ctrl in caspase-3 assays to show that CP1 responds only to caspase-3 and not to the other chemicals present in the buffer mixture.
ACKNOWLEDGMENTS
H.L. and T.J.M. acknowledge support by NIH Grant P30CA060553. G.P. and C.L. would like to thank Fondazione Cassa di Risparmio di Firenze and the COST Action CA15209 (EURELAX) for financial support. Fluorescence imaging was performed with help from Dr. Jessica Hornick at Northwestern University Biological Imaging Facility generously supported by the Chemistry of Life Processes Institute and the NU Office for Research. MR imaging was performed with help from Dr. Emily Waters and Dr. Chad Haney at Center for Advanced Molecular Imaging generously supported by NCI CCSG P30 CA060553 awarded to the Robert H. Lurie Comprehensive Cancer Center. Metal analysis was performed with help from Dr. Keith MacRenaris and Rebecca Sponenburg at the Northwestern University Quantitative Bio-elemental Imaging Center generously supported by NASA Ames Research Center NNA06CB93G. HRMS was performed with help from Dr. Saman Shafaie from Integrated Molecular Structure Education and Research Center (IMSERC) at Northwestern University.
Footnotes
ASSOCIATED CONTENT
Supporting Information
The Supporting Information is available free of charge on the ACS Publications website at DOI:
Procedures for the synthesis of all compounds; characterization of synthetic intermediates by NMR and HRMS; HPLC, ESI-MS, HRMS of CP1 and Gad-AIE; methods and materials for enzyme assays, cell experiments, NMRD experiment and NMRD fitting.
The authors declare no competing financial interest.
REFERENCES
- 1.(a) Kerr JF; Wyllie AH; Currie AR Apoptosis: A Basic Biological Phenomenon with Wide-Ranging Implications in Tissue Kinetics. Br. J. Cancer 1972, 26, 239–57; [DOI] [PMC free article] [PubMed] [Google Scholar]; (b) Elmore S Apoptosis: A Review of Programmed Cell Death. Toxicol. Pathol 2007, 35, 495–516; [DOI] [PMC free article] [PubMed] [Google Scholar]; (c) Taylor RC; Cullen SP; Martin SJ Apoptosis: Controlled Demolition at the Cellular Level. Nat. Rev. Mol. Cell Biol 2008, 9, 231–41. [DOI] [PubMed] [Google Scholar]
- 2.(a) Lowe SW; Lin AW Apoptosis in Cancer. Carcinogenesis 2000, 21, 485–95; [DOI] [PubMed] [Google Scholar]; (b) Johnstone RW; Ruefli AA; Lowe SW Apoptosis: A Link between Cancer Genetics and Chemotherapy. Cell 2002, 108, 153–64; [DOI] [PubMed] [Google Scholar]; (c) Gerl R; Vaux DL Apoptosis in the Development and Treatment of Cancer. Carcinogenesis 2005, 26, 263–70; [DOI] [PubMed] [Google Scholar]; (d) Wong RS Apoptosis in Cancer: From Pathogenesis to Treatment. J. Exp. Clin. Cancer Res 2011, 30, 87. [DOI] [PMC free article] [PubMed] [Google Scholar]
- 3.(a) Hickman JA Apoptosis Induced by Anticancer Drugs. Cancer Metastasis Rev. 1992, 11, 121–39; [DOI] [PubMed] [Google Scholar]; (b) Fulda S; Debatin KM Targeting Apoptosis Pathways in Cancer Therapy. Curr. Cancer Drug Targets 2004, 4, 569–76; [DOI] [PubMed] [Google Scholar]; (c) Ghobrial IM; Witzig TE; Adjei AA Targeting Apoptosis Pathways in Cancer Therapy. CA Cancer J. Clin 2005, 55, 178–94; [DOI] [PubMed] [Google Scholar]; (d) Cheng L; Wang X; Zhang J; Zhang SB; Zheng SQ; Zheng J Targeting Apoptosis Signaling Pathways in Cancer Therapy. Zhonghua Bing Li Xue Za Zhi 2009, 38, 639–42. [PubMed] [Google Scholar]
- 4.(a) Blankenberg FG In Vivo Detection of Apoptosis. J. Nucl. Med 2008, 49 Suppl 2, 81S–95S; [DOI] [PubMed] [Google Scholar]; (b) Haberkorn U; Markert A; Mier W; Askoxylakis V; Altmann A Molecular Imaging of Tumor Metabolism and Apoptosis. Oncogene 2011, 30, 4141–51; [DOI] [PubMed] [Google Scholar]; (c) Vangestel C; Peeters M; Mees G; Oltenfreiter R; Boersma HH; Elsinga PH; Reutelingsperger C; Van Damme N; De Spiegeleer B; Van de Wiele C In Vivo Imaging of Apoptosis in Oncology: An Update. Mol. Imaging 2011, 10, 340–58; [DOI] [PubMed] [Google Scholar]; (d) Zeng W; Wang X; Xu P; Liu G; Eden HS; Chen X Molecular Imaging of Apoptosis: From Micro to Macro. Theranostics 2015, 5, 559–82. [DOI] [PMC free article] [PubMed] [Google Scholar]
- 5.(a) Earnshaw WC; Martins LM; Kaufmann SH Mammalian Caspases: Structure, Activation, Substrates, and Functions During Apoptosis. Annu. Rev. Biochem 1999, 68, 383–424; [DOI] [PubMed] [Google Scholar]; (b) Li J; Yuan J Caspases in Apoptosis and Beyond. Oncogene 2008, 27, 6194–6206; [DOI] [PubMed] [Google Scholar]; (c) McIlwain DR; Berger T; Mak TW Caspase Functions in Cell Death and Disease. Cold Spring Harb. Perspect. Biol 2013, 5; [DOI] [PMC free article] [PubMed] [Google Scholar]; (d) Thornberry NA; Lazebnik Y Caspases: Enemies Within. Science 1998, 281, 1312–1316. [DOI] [PubMed] [Google Scholar]
- 6.(a) Moats RA; Fraser SE; Meade TJA “Smart” Magnetic Resonance Imaging Agent That Reports on Specific Enzymatic Activity. Angew. Chem., Int. Ed 1997, 36, 726–728; [Google Scholar]; (b) Louie AY; Huber MM; Ahrens ET; Rothbacher U; Moats R; Jacobs RE; Fraser SE; Meade TJ In Vivo Visualization of Gene Expression Using Magnetic Resonance Imaging. Nat. Biotechnol 2000, 18, 321–325. [DOI] [PubMed] [Google Scholar]
- 7.(a) Woods M; Zhang SR; Ebron V; Sherry AD Ph-Sensitive Modulation of the Second Hydration Sphere in Lanthanide(Iii) Tetraamide-DOTA Complexes: A Novel Approach to Smart Mr Contrast Media. Chem. Eur. J 2003, 9, 4634–4640; [DOI] [PubMed] [Google Scholar]; (b) Woods M; Kiefer GE; Bott S; Castillo-Muzquiz A; Eshelbrenner C; Michaudet L; McMillan K; Mudigunda SDK; Grin D; Tircso G; Zhang SR; Zhao P; Sherry AD Synthesis, Relaxometric and Photophysical Properties of a New pH-Responsive MRI Contrast Agent: The Effect of Other Ligating Groups on Dissociation of a p-Nitrophenolic Pendant Arm. J. Am. Chem. Soc 2004, 126, 9248–9256; [DOI] [PMC free article] [PubMed] [Google Scholar]; (c) Toth E; Bolskar RD; Borel A; Gonzalez G; Helm L; Merbach AE; Sitharaman B; Wilson LJ Water-Soluble Gadofullerenes: Toward High-Relaxivity, pH-Responsive MRI Contrast Agents. J. Am. Chem. Soc 2005, 127, 799–805; [DOI] [PubMed] [Google Scholar]; (d) Kalman FK; Woods M; Caravan P; Jurek P; Spiller M; Tircso G; Kiraly R; Brucher E; Sherry AD Potentiometric and Relaxometric Properties of a Gadolinium-Based MRI Contrast Agent for Sensing Tissue pH. Inorg. Chem 2007, 46, 5260–5270; [DOI] [PMC free article] [PubMed] [Google Scholar]; (e) Longo DL; Busato A; Lanzardo S; Antico F; Aime S Imaging the pH Evolution of an Acute Kidney Injury Model by Means of Iopamidol, a MRI-CEST pH-Responsive Contrast Agent. Magn. Reson. Med 2013, 70, 859–864. [DOI] [PubMed] [Google Scholar]
- 8.(a) Li WH; Parigi G; Fragai M; Luchinat C; Meade TJ Mechanistic Studies of a Calcium-Dependent MRI Contrast Agent. Inorg. Chem 2002, 41, 4018–4024; [DOI] [PubMed] [Google Scholar]; (b) Que EL; Chang CJ A Smart Magnetic Resonance Contrast Agent for Selective Copper Sensing. J. Am. Chem. Soc 2006, 128, 15942–15943; [DOI] [PubMed] [Google Scholar]; (c) Major JL; Parigi G; Luchinat C; Meade TJ The Synthesis and in Vitro Testing of a Zinc-Activated MRI Contrast Agent. Proc. Natl. Acad. Sci. U. S. A 2007, 104, 13881–13886; [DOI] [PMC free article] [PubMed] [Google Scholar]; (d) Esqueda AC; Lopez JA; Andreu-De-Riquer G; Alvarado-Monzon JC; Ratnakar J; Lubag AJM; Sherry AD; De Leon-Rodriguez LM A New Gadolinium-Based MRI Zinc Sensor. J. Am. Chem. Soc 2009, 131, 11387–11391; [DOI] [PMC free article] [PubMed] [Google Scholar]; (e) Matosziuk LM; Leibowitz JH; Heffern MC; MacRenaris KW; Ratner MA; Meade TJ Structural Optimization of Zn(II)-Activated Magnetic Resonance Imaging Probes. Inorg. Chem 2013, 52, 12250–12261; [DOI] [PMC free article] [PubMed] [Google Scholar]; (f) Jordan MVC; Lo ST; Chen SW; Preihs C; Chirayil S; Zhang SR; Kapur P; Li WH; De Leon-Rodriguez LM; Lubag AJM; Rofsky NM; Sherry AD Zinc-Sensitive MRI Contrast Agent Detects Differential Release of Zn(II) Ions from the Healthy Vs. Malignant Mouse Prostate. Proc. Natl. Acad. Sci. U. S. A 2016, 113, E5464–E5471; [DOI] [PMC free article] [PubMed] [Google Scholar]; (g) MacRenaris KW; Ma ZD; Krueger RL; Carney CE; Meade TJ Cell-Permeable Esterase-Activated Ca(II)-Sensitive MRI Contrast Agent. Bioconjugate Chem. 2016, 27, 465–473. [DOI] [PMC free article] [PubMed] [Google Scholar]
- 9.Angelovski G; Toth E Strategies for Sensing Neurotransmitters with Responsive MRI Contrast Agents. Chem. Soc. Rev 2017, 46, 324–336. [DOI] [PubMed] [Google Scholar]
- 10.(a) Moats RA; Fraser SE; Meade TJA “Smart” Magnetic Resonance Imaging Agent That Reports on Specific Enzymatic Activity. Angew. Chem., Int. Ed 1997, 36, 726–728; [Google Scholar]; (b) Giardiello M; Lowe MP; Botta M An Esterase-Activated Magnetic Resonance Contrast Agent. Chem. Commun 2007, 4044–4046; [DOI] [PubMed] [Google Scholar]; (c) Urbanczyk-Pearson LM; Femia FJ; Smith J; Parigi G; Duimstra JA; Eckermann AL; Luchinat C; Meade TJ Mechanistic Investigation of Beta-Galactosidase-Activated MR Contrast Agents. Inorg. Chem 2008, 47, 56–68; [DOI] [PubMed] [Google Scholar]; (d) Ye DJ; Shuhendler AJ; Pandit P; Brewer KD; Tee SS; Cui LN; Tikhomirov G; Rutt B; Rao JH Caspase-Responsive Smart Gadolinium-Based Contrast Agent for Magnetic Resonance Imaging of Drug-Induced Apoptosis. Chem. Sci 2014, 5, 3845–3852; [DOI] [PMC free article] [PubMed] [Google Scholar]; (e) Qiao SL; Ma Y; Wang Y; Lin YX; An HW; Li LL; Wang H General Approach of Stimuli-Induced Aggregation for Monitoring Tumor Therapy. Acs Nano 2017, 11, 7301–7311. [DOI] [PubMed] [Google Scholar]
- 11.(a) Major JL; Meade TJ Bioresponsive, Cell-Penetrating, and Multimeric Mr Contrast Agents. Acc. Chem. Res 2009, 42, 893–903; [DOI] [PMC free article] [PubMed] [Google Scholar]; (b) Heffern MC; Matosziuk LM; Meade TJ Lanthanide Probes for Bioresponsive Imaging. Chem. Rev 2014, 114, 4496–4539; [DOI] [PMC free article] [PubMed] [Google Scholar]; (c) Faulkner S; Blackburn OA The Chemistry of Lanthanide MRI Contrast Agents. Chemistry of Molecular Imaging 2015, 179–197; [Google Scholar]; (d) Hingorani DV; Bernstein AS; Pagel MD A Review of Responsive MRI Contrast Agents: 2005–2014. Contrast Media Mol. Imaging 2015, 10, 245–265; [DOI] [PMC free article] [PubMed] [Google Scholar]; (e) Carril M Activatable Probes for Diagnosis and Biomarker Detection by MRI. J. Mater. Chem. B 2017, 5, 4332–4347. [DOI] [PubMed] [Google Scholar]
- 12.Angelovski G What We Can Really Do with Bioresponsive MRI Contrast Agents. Angew. Chem., Int. Ed 2016, 55, 7038–7046. [DOI] [PubMed] [Google Scholar]
- 13.(a) Zhang XA; Lovejoy KS; Jasanoff A; Lippard SJ Water-Soluble Porphyrins as a Dual-Function Molecular Imaging Platform for MRI and Fluorescence Zinc Sensing. Proc. Natl. Acad. Sci. U. S. A 2007, 104, 10780–5; [DOI] [PMC free article] [PubMed] [Google Scholar]; (b) Tu C; Nagao R; Louie AY Multimodal Magnetic-Resonance/Optical-Imaging Contrast Agent Sensitive to NADH. Angew. Chem., Int. Ed 2009, 48, 6547–51; [DOI] [PMC free article] [PubMed] [Google Scholar]; (c) You Y; Tomat E; Hwang K; Atanasijevic T; Nam W; Jasanoff AP; Lippard SJ Manganese Displacement from Zinpyr-1 Allows Zinc Detection by Fluorescence Microscopy and Magnetic Resonance Imaging. Chem. Commun. (Camb.) 2010, 46, 4139–41; [DOI] [PMC free article] [PubMed] [Google Scholar]; (d) Luo J; Li WS; Xu P; Zhang LY; Chen ZN Zn2+ Responsive Bimodal Magnetic Resonance Imaging and Fluorescent Imaging Probe Based on a Gadolinium(III) Complex. Inorg. Chem 2012, 51, 9508–16; [DOI] [PubMed] [Google Scholar]; (e) Sowers MA; McCombs JR; Wang Y; Paletta JT; Morton SW; Dreaden EC; Boska MD; Ottaviani MF; Hammond PT; Rajca A; Johnson JA Redox-Responsive Branched-Bottlebrush Polymers for in Vivo MRI and Fluorescence Imaging. Nat Commun 2014, 5, 5460; [DOI] [PMC free article] [PubMed] [Google Scholar]; (f) Zheng M; Wang Y; Shi H; Hu Y; Feng L; Luo Z; Zhou M; He J; Zhou Z; Zhang Y; Ye D Redox-Mediated Disassembly to Build Activatable Trimodal Probe for Molecular Imaging of Biothiols. ACS Nano 2016, 10, 10075–10085. [DOI] [PubMed] [Google Scholar]
- 14.(a) Hong YN; Lam JWY; Tang BZ Aggregation-Induced Emission. Chem. Soc. Rev 2011, 40, 5361–5388; [DOI] [PubMed] [Google Scholar]; (b) Mei J; Leung NLC; Kwok RTK; Lam JWY; Tang BZ Aggregation-Induced Emission: Together We Shine, United We Soar! Chem. Rev 2015, 115, 11718–11940. [DOI] [PubMed] [Google Scholar]
- 15.(a) Ding D; Li K; Liu B; Tang BZ Bioprobes Based on AIE Fluorogens. Acc. Chem. Res 2013, 46, 2441–2453; [DOI] [PubMed] [Google Scholar]; (b) Liang J; Tang B; Liu B Specific Light-up Bioprobes Based on AIEgen Conjugates. Chem. Soc. Rev 2015, 44, 2798–2811; [DOI] [PubMed] [Google Scholar]; (c) Mei J; Huang YH; Tian H Progress and Trends in AIE-Based Bioprobes: A Brief Overview. ACS Appl. Mater. Interfaces 2018, 10, 12217–12261. [DOI] [PubMed] [Google Scholar]
- 16.(a) Bogdanov A; Matuszewski L; Bremer C; Petrovsky A; Weissleder R Oligomerization of Paramagnetic Substrates Result in Signal Amplification and Can Be Used for Mr Imaging of Molecular Targets. Mol. Imaging 2002, 1, 16–23; [DOI] [PubMed] [Google Scholar]; (b) Cao CY; Shen YY; Wang JD; Li L; Liang GL Controlled Intracellular Self-Assembly of Gadolinium Nanoparticles as Smart Molecular Mr Contrast Agents. Sci. Rep 2013, 3; [DOI] [PMC free article] [PubMed] [Google Scholar]; (c) Ye DJ; Pandit P; Kempen P; Lin JG; Xiong LQ; Sinclair R; Rutt B; Rao JH Redox-Triggered Self-Assembly of Gadolinium-Based MRI Probes for Sensing Reducing Environment. Bioconjugate Chem. 2014, 25, 1526–1536. [DOI] [PMC free article] [PubMed] [Google Scholar]
- 17.Wahsner J; Gale EM; Rodriguez-Rodriguez A; Caravan P Chemistry of MRI Contrast Agents: Current Challenges and New Frontiers. Chem. Rev 2019, 119, 957–1057. [DOI] [PMC free article] [PubMed] [Google Scholar]
- 18.Henig J; Toth E; Engelmann J; Gottschalk S; Mayer HA Macrocyclic Gd3+ Chelates Attached to a Silsesquioxane Core as Potential Magnetic Resonance Imaging Contrast Agents: Synthesis, Physicochemical Characterization, and Stability Studies. Inorg. Chem 2010, 49, 6124–6138. [DOI] [PubMed] [Google Scholar]
- 19.(a) Mahrus S; Trinidad JC; Barkan DT; Sali A; Burlingame AL; Wells JA Global Sequencing of Proteolytic Cleavage Sites in Apoptosis by Specific Labeling of Protein N Termini. Cell 2008, 134, 866–876; [DOI] [PMC free article] [PubMed] [Google Scholar]; (b) Stennicke HR; Renatus M; Meldal M; Salvesen GS Internally Quenched Fluorescent Peptide Substrates Disclose the Subsite Preferences of Human Caspases 1, 3, 6, 7 and 8. Biochem. J 2000, 350, 563–568; [PMC free article] [PubMed] [Google Scholar]; (c) Poreba M; Szalek A; Kasperkiewicz P; Rut W; Salvesen GS; Drag M Small Molecule Active Site Directed Tools for Studying Human Caspases. Chem. Rev 2015, 115, 12546–12629. [DOI] [PMC free article] [PubMed] [Google Scholar]
- 20.Chen YL; Li M; Hong YN; Lam JWY; Zheng QC; Tang BZ Dual-Modal MRI Contrast Agent with Aggregation-Induced Emission Characteristic for Liver Specific Imaging with Long Circulation Lifetime. ACS Appl. Mater. Interfaces 2014, 6, 10783–10791. [DOI] [PubMed] [Google Scholar]
- 21.(a) Shi HB; Kwok RTK; Liu JZ; Xing BG; Tang BZ; Liu B Real-Time Monitoring of Cell Apoptosis and Drug Screening Using Fluorescent Light-up Probe with Aggregation-Induced Emission Characteristics. J. Am. Chem. Soc 2012, 134, 17972–17981; [DOI] [PubMed] [Google Scholar]; (b) Shi HB; Zhao N; Ding D; Liang J; Tang BZ; Liu B Fluorescent Light-up Probe with Aggregation-Induced Emission Characteristics for in Vivo Imaging of Cell Apoptosis. Org. Biomol. Chem 2013, 11, 7289–7296. [DOI] [PubMed] [Google Scholar]
- 22.(a) Rutt BK; Lee DH The Impact of Field Strength on Image Quality in MRI. JMRI-Journal of Magnetic Resonance Imaging 1996, 6, 57–62; [DOI] [PubMed] [Google Scholar]; (b) Moser E; Laistler E; Schmitt F; Kontaxis G Ultra-High Field NMR and MRI - the Role of Magnet Technology to Increase Sensitivity and Specificity. Frontiers in Physics 2017, 5. [Google Scholar]
- 23.(a) Caravan P; Farrar CT; Frullano L; Uppal R Influence of Molecular Parameters and Increasing Magnetic Field Strength on Relaxivity of Gadolinium- and Manganese-Based T(1) Contrast Agents. Contrast Media Mol. Imaging 2009, 4, 89–100; [DOI] [PMC free article] [PubMed] [Google Scholar]; (b) Mastarone DJ; Harrison VSR; Eckermann AL; Parigi G; Luchinat C; Meade TJ A Modular System for the Synthesis of Multiplexed Magnetic Resonance Probes. J. Am. Chem. Soc 2011, 133, 5329–5337; [DOI] [PMC free article] [PubMed] [Google Scholar]; (c) Bertini I; Luchinat C; Parigi G; Ravera E NMR of Paramagnetic Molecules Applications to Metallobiomolecules and Models Second Edition Introduction. NMR of Paramagnetic Molecules: Applications to Metallobiomolecules and Models, 2nd Edition 2017, 1–24 [Google Scholar]
- 24.(a) Bertini I; Kowalewski J; Luchinat C; Nilsson T; Parigi G Nuclear Spin Relaxation in Paramagnetic Complexes of S=1: Electron Spin Relaxation Effects. J. Chem. Phys 1999, 111, 5795–5807; [Google Scholar]; (b) Kowalewski J; Kruk D; Parigi G NMR Relaxation in Solution of Paramagnetic Complexes: Recent Theoretical Progress for S >= 1. Advances in Inorganic Chemistry - Including Bioinorganic Studies, Vol 57 2005, 57, 41–104. [Google Scholar]
- 25.(a) Lauffer RB Paramagnetic Metal-Complexes as Water Proton Relaxation Agents for NMR Imaging - Theory and Design. Chem. Rev 1987, 87, 901–927; [Google Scholar]; (b) Caravan P; Ellison JJ; McMurry TJ; Lauffer RB Gadolinium(III) Chelates as MRI Contrast Agents: Structure, Dynamics, and Applications. Chem. Rev 1999, 99, 2293–2352. [DOI] [PubMed] [Google Scholar]
Associated Data
This section collects any data citations, data availability statements, or supplementary materials included in this article.


