

Abstract
The history of insects’ taxonomic diversity is poorly understood. The two most common methods for estimating taxonomic diversity in deep time yield conflicting results: the ‘range through’ method suggests a steady, nearly monotonic increase in family-level diversity, whereas ‘shareholder quorum subsampling’ suggests a highly volatile taxonomic history with family-level mass extinctions occurring repeatedly, even at the midpoints of geological periods. The only feature shared by these two diversity curves is a steep increase in standing diversity during the Early Cretaceous. This apparent diversification event occurs primarily during the Aptian, the pre-Cenozoic interval with the most described insect occurrences, raising the possibility that this feature of the diversity curves reflects preservation and sampling biases rather than insect evolution and extinction. Here, the capture–mark–recapture (CMR) approach is used to estimate insects’ family-level diversity. This method accounts for the incompleteness of the insect fossil record as well as uneven sampling among time intervals. The CMR diversity curve shows extinctions at the Permian/Triassic and Cretaceous/Palaeogene boundaries but does not contain any mass extinctions within geological periods. This curve also includes a steep increase in diversity during the Aptian, which appears not to be an artefact of sampling or preservation bias because this increase still appears when time bins are standardized by the number of occurrences they contain rather than by the amount of time that they span. The Early Cretaceous increase in family-level diversity predates the rise of angiosperms by many millions of years and can be better attributed to the diversification of parasitic and especially parasitoid insect lineages.
Keywords: diversity curve, Mesozoic, Arthropoda, parasitism
1. Introduction
Insects have the highest described species-level diversity of any group of animals [1]. Their tremendous ecological and morphological diversity has been studied intensely in their fossil record, which extends back hundreds of millions of years before the present [2]. Despite the many insights gleaned from the fossil record, one basic aspect of insects’ fossil history remains poorly understood and highly contentious: family-level diversity through time [3]. The history of insect diversity in deep time, which has the potential to demonstrate the impact of mass extinction, has taken on particular urgency in light of the escalating concern over a potential mass extinction of insects during the twenty-first century [4,5].
Taxonomic diversity in deep time can be estimated from time-calibrated phylogenies or directly from fossil occurrence data. Each approach has its drawbacks: time-calibrated phylogenies typically omit extinct taxa—which, in the case of insects, includes various orders that were previously very diverse [6]—whereas fossil occurrence data are known to be incomplete, especially in the case of insects. The two most common methods used to estimate taxonomic diversity in deep time from fossil occurrence data [7–9] yield contradictory results for insects. The first of these methods, the ‘range-through’ (RT) method, is the older of the two methods [10] and has been more commonly applied to the insect fossil record [6,11–13]. With RT, each insect family is assumed to have originated in the time bin in which it is first documented, is assumed to have gone extinct within the time bin in which it is last documented, and is assumed to have existed in all intervening time bins even if not documented. The second method, ‘shareholder quorum subsampling’ (SQS), has become commonly used in recent years [14,15]. With SQS, each taxon is characterized within each time bin according to the ‘share’, or proportion, of occurrences that it composes. Taxa are then subsampled from each time bin until a predetermined threshold of all shares, typically between 0.4 and 0.8, has been reached [14]. SQS is comparable to classical rarefaction in that it is a subsampling method in which a point estimate of diversity is not impacted by occurrences from before or after the interval in question. The difference between SQS and rarefaction is that rarefaction draws a uniform quota of occurrences, whereas SQS draws occurrences to reach a uniform frequency.
These methods, RT and SQS, yield dramatically different estimates of family-level insect diversity. The RT method shows a relatively steady increase in diversity from the Pennsylvanian through to the Palaeogene, followed by a far steeper increase at about 40 Ma (figure 1). The RT curve does not show any large and rapid declines in diversity as would be expected for a mass extinction event [11]. In stark contrast, the SQS curve—quite possibly because of this method’s sensitivity to fluctuations in sampling—shows major fluctuations in diversity (figure 1). Some of the large and rapid declines in diversity estimated by SQS occur at widely noted extinction events, such as at the Permian/Triassic and Cretaceous/Palaeogene boundaries, but some occur during intervals that had not previously been associated with any biotic crisis [16]. For example, during the middle of the Cretaceous and again from the Middle to the Late Palaeogene, the SQS curve shows a decrease in family-level diversity of approximately 50%. These repeated losses of family-level insect diversity that SQS estimates are as drastic as the loss of marine animal families at the Permian/Triassic boundary, the most severe extinction event known from the entire fossil record [17]. When the history of family-level insect diversity is estimated with classical rarefaction, a somewhat less volatile diversity history is estimated but major losses in family-level diversity appear during the same intervals [16].
Figure 1.
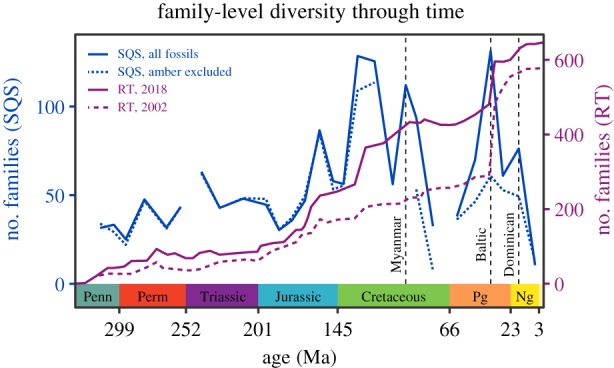
Exemplars of the two established procedures for estimating insect diversity in deep time: shareholder quorum subsampling (SQS) [16] and range-through (RT) [11,12]. The three major amber deposits—from Myanmar, the Baltic and the Dominican Republic—are marked with dotted grey lines.
One major advantage of RT is that this method accounts for the fact that many lineages have long absences from the fossil record between their first and last occurrences, even though they must have existed, attributable to the incomplete nature of the fossil record. This aspect of RT is particularly helpful for the insect fossil record because published occurrences of fossil insects are strongly biased towards first and last appearances (electronic supplementary material). One major advantage of SQS is that this method attempts to control for uneven sampling between time bins. This aspect of SQS is particularly helpful for the insect fossil record because fossil insects are known primarily from ‘konzentrat Lagerstätten’—localities where the depositional conditions permitted preservation of a vast number of insects—and these konzentrat Lagerstätten are few and far between.
‘Capture–mark–recapture’ modelling [18,19], also called ‘mark–recapture’ or ‘capture–recapture’, or abbreviated as CMR, has the advantages of both RT and SQS. Like RT, CMR accounts for the fact that taxa must have existed between their first and last occurrences even when they are not seen in the fossil record, and like SQS, CMR accounts for uneven sampling among time bins. CMR has an additional advantage that neither RT nor SQS has: it incorporates uncertainty associated with the fact that taxa might not have gone extinct immediately after their last appearance in the fossil record.
CMR was originally developed for demographic studies of extant animal populations [20] but subsequently adapted for palaeontological studies [21–24]. A few methods have increasingly been used to generate origination and extinction rates for fossil taxa [25], with CMR being one of these [26–34]. Somewhat less frequently, CMR is also used to generate diversity curves [9,30]. In the original implementation of CMR, wild animals were captured, with traps or other methods, at discrete time intervals. Three principal metrics were tallied for each interval: the number of animals captured for the first time, the number of recaptured animals that had been captured during a previous sampling interval and the number of animals captured in previous and future intervals that were missed during the interval in question. This last metric allows the incompleteness of the sample to be taken into account while computing estimates of the total population size. The aim of this contribution is to use CMR to estimate the taxonomic diversity of insects in deep time and to evaluate the robustness of this estimation.
2. Methods
Details about our dataset and data-cleaning procedure are provided in the electronic supplementary material. All diversity estimates were generated from family-level data, as was done in previous studies [6,11,16], because so few fossil insect genera occur in multiple time bins. Diversity estimates were generated with two datasets. The first dataset includes all 43 156 fossil insect occurrences in the cleaned dataset. The second excludes the 10 867 fossil insects preserved in amber, and therefore consists of the 32 289 fossil insects preserved in rocks as compression–impression, or ‘adpression’, fossils [35].
The Cormack–Jolly–Seber implementation of CMR [36] was used here because it generates a separate diversity estimate for each time bin, Nt in Krebs’ notation. Mean diversity estimates and the bounds of a 95% confidence interval were calculated with the equations published by Krebs [37]. This implementation of CMR only produces diversity estimates for the second through to the penultimate sampling interval. The youngest 10 Myr bin spans the base of the Tortonian (11.6 Ma) to the Recent; diversity estimates computed without simulated data end at the previous 10 Myr bin, which spans the first four ages of the Miocene (Aquitanian–Serravallian) and lasted from 23 to 11.6 Ma. Our use of the terminology ‘Cormack–Jolly–Seber’ is explained in the electronic supplementary material.
Origination and extinction rates were calculated from the CMR output. Krebs’ equations generate a probability of survival for each time bin: ϕt. The extinction rate for each time bin was calculated as 1 − ϕt. The origination rate for each time bin was calculated as the number of new families originating in that bin, Bt in Krebs’ notation, divided by the number of families present in the previous bin, Nt−1 in Krebs’ notation: Bt/Nt−1.
When point estimates of diversity rely partially on information from younger time bins, as is the case for RT and CMR, an artefact called the ‘pull of the Recent’ can occur if the ranges of extant taxa are pulled through to the Recent regardless of whether or not they have younger fossil occurrences [14,38,39]. Pulling the fossil ranges of all extant taxa to the Recent will artificially inflate diversity estimates for the youngest intervals relative to older intervals that do not benefit from this type of taxonomic range information. However, it would be an overcorrection not to pull the ranges of any extant taxa to the Recent, because a fraction of these taxa will be preserved as fossils. The treatment of extant taxa is of particular importance for CMR in the context of comparing past to present diversity because this method does not yield diversity estimates for the two youngest time bins.
To address biases related to the ‘pull of the Recent’, two additional time bins were simulated to estimate insect diversity in the most recent 10 Myr bin and to estimate how modern insect diversity will appear in the fossil record, i.e. to extend the range of the CMR diversity curve to the present day. These simulations address the potential impact of the future fossil record on estimates of Neogene insect diversity. The first simulated time bin was assigned a modern age and the second was assigned an age of 5 Myr in the future. The Cormack–Jolly–Seber method uses the order in which time bins occur—not their actual ages, or the amount of time between adjacent bins. The exact ages chosen for the two simulated bins therefore had no impact on any of the results. Three simulations were conducted with these two additional time bins. In the first simulation, 200 extant families that appear in the fossil record from the Late Cretaceous onwards were randomly simulated to occur in each of the two simulated time bins. A threshold of 200 was chosen because all five of the 10 Myr bins from the Cenozoic contain at least 200 specimens. Families were chosen using an independent sampling regime for each of the two simulated time bins. In the second simulation, 100 extant families that appear in the Cenozoic fossil record were randomly simulated to occur in each of the two simulated time bins. A threshold of 100 was chosen because all five of the 10 Myr bins from the Cenozoic contain at least 100 specimens preserved as adpressions. As above, families were chosen using an independent sampling regime for each of the two simulated time bins. In the third simulation, all extant families that appear in the fossil record from the Late Cretaceous onwards were simulated to occur in both of the simulated time bins.
CMR curves were generated with various other simulated datasets and with subsets of the real dataset—without the Crato Formation, by hemisphere according to palaeogeographical and modern locations—to evaluate the potential impacts of sampling artefacts on the diversity curve. These evaluations of robustness are explained in the electronic supplementary material.
All diversity curves were calculated with 10 Myr bins; the durations of time bins are roughly constant, but within-bin sampling varies greatly. To control for the possible impact of uneven sampling on the results presented here, the occurrence data were divided into time bins of varying durations that all contain the same number of occurrences. (The age and duration of each bin is not incorporated into CMR calculations.) This procedure was carried out with bins that contain 500 occurrences and with bins that contain 1000 occurrences, on the complete dataset and on the dataset without amber. Because many deposits span multiple bins—for example, the 1000th- and 1001st-oldest fossils can belong to the same deposit—this procedure was repeated 1000 times for each bin length and each dataset, randomizing the order of fossils that share the same age. The age of each bin was calculated as the mean age of all fossils it contains. Some deposits contain too many described fossils to fit into a single bin—such as Baltic amber and other amber deposits of a similar age, from which 6284 insect fossils have already been described—resulting in multiple bins with the same age. When multiple bins have the same age, they were separated by 1000 years. A mean estimate and a 95% confidence interval were calculated from the results of the 1000 iterations of each procedure.
All analyses were performed in R, version 3.4.2 [40]. Graphs were produced with the R package ggplot2, version 2.2.1 [41]. Colourblind-friendly colour schemes for the electronic supplementary material, figure S3 and figure 4 are based on Wong [42]. The age of the Yanliao Biota from the Daohugou deposits of the Jiulongshan Formation is discussed in the electronic supplementary material.
Figure 4.
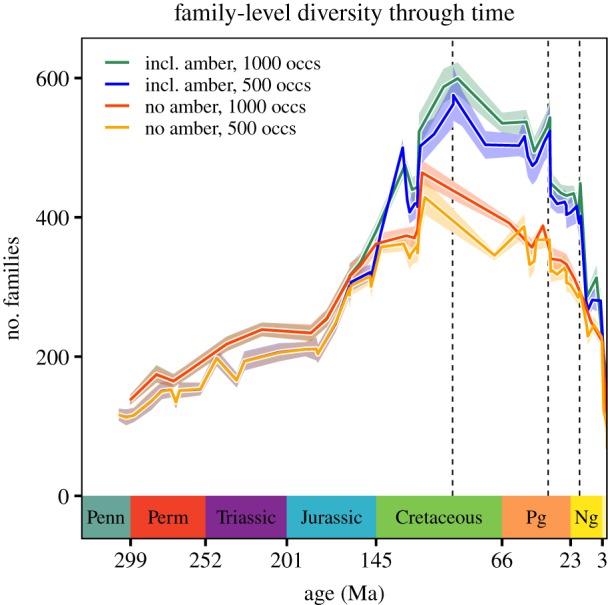
Family-level insect diversity estimated with CMR, with time bins standardized to contain the same number of occurrences rather than lasting approximately the same amount of time.
3. Results
The insect diversity curves generated with CMR (figure 2) show an increase in diversity during the Early Permian followed by a plateau and then a steep decline at the Permian–Triassic boundary. Family-level diversity recovers quickly at the beginning of the Triassic and then increases somewhat steadily until the Aptian Age of the Early Cretaceous (approx. 125–113 Ma). Both origination and extinction rates reach local peaks during the Aptian, suggesting that the estimated peak in diversity during this interval represents a true burst of origination rather than a relative drop in extinction. All of the curves, generated with and without amber fossils, then show a precipitous drop in diversity during the Albian Age of the Early Cretaceous (approx. 113–100 Ma).
Figure 2.
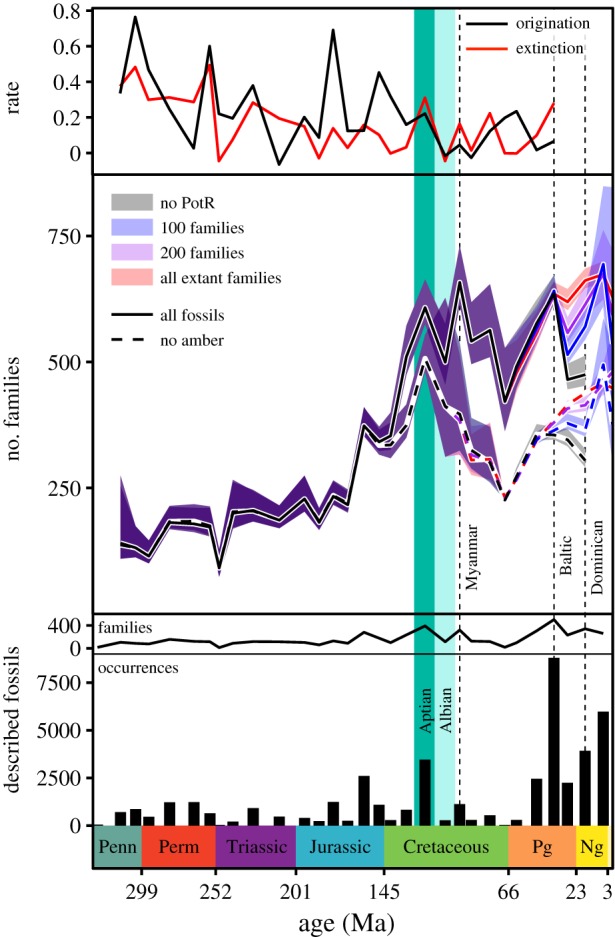
Origination and extinction rates, family-level insect diversity estimated with CMR, and the number of described fossils from each 10 Myr bin. The colour coding in the central panel shows the number of extant families pulled through to the Recent. The three main amber deposits—from Myanmar, the Baltic and the Dominican Republic—are marked with dotted grey lines. The Aptian and Albian Ages are shaded in dark and light turquoise, respectively. PotR, pull of the Recent.
The diversity curves generated without amber show an Early Cretaceous decline in diversity continuing throughout the Late Cretaceous until the Cretaceous/Palaeogene boundary. This decline is followed by a Cenozoic recovery that occurs at a rate approximately equal to that of the Cretaceous decline. All three of the curves generated without amber and with simulated time bins show that modern diversity approaches, but does not reach, the Early Cretaceous peak.
The curves generated with all insect fossils, including amber, show an immediate recovery from the Early Cretaceous decline in diversity, corresponding to the deposition of Myanmar amber near the Early Cretaceous/Late Cretaceous boundary. After this increase, diversity declines rather steadily and quite precipitously towards the Cretaceous/Palaeogene boundary. Diversity then increases steadily and reaches another peak late in the Palaeogene, corresponding to the deposition of Baltic amber and the Florissant fossil beds [43]. All three of the curves generated with all insect fossils and with simulated time bins show a Neogene peak in insect diversity roughly equal to the Late Cretaceous peak associated with the deposition of Myanmar amber.
The Early Cretaceous interval that contains the peak in insect diversity, the Aptian, includes fossils from the Crato Formation of Brazil, one of only nine konzentrat Lagerstätten from the entire insect fossil record that was deposited less than 20° from the palaeoequator—the region where modern insect diversity is highest [44]. When CMR is run without the data from Crato, the Early Cretaceous peak in diversity is less pronounced but is still noticeably higher than the estimated diversity for any previous interval (electronic supplementary material, figure S1).
The Aptian has the highest number of described fossil insects of any 10 Myr bin before the Cenozoic. However, the number of families that occur only during the Aptian (62) is not much higher than the number of families that occur only during the mid-Bashkirian–Moscovian (Pennsylvanian; 49), Artinskian–Kungurian (Early Permian; 48), Oxfordian–Kimmeridgian (Late Jurassic; 47), or Cenomanian (Late Cretaceous; 57). The Aptian has the highest number of last occurrences (83) of any 10 Myr bin before the Cenozoic (figure 3). The three 10 Myr bins with the highest numbers of first occurrences (figure 3) are the Oxfordian–Kimmeridgian (Late Jurassic; 93), the mid-Valanginian–Barremian (Early Cretaceous; 72) and the Aptian (81).
Figure 3.
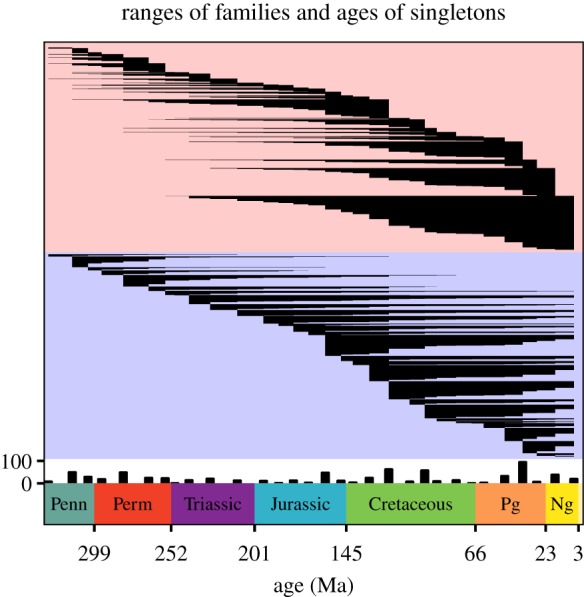
Cohorts and singleton families. Each line represents one family and ranges from its first to its last occurrence. The areas shaded in red and blue contain the same information; cohorts are arranged by their last appearance in the area shaded in red, and cohorts are arranged by their first appearance in the area shaded in blue. Extant families are not ranged through to the present. Singleton families are counted in the bar chart at the bottom with the white background.
When time bins are standardized by the number of fossil occurrences instead of by temporal duration, CMR still estimates a steep Early Cretaceous peak in diversity (figure 4). When amber fossils are excluded, the increase in diversity is by far steepest within the Albian. When amber fossils are included, diversity increases most sharply from the Tithonian (152–145 Ma) to the Hauterivian–Barremian (134–126 Ma), the interval that includes Lebanese amber. Diversity then declines sharply going into the early Aptian (124 Ma), rises sharply within the Aptian (119 Ma) and throughout the Albian (113–100.5 Ma), and continues to rise going into the Cenomanian (100–93.9 Ma), the age that includes Myanmar amber. With the most notable exception of the Priabonian (37.8–33.9 Ma)—the age that includes Baltic amber and the Florissant fossil beds (electronic supplementary material, figure S2)—diversity then declines towards the Recent. Sensitivity analyses conducted by hemisphere are discussed in the electronic supplementary material.
4. Discussion
The most prominent feature of the insect diversity curve generated with CMR is the Aptian peak. A sharp Early Cretaceous increase in diversity is also the only feature shared by the recent diversity curves generated with the RT and SQS methods [11,16]. There is reason to suspect that the Aptian peak is an artefact of the preservation and sampling of fossil insects. Insect diversity estimated by CMR generally follows the peaks and troughs in the number of described insect occurrences per time bin, and the Aptian is the pre-Cenozoic time bin with by far the highest number of described insect occurrences (figure 2). The Aptian peak follows one of the two best-described konzentrat Lagerstätten from China [45] and coincides with the other [46], it immediately follows the oldest major amber deposit [47], and it coincides with one of only nine insect konzentrat Lagerstätten from the entire Phanerozoic that was deposited at a tropical latitude [48].
(a). An Aptian peak in diversity
With the dataset currently available, it is not possible to determine whether the Aptian peak in diversity would be reconstructed as having occurred earlier in the Cretaceous if an earlier time bin contained a higher number of, or a more geographically diverse suite of, described occurrences. However, because this peak is reconstructed from all seven of the eight hemispheric datasets that contain more than 14 fossil insect occurrences from the Jurassic and Early Cretaceous (201–100 Ma; electronic supplementary material, figure S3), and because this peak is robust to standardization of time bins by the number of occurrences they contain (figure 4), it appears that family-level insect diversity really did reach a peak at some point during the Early Cretaceous.
The most obvious way in which published fossil insect occurrence data violate the assumptions of CMR is that all taxa that occur within a bin do not have an equal chance of being sampled: occurrences are preferentially published when they represent the first or last occurrence of a higher-level taxon, such as a family. However, when the gaps between a family’s first and last occurrences are filled into the occurrence matrix before running CMR, total diversity estimates are slightly lower but all general features of the diversity curve remain (electronic supplementary material, figure S4). This finding suggests that the primary features of the diversity curve generated with CMR, such as the increase in insect diversity leading up to the Aptian, are not artefacts of the dataset’s violations of CMR’s assumptions.
Family-level diversity within major amber deposits, and the prevalence of first occurrences, are also consistent with an Early Cretaceous peak in insect diversity. Lebanese amber, which dates to the Barremian (131–126 Ma) has only one-fourth as many described insect occurrences as Myanmar amber and only 5% as many described insect occurrences as Baltic amber and other contemporaneous European amber deposits. However, Lebanese amber contains 61 family-level first occurrences: approximately half as many as those described from Myanmar amber (105) and as described from Baltic amber and other contemporaneous European amber deposits (121).
(b). Ecological causes and implications
While it is difficult to directly interrogate the fossil record on this matter [16], genus- and species-level phylogenies of insects suggest ongoing net diversification throughout the Cenozoic, often attributed to the codiversification of angiosperms with their insect herbivores and pollinators [49–54]. However, the putative relationship between angiosperm and insect diversification is less apparent at the levels of subfamily, family and order [6,55,56]. The results presented here suggest that, at the family level, diversity increased most sharply—and reached levels similar to the modern—during the Early Cretaceous, when angiosperms were still exceedingly rare [57,58]. This finding corroborates previous studies which found that the initial diversification of angiosperms did not cause an increase in the taxonomic diversity of herbivorous insects [55,59]. Although specialized interactions between angiosperms and their insect pollinators are widely accepted to have driven the diversification of various insect lineages at lower taxonomic levels [49,53], such specialized interactions have also been documented from the Early Cretaceous, before the radiation of angiosperms [60]. Some insects that pollinated Early Cretaceous gymnosperms persisted for tens of millions of years into the Late Cretaceous, coexisting with insect lineages that pollinated early angiosperms [60]. This overlap, between insects that had specialized relationships with gymnosperms and insects that had specialized relationships with angiosperms, may have also contributed to the Early Cretaceous peak in insect diversity.
Regardless of the drivers of this apparent discrepancy between patterns of insect diversity at the level of family versus the levels of genus and species, this discrepancy is not necessarily unexpected. Genus- and species-level diversity is not evenly distributed among insect families, but is instead disproportionately concentrated in certain younger families such as ants (Hymenoptera: Formicidae), true weevils (Coleoptera: Curculionidae), and erebid moths (Lepidoptera: Erebidae) that diverged relatively late within their respective taxonomic orders [3]. For example, a diverse ant fauna in the extinct subfamily Sphecomyrminae has been described from Myanmar amber [61–67] and from a French amber deposit that is nearly contemporaneous [68,69], but no ants have been described from older deposits [70]. The oldest putative true weevils in the family Curculionidae date to the Aptian [71,72] despite belonging to an order that is widely known from Palaeozoic deposits [3]. More generally, an increase in the ratio of species-to-family diversity through time is a trend observed across many animal lineages [73].
The Early Cretaceous increase in family-level insect diversity can also be attributed, in part, to the rise of parasitic and parasitoid life histories among various insect lineages during the Late Jurassic and Early Cretaceous [2,74]. Of the families that had their first occurrences between the Oxfordian–Kimmeridgian and the Aptian, many have parasitic or parasitoid life histories (figure 5). Hymenoptera, the order that disproportionately contains the most parasitoid taxa [75], had the highest ratio of first occurrences to last occurrences during this interval, and most of these first occurrences are parasitoid families. Parasitoids, which typically target other insects [43], are estimated to represent up to 20% of the total diversity of extant insects [76]. Parasites and parasitoids together are estimated to represent up to 25% of the total diversity of extant insects [77], suggesting that the rapid diversification of parasitic and especially parasitoid families during the Late Jurassic–Early Cretaceous could have been a major driver of the Early Cretaceous peak in family-level insect diversity. Not only would the origination of parasitic and parasitoid families contribute to the total number of insect families, but parasitoids of insects may have increased diversification rates in the lineages that they targeted [75,78–80], contributing to a trophically downstream increase in total insect diversity.
Figure 5.
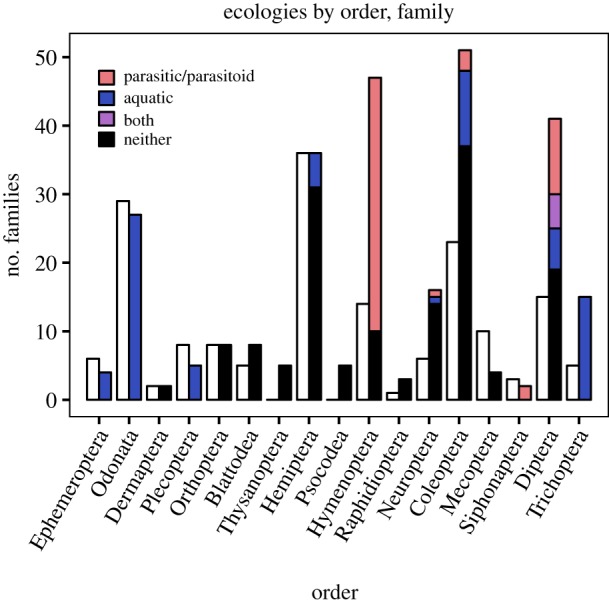
Ecologies. The white bars, on the left, represent the number of families within each order that had their last occurrences during the Aptian. The bars filled in with colour, on the right, represent the number of families that had their first occurrences between the Oxfordian and the Aptian. Black: neither aquatic nor parasitic/parasitoid. Blue: aquatic, not parasitic/parasitoid. Purple: aquatic and parasitic/parasitoid. Red: terrestrial and parasitic/parasitoid.
5. Conclusion
CMR models are increasingly used in palaeontological studies to calculate rates of origination and extinction and to evaluate covariates such as body size and mode of reproduction. Here we use this approach for a related purpose, to estimate a diversity curve. Our results show a peak in family-level insect diversity during the Early Cretaceous—the only feature that is also shared by diversity curves constructed with SQS and RT methods. The exact timing of this peak, in the Aptian, may be an artefact of the preservation and sampling of fossil insects, but the Early Cretaceous peak in insect diversity is robust to all reasonable approaches and appears to be real. This peak predates the diversification and ecological domination of angiosperms; genus- and species-level diversification of many insect groups has been attributed to the coevolution of insects and the plants that they herbivorize and pollinate, but it appears that the family-level diversification of insects is largely decoupled from diversification at the levels of genus and species. The Early Cretaceous peak in diversity is most likely attributable to the origination of parasitic and especially parasitoid insect lineages. Groups that radiated as parasitoids of other insects probably increased total insect diversity in two ways: by occupying new niches, and by initiating an evolutionary arms-race that would have increased the diversification rates of the lineages they targeted.
Supplementary Material
Acknowledgements
Gene Hunt, C. Kevin Boyce, Fabien L. Condamine and one anonymous reviewer provided valuable feedback on this manuscript. This is contribution 386 of the Evolution of Terrestrial Systems consortium at the National Museum of Natural History, in Washington, DC. This is Palaeobiology Database contribution 354.
Data accessibility
Our paper uses data that is not new. Our data and code can be accessed at https://figshare.com/s/6b3b8bab7937a4cc2694.
Authors' contributions
Conceived the study: S.R.S. and J.L.P. Analysed data and drafted the manuscript: S.R.S. Edited the manuscript: S.R.S., C.C.L., M.E.C. and J.L.P.
Competing interests
We declare we have no competing interest.
Funding
S.R.S. is funded by the Coleman F. Fung Interdisciplinary Graduate Fellowship, Vice Provost of Graduate Education, Stanford University.
Reference
- 1.Adler PH, Foottit RG. 2018. Introduction. In Insect biodiversity: science and society (eds RG Foottit, PH Adler), pp. 1–7. New York, NY: John Wiley & Sons, Ltd.
- 2.Labandeira CC. 2018. The fossil history of insect diversity. In Insect biodiversity: science and society (eds RG Foottit, PH Adler), pp. 723–788. New York, NY: John Wiley & Sons, Ltd.
- 3.Grimaldi D, Engel M. 2005. Evolution of the insects. New York, NY: Cambridge University Press. [Google Scholar]
- 4.Hallmann CA. et al 2017. More than 75 percent decline over 27 years in total flying insect biomass in protected areas. PLoS ONE 12, e0185809 ( 10.1371/journal.pone.0185809) [DOI] [PMC free article] [PubMed] [Google Scholar]
- 5.Lister BC, Garcia A. 2018. Climate-driven declines in arthropod abundance restructure a rainforest food web. Proc. Natl Acad. Sci. USA 115, E10397–E10406. ( 10.1073/pnas.1722477115) [DOI] [PMC free article] [PubMed] [Google Scholar]
- 6.Labandeira CC, Sepkoski JJ. 1993. Insect diversity in the fossil record. Science 261, 310–315. ( 10.1126/science.11536548) [DOI] [PubMed] [Google Scholar]
- 7.Dunne EM, Close RA, Button DJ, Brocklehurst N, Cashmore DD, Lloyd GT, Butler RJ. 2018. Diversity change during the rise of tetrapods and the impact of the ‘Carboniferous rainforest collapse’. Proc. R. Soc. B 285, 20172730 ( 10.1098/rspb.2017.2730) [DOI] [PMC free article] [PubMed] [Google Scholar]
- 8.Nowak H, Schneebeli-Hermann E, Kustatscher E. 2019. No mass extinction for land plants at the Permian–Triassic transition. Nat. Commun. 10, 384 ( 10.1038/s41467-018-07945-w) [DOI] [PMC free article] [PubMed] [Google Scholar]
- 9.Rasmussen CMØ, Kröger B, Nielsen ML, Colmenar J. 2019. Cascading trend of Early Paleozoic marine radiations paused by Late Ordovician extinctions. Proc. Natl Acad. Sci. USA 116, 7207–7213. ( 10.1073/pnas.1821123116) [DOI] [PMC free article] [PubMed] [Google Scholar]
- 10.Sepkoski JJ. 1981. A factor analytic description of the Phanerozoic marine fossil record. Paleobiology 7, 36–53. ( 10.1017/S0094837300003778) [DOI] [Google Scholar]
- 11.Dmitriev VY. et al. 2018. Insect diversity from the Carboniferous to Recent. Paleontol. J. 52, 610–619. ( 10.1134/S0031030118060047) [DOI] [Google Scholar]
- 12.Dmitriev VY, Ponomarenko AG, Rasnitsyn AP, Quicke DLJ. 2002. Dynamics of insect taxonomic diversity. In History of the insects (eds Rasnitsyn AP, Quicke DLJ), pp. 325–331. Dordrecht, The Netherlands: Kluwer. [Google Scholar]
- 13.Jarzembowski EA, Ross AJ. 1996. Insect origination and extinction in the Phanerozoic. Geol. Soc. London, Spec. Publ. 102, 65–78. ( 10.1144/GSL.SP.1996.001.01.05) [DOI] [Google Scholar]
- 14.Alroy J. 2010. Fair sampling of taxonomic richness and unbiased estimation of origination and extinction rates. Paleontol. Soc. Pap. 16, 55–80. ( 10.1017/S1089332600001819) [DOI] [Google Scholar]
- 15.Bush AM, Bambach RK. 2015. Sustained Mesozoic–Cenozoic diversification of marine Metazoa: a consistent signal from the fossil record. Geology 43, 979–982. ( 10.1130/G37162.1) [DOI] [Google Scholar]
- 16.Clapham ME, Karr JA, Nicholson DB, Ross AJ, Mayhew PJ. 2016. Ancient origin of high taxonomic richness among insects. Proc. R. Soc. B 283, 20152476 ( 10.1098/rspb.2015.2476) [DOI] [PMC free article] [PubMed] [Google Scholar]
- 17.Raup DM, Sepkoski JJ. 1982. Mass extinctions in the marine fossil record. Science 215, 1501–1503. ( 10.1126/science.215.4539.1501) [DOI] [PubMed] [Google Scholar]
- 18.McCrea RS, Morgan BJ. 2014. Analysis of capture–recapture data. London, UK: Chapman and Hall. [Google Scholar]
- 19.Ricker WE. 1975. Computation and interpretation of biological statistics of fish populations, vol. 191. Department of the Environment, Fisheries and Marine Service, Ottawa.
- 20.Krebs CJ, Boonstra R. 1984. Trappability estimates for mark–recapture data. Can. J. Zool. 62, 2440–2444. ( 10.1139/z84-360) [DOI] [Google Scholar]
- 21.Connolly SR, Miller AI. 2001. Joint estimation of sampling and turnover rates from fossil databases: capture–mark–recapture methods revisited. Paleobiology 27, 751–767. () [DOI] [Google Scholar]
- 22.Conroy MJ, Nichols JD. 1984. Testing for variation in taxonomic extinction probabilities: a suggested methodology and some results. Paleobiology 10, 328–337. ( 10.1017/S0094837300008307) [DOI] [Google Scholar]
- 23.Liow LH, Nichols JD. 2010. Estimating rates and probabilities of origination and extinction using taxonomic occurrence data: capture–mark–recapture (CMR) approaches. Paleontol. Soc. Pap. 16, 81–94. ( 10.1017/S1089332600001820) [DOI] [Google Scholar]
- 24.Nichols JD, Pollock KH. 1983. Estimating taxonomic diversity, extinction rates, and speciation rates from fossil data using capture–recapture models. Paleobiology 9, 150–163. ( 10.1017/S0094837300007533) [DOI] [Google Scholar]
- 25.Silvestro D, Schnitzler J, Liow LH, Antonelli A, Salamin N. 2014. Bayesian estimation of speciation and extinction from incomplete fossil occurrence data. Syst. Biol. 63, 349–367. ( 10.1093/sysbio/syu006) [DOI] [PMC free article] [PubMed] [Google Scholar]
- 26.Chen X, Melchin MJ, Sheets HD, Mitchell CE, Jun-Xuan F. 2005. Patterns and processes of latest Ordovician graptolite extinction and recovery based on data from South China. J. Paleontol. 79, 842–861. ( 10.1666/0022-3360(2005)079[0907:UMBFTB]2.0.CO;2) [DOI] [Google Scholar]
- 27.Connolly SR, Miller AI. 2001. Global Ordovician faunal transitions in the marine benthos: proximate causes. Paleobiology 27, 779–795. () [DOI] [Google Scholar]
- 28.Connolly SR, Miller AI. 2002. Global Ordovician faunal transitions in the marine benthos: ultimate causes. Paleobiology 28, 26–40. () [DOI] [Google Scholar]
- 29.Kröger B. 2005. Adaptive evolution in Paleozoic coiled cephalopods. Paleobiology 31, 253–268. ( 10.1666/0094-8373(2005)031[0253:AEIPCC]2.0.CO;2) [DOI] [Google Scholar]
- 30.Kröger B, Franeck F, Rasmussen CMØ. 2019. The evolutionary dynamics of the early Palaeozoic marine biodiversity accumulation. Proc. R. Soc. B 286, 20191634 ( 10.1098/rspb.2019.1634) [DOI] [PMC free article] [PubMed] [Google Scholar]
- 31.Liow LH, Fortelius M, Bingham E, Lintulaakso K, Mannila H, Flynn L, Stenseth NC. 2008. Higher origination and extinction rates in larger mammals. Proc. Natl Acad. Sci. USA 105, 6097–6102. ( 10.1073/pnas.0709763105) [DOI] [PMC free article] [PubMed] [Google Scholar]
- 32.Liow LH, Reitan T, Harnik PG. 2015. Ecological interactions on macroevolutionary time scales: clams and brachiopods are more than ships that pass in the night. Ecol. Lett. 18, 1030–1039. ( 10.1111/ele.12485) [DOI] [PubMed] [Google Scholar]
- 33.Martins MJF, Puckett TM, Lockwood R, Swaddle JP, Hunt G. 2018. High male sexual investment as a driver of extinction in fossil ostracods. Nature 556, 366–369. ( 10.1038/s41586-018-0020-7) [DOI] [PubMed] [Google Scholar]
- 34.Nichols JD, Morris RW, Brownie C, Pollock KH. 1986. Sources of variation in extinction rates, turnover, and diversity of marine invertebrate families during the Paleozoic. Paleobiology 12, 421–432. ( 10.1017/S0094837300003146) [DOI] [Google Scholar]
- 35.Shute CH, Cleal CJ. 1987. Palaeobotany in museums. Geol. Curator 4, 553–559. [Google Scholar]
- 36.Pledger S, Pollock KH, Norris JL. 2003. Open capture–recapture models with heterogeneity: I. Cormack–Jolly–Seber model. Biometrics 59, 786–794. ( 10.1111/j.0006-341X.2003.00092.x) [DOI] [PubMed] [Google Scholar]
- 37.Krebs C. In press. Estimating abundance and density: mark–recapture techniques. In Ecological methodology, pp. 20–77. See https://www.zoology.ubc.ca/∼krebs/downloads/krebs_chapter_02_2017.pdf.
- 38.Raup D. 1972. Taxonomic diversity during the Phanerozoic. Science 177, 1065–1071. ( 10.1126/science.177.4054.1065) [DOI] [PubMed] [Google Scholar]
- 39.Raup DM. 1979. Biases in the fossil record of species and genera. Bull. Carnegie Mus. Nat. Hist. 13, 85–91. [Google Scholar]
- 40.R Development Core Team 2017. R: a language and environment for statistical computing Vienna, Austria: R Foundation for Statistical Computing. [Google Scholar]
- 41.Wickham H. 2009. ggplot2: elegant graphics for data analysis. New York, NY: Springer. [Google Scholar]
- 42.Wong B. 2011. Points of view: color blindness. Nat. Methods 8, 441–441. ( 10.1038/nmeth.1618) [DOI] [PubMed] [Google Scholar]
- 43.Rasnitsyn AP, Quicke DLJ. 2002. History of insects. Dordrecht, The Netherlands: Kluwer. [Google Scholar]
- 44.Stork NE. 2018. How many species of insects and other terrestrial arthropods are there on Earth? Annu. Rev. Entomol. 63, 31–45. ( 10.1146/annurev-ento-020117-043348) [DOI] [PubMed] [Google Scholar]
- 45.Wang B, Li J, Fang Y, Zhang H. 2009. Preliminary elemental analysis of fossil insects from the Middle Jurassic of Daohugou, Inner Mongolia and its taphonomic implications. Sci. Bull. 54, 783–787. ( 10.1007/s11434-008-0561-5) [DOI] [Google Scholar]
- 46.Zhang H, Wang B, Fang Y. 2010. Evolution of insect diversity in the Jehol Biota. Sci. China Earth Sci. 53, 1908–1917. ( 10.1007/s11430-010-4098-5) [DOI] [Google Scholar]
- 47.Azar D, Gèze R, Acra F. 2010. Lebanese amber. In Biodiversity of fossils in amber from the major world deposits, vol. 304 (ed. Penney D.), pp. 271–298. Manchester, UK: Siri Scientific Press. [Google Scholar]
- 48.Martill DM, Bechly G, Loveridge RF. 2007. The Crato fossil beds of Brazil: window into an ancient world. Cambridge, UK: Cambridge University Press. [Google Scholar]
- 49.Cruaud A, Rasplus J-Y. 2016. Testing cospeciation through large-scale cophylogenetic studies. Curr. Opin. Insect Sci. 18, 53–59. ( 10.1016/j.cois.2016.10.004) [DOI] [PubMed] [Google Scholar]
- 50.Fagua G, Condamine FL, Horak M, Zwick A, Sperling FAH. 2017. Diversification shifts in leafroller moths linked to continental colonization and the rise of angiosperms. Cladistics 33, 449–466. ( 10.1111/cla.12185) [DOI] [PubMed] [Google Scholar]
- 51.McKenna DD, Sequeira AS, Marvaldi AE, Farrell BD. 2009. Temporal lags and overlap in the diversification of weevils and flowering plants. Proc. Natl Acad. Sci. USA 106, 7083–7088. ( 10.1073/pnas.0810618106) [DOI] [PMC free article] [PubMed] [Google Scholar]
- 52.Stireman JO, Devlin H, Carr TG, Abbot P. 2010. Evolutionary diversification of the gall midge genus Asteromyia (Cecidomyiidae) in a multitrophic ecological context. Mol. Phylogenet. Evol. 54, 194–210. ( 10.1016/j.ympev.2009.09.010) [DOI] [PubMed] [Google Scholar]
- 53.Suchan T, Alvarez N. 2015. Fifty years after Ehrlich and Raven, is there support for plant–insect coevolution as a major driver of species diversification? Entomol. Exp. Appl. 157, 98–112. ( 10.1111/eea.12348) [DOI] [Google Scholar]
- 54.Winkler IS, Mitter C, Scheffer SJ. 2009. Repeated climate-linked host shifts have promoted diversification in a temperate clade of leaf-mining flies. Proc. Natl Acad. Sci. USA 106, 18 103–18 108. ( 10.1073/pnas.0904852106) [DOI] [PMC free article] [PubMed] [Google Scholar]
- 55.Condamine FL, Clapham ME, Kergoat GJ. 2016. Global patterns of insect diversification: towards a reconciliation of fossil and molecular evidence? Sci. Rep. 6, 1–13. ( 10.1038/srep19208) [DOI] [PMC free article] [PubMed] [Google Scholar]
- 56.Lapoint RT, Wiens JJ, Whiteman NK. 2015. Herbivory increases diversification across insect clades. Nat. Commun. 6, 1–7. ( 10.1038/ncomms9370) [DOI] [PMC free article] [PubMed] [Google Scholar]
- 57.Barba-Montoya J, Schneider H, Donoghue PCJ, Yang Z. 2018. Constraining uncertainty in the timescale of angiosperm evolution and the veracity of a Cretaceous terrestrial revolution. New Phytol. 218, 819–834. ( 10.1111/nph.15011) [DOI] [PMC free article] [PubMed] [Google Scholar]
- 58.Herendeen PS, Friis EM, Pedersen KR, Crane PR. 2017. Palaeobotanical redux: revisiting the age of the angiosperms. Nat. Plants 3, 17015 ( 10.1038/nplants.2017.15) [DOI] [PubMed] [Google Scholar]
- 59.Labandeira CC. 2014. Why did terrestrial insect diversity not increase during the angiosperm radiation? Mid-Mesozoic, plant-associated insect lineages harbor clues. In Evolutionary biology: genome evolution, speciation, coevolution and origin of life (ed. P Pontarotti), pp. 261–299. Cham, Switzerland: Springer.
- 60.Peris D, Pérez-de la Fuente R, Peñalver E, Delclòs X, Barrón E, Labandeira CC. 2017. False blister beetles and the expansion of gymnosperm–insect pollination modes before angiosperm dominance. Curr. Biol. 27, 897–904. ( 10.1016/j.cub.2017.02.009) [DOI] [PubMed] [Google Scholar]
- 61.Barden P, Grimaldi D. 2012. Rediscovery of the bizarre Cretaceous ant Haidomyrmex Dlussky (Hymenoptera: Formicidae), with two new species. Am. Mus. Novit. 3755, 1–16. ( 10.1206/3755.2) [DOI] [Google Scholar]
- 62.Barden P, Grimaldi D. 2013. A new genus of highly specialized ants in Cretaceous Burmese amber (Hymenoptera: Formicidae). Zootaxa 3681, 405 ( 10.11646/zootaxa.3681.4.5) [DOI] [PubMed] [Google Scholar]
- 63.Barden P, Grimaldi D. 2014. A diverse ant fauna from the mid-Cretaceous of Myanmar (Hymenoptera: Formicidae). PLoS ONE 9, e93627 ( 10.1371/journal.pone.0093627) [DOI] [PMC free article] [PubMed] [Google Scholar]
- 64.Dlussky GM. 1996. Ants (Hymenoptera: Formicidae) from Burmese amber. Paleontol. J. 30, 449–454. [Google Scholar]
- 65.Engel MS, Grimaldi DA. 2005. Primitive new ants in Cretaceous amber from Myanmar, New Jersey, and Canada (Hymenoptera: Formicidae). Am. Mus. Novit. 2005, 1–24. ( 10.1206/0003-0082(2005)485[0001:pnaica]2.0.co;2) [DOI] [Google Scholar]
- 66.Perrichot V. 2014. A new species of the Cretaceous ant Zigrasimecia based on the worker caste reveals placement of the genus in the Sphecomyrminae (Hymenoptera: Formicidae). Myrmecological News 19, 165–169. [Google Scholar]
- 67.Shi G, Grimaldi DA, Harlow GE, Wang J, Wang J, Yang M, Lei W, Li Q, Li X. 2012. Age constraint on Burmese amber based on U–Pb dating of zircons. Cretaceous Res. 37, 155–163. ( 10.1016/j.cretres.2012.03.014) [DOI] [Google Scholar]
- 68.Perrichot V. 2015. A new species of Baikuris (Hymenoptera: Formicidae: Sphecomyrminae) in mid-Cretaceous amber from France. Cretaceous Res. 52, 585–590. ( 10.1016/j.cretres.2014.03.005) [DOI] [Google Scholar]
- 69.Perrichot V, Nel A, Néraudeau D, Lacau S, Guyot T. 2008. New fossil ants in French Cretaceous amber (Hymenoptera: Formicidae). Naturwissenschaften 95, 91–97. ( 10.1007/s00114-007-0302-7) [DOI] [PubMed] [Google Scholar]
- 70.Economo EP, Narula N, Friedman NR, Weiser MD, Guénard B. 2018. Macroecology and macroevolution of the latitudinal diversity gradient in ants. Nat. Commun. 9, 1–8. ( 10.1038/s41467-018-04218-4) [DOI] [PMC free article] [PubMed] [Google Scholar]
- 71.Legalov AA. 2012. The oldest Brentidae and Curculionidae (Coleoptera: Curculionoidea) from the Aptian of Bon-Tsagaan. Hist. Biol. 26, 6–15. ( 10.1080/08912963.2012.751103) [DOI] [Google Scholar]
- 72.Peris D, Davis SR, Engel MS, Delclòs X. 2014. An evolutionary history embedded in amber: reflection of the Mesozoic shift in weevil-dominated (Coleoptera: Curculionoidea) faunas. Zool. J. Linn. Soc. 171, 534–553. ( 10.1111/zoj.12149) [DOI] [Google Scholar]
- 73.Flessa KW, Jablonski D. 1985. Declining Phanerozoic background extinction rates: effect of taxonomic structure? Nature 313, 216–218 ( 10.1038/313216a0) [DOI] [Google Scholar]
- 74.Labandeira CC. 2002. Paleobiology of predators, parasitoids, and parasites: death and accomodation in the fossil record of continental invertebrates. Paleontol. Soc. Pap. 8, 211–250. ( 10.1017/S1089332600001108) [DOI] [Google Scholar]
- 75.Forbes AA, Bagley RK, Beer MA, Hippee AC, Widmayer HA. 2018. Quantifying the unquantifiable: why Hymenoptera, not Coleoptera, is the most speciose animal order. BMC Ecol. 18, 21 ( 10.1186/s12898-018-0176-x) [DOI] [PMC free article] [PubMed] [Google Scholar]
- 76.Hochberg ME, Hawkins BA. 1992. Refuges as a predictor of parasitoid diversity. Science 255, 973–976. ( 10.1126/science.255.5047.973) [DOI] [PubMed] [Google Scholar]
- 77.Godfray HCJ. 1994. Parasitoids: behavioral and evolutionary ecology. Princeton, NJ: Princeton University Press. [Google Scholar]
- 78.Buckling A, Rainey PB. 2002. The role of parasites in sympatric and allopatric host diversification. Nature 420, 496–499 ( 10.1038/nature01164) [DOI] [PubMed] [Google Scholar]
- 79.Deng J, Yu F, Li H-B, Gebiola M, Desdevises Y, Wu S-A, Zhang Y-Z. 2013. Cophylogenetic relationships between Anicetus parasitoids (Hymenoptera: Encyrtidae) and their scale insect hosts (Hemiptera: Coccidae). BMC Evol. Biol. 13, 275 ( 10.1186/1471-2148-13-275) [DOI] [PMC free article] [PubMed] [Google Scholar]
- 80.Hamerlinck G, Hulbert D, Hood GR, Smith JJ, Forbes AA. 2016. Histories of host shifts and cospeciation among free-living parasitoids of Rhagoletis flies. J. Evol. Biol. 29, 1766–1779. ( 10.1111/jeb.12909) [DOI] [PubMed] [Google Scholar]
Associated Data
This section collects any data citations, data availability statements, or supplementary materials included in this article.
Supplementary Materials
Data Availability Statement
Our paper uses data that is not new. Our data and code can be accessed at https://figshare.com/s/6b3b8bab7937a4cc2694.