

Abstract
Purpose
To examine the influence of apoliprotein E ε4 allele (APOE4) carrier status on disease progression by evaluating the rate of regional gray matter (GM) volume loss and disease severity in patients with newly diagnosed Alzheimer disease (AD) and stable amnestic mild cognitive impairment (MCI).
Materials and Methods
This study was approved by the institutional review board and was HIPAA compliant. All subjects or their legal representatives gave informed consent for participation. Ninety-five subjects (63 male; average age, 77.1 years; age range, 58–91 years; 51 APOE4 carriers; 44 noncarriers) with either documented MCI to AD conversion or stable amnestic MCI underwent three yearly magnetic resonance imaging examinations. Voxel-based morphometry for image postprocessing and Clinical Dementia Rating (CDR) scale for cognitive assessment were used.
Results
In APOE4 carriers, GM volume loss affected the hippocampi, temporal and parietal lobes, right caudate nucleus, and insulae in patients with MCI to AD conversion and the insular and temporal lobes in patients in whom MCI was stable. In subjects who were not APOE4 carriers, there was no significant GM volume change. There were no differences in CDR scores between APOE4 carriers and noncarriers.
Conclusion
APOE4 carriers with cognitive decline undergo faster GM atrophy than do noncarriers. The involvement of APOE4 in the progression of hippocampal atrophy, neocortical atrophy, or both has potential important implications for diagnosis and therapeutic approaches in patients with AD and should be considered in clinical trials. The present results and the results of prior studies indicate that the rate of hippocampal and neocortical atrophy is greater in association with APOE4 in nondemented elderly subjects, subjects with MCI, and those with AD.
© RSNA, 2010
Supplemental material: http://radiology.rsna.org/lookup/suppl/doi:10.1148/radiol.10100307/-/DC1
Introduction
Apolipoprotein E (APOE) is involved in lipid transfer, cell metabolism, repair of neuronal injury due to oxidative stress, ischemia, inflammation, amyloid-β peptide accumulation, and the aging process (1). APOE is synthesized by a gene on chromosome 19 in a locus with three alleles (ε2, ε3, and ε4), and it is expressed in the central nervous system in astrocytes and neurons (2). The APOE ε4 allele (APOE4) is a genetic risk factor that increases the occurrence and lowers the age of onset of sporadic and some familial forms of Alzheimer disease (AD), while the APOE ε2 allele may have a protective effect (3,4). APOE4 has been implicated in the pathogenesis of AD through multiple paths, ultimately leading to neurodegeneration in animal models of AD and human subjects with AD who are APOE4 carriers (1,5,6).
We used voxel-based morphometry (VBM), a whole-brain neuroimaging technique, and magnetic resonance (MR) imaging (7,8) to detect gray matter (GM) loss, with voxelwise comparison of GM volume in patients with mild cognitive impairment (MCI) and AD. To reduce the confounding effect of different disease stages, we included in this longitudinal study with within-subject comparison (a) patients with documented conversion from MCI to AD and (b) patients who had received a diagnosis of amnestic MCI but in whom there had been no clinical progression over 3 years. On the basis of prior studies (9,10), we hypothesized that the rate of hippocampal and neocortical volume loss would be greater in APOE4 carriers. Our purpose was to examine the influence of APOE4 carrier status on disease progression by evaluating the rate of regional GM volume loss and disease severity in patients with newly diagnosed AD and stable amnestic MCI.
Materials and Methods
We used prospectively acquired data obtained from the Alzheimer’s Disease Neuroimaging Initiative (ADNI) database (www.loni.ucla.edu/ADNI), which was launched in 2003 by the National Institute on Aging, the National Institute of Biomedical Imaging and Bioengineering, the Food and Drug Administration, and pharmaceutical companies and nonprofit organizations. The primary goals of the ADNI are to test whether serial imaging, measurement of biomarkers, and clinical and neuropsychologic assessment can be combined to measure the progression of MCI and early AD, develop new treatments for AD, and monitor the effectiveness of these treatments. Details of the ADNI study protocol, including inclusion and exclusion criteria, are publicly available (http://www.adni-info.org). Briefly, inclusion criteria require that participants be aged 55–90 years, be in good general health, and have at least 6 years of education. Exclusion criteria are any relevant neurologic condition other than AD and screening MR images that show evidence of infection, infarction, or other focal lesions. After screening, subjects with MCI in the ADNI study undergo clinical and imaging evaluation at baseline and every 6 months thereafter for the first 2 years; thereafter, they undergo annual screening for a total duration of 5 years.
This retrospective study was approved by the institutional review board of the Medical University of South Carolina and was compliant with Health Insurance Portability and Accountability Act regulations. This study was conducted between January 2, 2009, and August 31, 2009. All subjects or their legal representatives gave informed consent for participation. At baseline, the entire ADNI cohort consisted of 818 subjects, 396 of whom had a diagnosis of MCI, 193 of whom had a diagnosis of AD, and 229 of whom were healthy volunteers. The MCI and AD diagnoses were made by a multidisciplinary team that conducted extensive neuropsychologic and neuroimaging assessments. The diagnosis of probable AD was made on the basis of established criteria (11). Clinical criteria for amnestic MCI included (a) memory complaint, (b) abnormal scores on memory tests, (c) normal general mental status, (d) normal daily functioning, and (e) absence of dementia (12). Subjects with the amnestic form of MCI are considered to be at increased risk of developing dementia (13).
We divided patients with a diagnosis of MCI at baseline into two groups: Group 1 comprised 125 (31.6%) subjects in whom MCI progressed to AD during participation in the ADNI project. Group 2 comprised 271 (68.4%) subjects with stable MCI. We used the following inclusion criteria for the two groups: In group 1, subjects had (a) documented conversion from MCI to probable AD during study participation, (b) known APOE genotypes, and (c) three readily available serial brain MR imaging studies, the first obtained 12 months before the visit in which probable AD was diagnosed; the second, at the time of AD diagnosis; and the third, 12 months after diagnosis of AD. In group 2, subjects had (a) clinical diagnosis of amnestic MCI, (b) clinical follow-up data obtained at 6-month intervals for 2 years and at 12-month intervals thereafter showing stable cognitive status over the remaining 3 years, (c) known APOE genotype, and (d) three readily available serial brain MR imaging studies, the first obtained at baseline; the second, at 12-month follow-up; and the third, at 24-month follow-up.
We excluded all subjects if all the findings of the required serial clinical and imaging assessments were not available. We excluded subjects in whom at least one of the brain MR data sets was not technically adequate because of macroscopic head motion or technical issues with image postprocessing. We excluded nonwhite subjects.
Subjects with MCI in the ADNI cohort undergo brain MR imaging and a comprehensive clinical evaluation every 6 months for the first 2 years of participation and then every 12 months for the next 3 years. As a result, the date of conversion from MCI to AD is not precisely known, because conversion could have happened during the 6 months between visits. However, we included in group 1 only those patients in whom MCI had converted to AD during the first 2 years of their participation in the ADNI project, when study visits were conducted every 6 months.
Forty-seven subjects with documented conversion from MCI to AD (27 APOE4 carriers, 20 noncarriers), representing the totality of the sample in the cohort that met study inclusion and exclusion criteria for MCI to AD conversion at the time of data collection (January and February 2009), were included (Table 1). A total of 78 subjects with conversion from MCI to AD were excluded: Twenty-eight subjects were excluded because of head motion or issues with image postprocessing of at least one MR data set, 47 subjects were excluded because MR imaging or clinical records were incomplete and because conversion from MCI to AD occurred after the first 2 years of study participation, and three subjects were excluded because they were not white. (Details are provided later in this article.)
Table 1.
Main Demographic and Clinical Characteristics of APOE4 Carriers and Noncarriers Stratified by Diagnostic Group
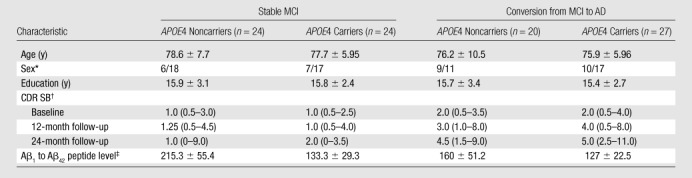
Note.—Unless otherwise indicated, data are mean ± standard deviation.
Data are number of women and men, respectively.
Data are median, and data in parentheses are the range.
Data were available for 14 APOE4 carriers and 13 noncarriers with stable MCI and 11 APOE4 carriers and 14 noncarriers with conversion from MCI to AD.
We included 48 subjects with stable MCI (24 APOE4 carriers, 24 noncarriers), representing the totality of the sample in the cohort that met study inclusion and exclusion criteria for stable MCI at the time of data collection (May 2009). Patients with stable MCI whose ADNI baseline visit occurred between September 2005 (when enrollment in the ADNI study began) and May 2006 and who had undergone 3 years of longitudinal clinical follow-up at the time of data collection, revealing stable cognitive impairment, were included. A total of 22 subjects with stable MCI were excluded: Seventeen subjects were excluded because of incomplete MR imaging or clinical data, two were excluded because of head motion or issues with image postprocessing of at least one of the MR data sets, and three were excluded because they were not white.
We included only white patients in the present study because previous studies have reported a weaker association between APOE4 status and AD onset in other ethnic groups (14). This resulted in the exclusion of three subjects with conversion from MCI to AD (one Asian subject who was a noncarrier, one African-American subject who was an APOE4 carrier, and one African-American subject who was a noncarrier) and three subjects with stable MCI (two Asian subjects who were noncarriers and one African-American subject who was an APOE4 carrier).
Three brain MR imaging studies obtained 12 months before conversion from MCI to AD, at the time of AD diagnosis, and 12 months after AD diagnosis were available for each subject in whom MCI converted to AD. Three brain MR imaging studies obtained at baseline and at 12- and 24-month follow-up were available for each subject. Two neuroradiologists (M.V.S., Z.R.; 6 and 10 years, respectively, of experience in neuroradiology) reviewed MR imaging studies; they evaluated head motion and confirmed the absence of other causes of diffuse or focal brain volume loss, including extensive white matter disease or cerebral infarction. Determination of APOE genotype of all subjects from peripheral blood DNA was conducted at the ADNI Biomarker Core Laboratory. Cerebrospinal fluid samples were obtained in 52 subjects (11 APOE4 carriers and 14 noncarriers with conversion from MCI to AD, 14 APOE4 carriers and 13 noncarriers with stable MCI) when they entered the ADNI, as described in the ADNI procedures manual (http://www.adni-info.org/). Amyloid-β peptide (Aβ1 to Aβ42) levels (measured in picograms per milliliter) were measured in cerebrospinal fluid samples.
Cognitive Testing
Cognitive status was assessed with the Clinical Dementia Rating (CDR) scale during a semistructured interview with the patient and caregiver, in which an index of global functioning is obtained (15). By assigning a severity score for six domains (memory, orientation, judgment and problem solving, community affairs, home and hobbies, and personal care), a total score known as the CDR sum of boxes (SB) is obtained. The CDR scale has been extensively validated as a clinical tool with which to stage the severity of dementia, and it is considered a reliable predictor of cognitive decline (15–17).
MR Imaging
MR imaging was performed with 1.5-T systems and use of standardized parameters, the details of which are available online (http://www.loni.ucla.edu/ADNI/Research/Cores). Volumetric magnetization-prepared rapid gradient echo sequences were used in the analysis. Magnetization-prepared rapid gradient echo images downloaded from the ADNI Web site had been previously submitted for image preprocessing correction to ensure standardized quality across multiinstitutional data.
Statistical Analysis
Differences between APOE4 carriers and noncarriers within each group (MCI to AD conversion and stable MCI) were evaluated by using the Pearson χ2 test for sex and global CDR (baseline and 12- and 24-month follow-up) and one-way analysis of variance for age, education, and CDR SB (baseline and 12- and 24-month follow-up). General linear model repeated-measures analysis was used for analysis of variance of repeated CDR SB measurements (within-subjects factor) over time, stratifying patients on the basis of APOE genotype (between-subjects factor).
Analyses were conducted by using statistical software (SPSS 16.0 for Windows; SPSS, Chicago, Ill). A P value of less than .05 indicated a significant difference. None of the MR data sets were excluded because of diffuse or focal brain volume loss or extensive white matter disease. Magnetization-prepared rapid gradient echo images were processed by using VBM with statistical parametric mapping (SPM5; Functional Imaging Laboratory, Wellcome Trust Centre for Neuroimaging, London, England) on Matlab 7.6.0 (Mathworks, Natick, Mass), with the VBM5 toolbox (Christian Gaser, University of Jena, Jena, Germany). Preprocessing included spatial normalization, segmentation, Jacobian modulation, and smoothing with a 12-mm full width at half maximum isotropic Gaussian kernel (final voxel resolution, 1 × 1 × 1 mm). The resulting GM maps were then submitted for statistical analysis with statistical parametric mapping. Comparison between longitudinal data for APOE4 carriers and noncarriers acquired at baseline and at 12- and 24-month follow-up within each group was conducted with the paired t test. Familywise error correction for multiple comparisons was applied, and a P value of less than .05 (extent threshold, 10 voxels) indicated a significant difference. MR image postprocessing and statistical analyses were conducted by a neuroradiologist (M.V.S.) with 7 years of experience with brain MR postprocessing with statistical parametric mapping.
Results
Clinical Data
Table 1 summarizes main demographic data and CDR SB of patients stratified by diagnosis and APOE status. CDR score was 0.5 for all subjects with stable MCI at baseline, while median CDR score was 0.5 at 12- and 24-month follow-up (range, 0–0.5 for both). CDR score was 0.5 for all subjects with MCI to AD conversion at baseline; median CDR score was 0.5 (range, 0.5–1) when AD conversion was diagnosed and 1 (range, 0.5–2) 12 months after diagnosis in all patients with MCI to AD conversion (both APOE4 carriers and noncarriers).There were no significant differences in age, sex distribution, years of education, or disease severity, as measured by using the CDR scale and CDR SB at baseline and 12 and 24 months after diagnosis of AD between APOE4 carriers and noncarriers within the MCI and AD groups. There was a trend toward higher CDR SB in APOE4 carriers than in noncarriers in the AD group 12 months after diagnosis of AD (P = .065). All APOE4 carriers had decreased Aβ1 to Aβ42 peptide levels in cerebrospinal fluid on the basis of the 192 pg/mL cutoff proposed by Shaw et al (18), regardless of whether they had stable or worsening cognitive status. Among APOE4 noncarriers, 11 (79%) of 14 patients with MCI to AD conversion and four (31%) of 13 patients with stable MCI had decreased Aβ1 to Aβ42 peptide levels in cerebrospinal fluid.
The general linear model for repeated measures (tests of within-subjects effects with the Huynh-Feldt epsilon approach) revealed a significant (P < .001) progressive cognitive decline in the subgroup of patients in whom MCI progressed to AD, without significant interaction between CDR SB and APOE4 status (Fig 1a). In the stable MCI group (Fig 1b), differences in CDR SB over time were significant (P = .049) during the 2-year follow-up period, but there was no significant interaction between CDR SB and APOE4.
Figure 1a:

(a, b) Graphs show CDR SB of patients stratified by diagnosis and APOE status. (a) Patients in whom MCI progressed to AD. (b) Patients with stable MCI.
Figure 1b:

(a, b) Graphs show CDR SB of patients stratified by diagnosis and APOE status. (a) Patients in whom MCI progressed to AD. (b) Patients with stable MCI.
MR Imaging
Comparison of GM volume in APOE4 carriers with that in APOE4 noncarriers at baseline did not reveal significant differences between the groups. In APOE4 carriers with conversion from MCI to AD, significant GM volume loss was observed during the 12 months before diagnosis of conversion (Table 2, Fig 2a) and during the 12 months after diagnosis of conversion (Table 2, Fig 2b). Significant GM volume loss was seen in the right temporal lobe, right hippocampus, and left insula during the 12 months before diagnosis of conversion. During the 12 months after diagnosis of conversion, GM volume loss was observed in the bilateral hippocampi, bilateral temporal lobes, bilateral parietal lobes, right caudate nuclei, and bilateral insula. Conversely, there were no significant changes in GM volume in noncarriers during the 12 months before and the 12 months after diagnosis of conversion.
Table 2.
Areas of GM Volume Loss during the 12 Months prior to and 12 Months after Clinical Conversion from MCI to AD in APOE4 Carriers
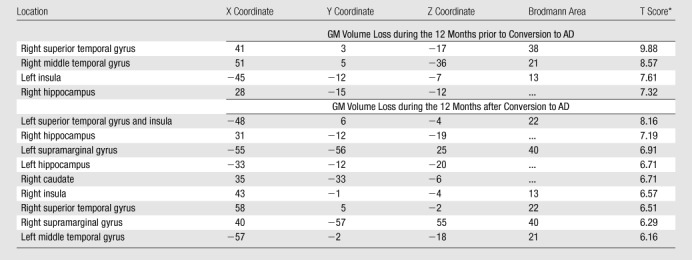
Note.—X, Y, and Z are brain coordinates based on the Montreal Neurologic Institute standard brain template. This format uses three numbers to describe the distance from a point at midline and 4 mm below the anterior commissure. The X, Y, and Z dimensions refer to left-right, posterior-anterior, and inferior-superior, respectively. By convention, the right hemisphere has positive X values; the anterior brain, positive Y values; and the superior brain, positive Z values.
P < .05. Family-wise error correction for multiple comparisons was applied.
Figure 2a:

(a, b) MR images show GM volume loss in APOE4 carriers with MCI and those with AD. (a) Areas of significant GM volume loss in patients with stable MCI (blue) and those with progression from MCI to AD (red) during 1st year of follow-up. The area of GM volume loss in the region of the right parahippocampal gyrus represents a cluster of cortical loss centered at the level of the uncus (coordinates: 30, −11, −40), which artifactually extends outside the brain. (b) Areas of significant GM volume loss in patients in whom MCI progressed to AD during 2nd year of follow-up (red). No areas of significant GM volume loss were observed in patients with stable MCI during the 2nd year of follow-up with the same statistical threshold. Statistical maps are displayed, with a statistical threshold of P < .05 (family-wise error-corrected, extent threshold = 10 voxels).
Figure 2b:

(a, b) MR images show GM volume loss in APOE4 carriers with MCI and those with AD. (a) Areas of significant GM volume loss in patients with stable MCI (blue) and those with progression from MCI to AD (red) during 1st year of follow-up. The area of GM volume loss in the region of the right parahippocampal gyrus represents a cluster of cortical loss centered at the level of the uncus (coordinates: 30, −11, −40), which artifactually extends outside the brain. (b) Areas of significant GM volume loss in patients in whom MCI progressed to AD during 2nd year of follow-up (red). No areas of significant GM volume loss were observed in patients with stable MCI during the 2nd year of follow-up with the same statistical threshold. Statistical maps are displayed, with a statistical threshold of P < .05 (family-wise error-corrected, extent threshold = 10 voxels).
In APOE4 carriers with stable MCI, areas of GM volume loss were observed in the bilateral insula and temporal lobes during the 1st year of follow-up (Table 3, Fig 2a) but were not observed during the 2nd year of follow-up. In APOE4 noncarriers with stable MCI, no significant GM volume loss was observed during the 1st or 2nd year of follow-up.
Table 3.
Areas of GM Volume Loss during the First 12 Months after Entering the Study in APOE4 Carriers with Stable MCI
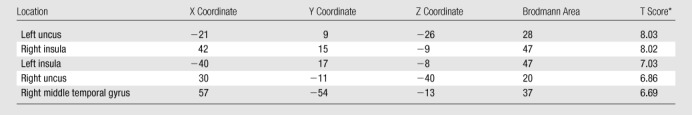
Note.—X, Y, and Z are brain coordinates based on the Montreal Neurologic Institute standard brain template. This format uses three numbers to describe the distance from a point at midline and 4 mm below the anterior commissure. The X, Y, and Z dimensions refer to left-right, posterior-anterior, and inferior-superior, respectively. By convention, the right hemisphere has positive X values; the anterior brain, positive Y values; and the superior brain, positive Z values.
P < .05. Family-wise error correction for multiple comparisons was applied.
Discussion
We evaluated the longitudinal effects of the APOE genotype on regional GM loss and disease severity in patients with stable amnestic MCI and in those with documented conversion from MCI to probable AD over a 2-year period.
There was significant progression of GM atrophy in the bilateral hippocampi, temporal neocortex, insula, and parietal lobes in APOE4 carriers with conversion from MCI to AD. We also found areas of GM volume loss in the bilateral insula and temporal lobes in APOE4 carriers with stable MCI. The reason GM volume loss was observed in APOE4 carriers with stable MCI during only the 1st year of follow-up remains unclear. This may reflect the nonlinear effect of APOE4 on brain volume loss rates in patients with MCI, as previously reported by Jack et al (19).
APOE4 noncarriers in each subgroup did not experience any significant GM volume loss during the 2-year follow-up. No significant difference in cognitive status, as measured by using the CDR scale and CDR SB, was observed between APOE4 carriers and noncarriers in each group.
APOE4 has been linked to the pathogenesis of AD with a “two-switch” mechanism (20). In response to stressors, neurons begin processing intranuclear APOE intron 3 into mature APOE messenger RNA (4,5). However, APOE4, to a greater extent than its isoforms, undergoes proteolytic cleavage (1,5). After proteolysis, carboxyl-terminal-truncated APOE fragments have an increased affinity for phospholipids; therefore, they have the potential to destabilize and cross membranes, disrupting the structure and function of neuronal cells and ultimately leading to neuronal death. Preclinical studies suggest that APOE4 is responsible for increased accumulation of amyloid-β protein compared with its isoforms; it is less efficient in maintaining cytoskeletal structure and mitochondrial function, it stimulates τ phosphorylation, and it potentiates amyloid-β–induced lysosomal leakage and apoptosis (1,21). The distribution of brain volume loss observed in this study in APOE4 carriers is consistent with the results of prior animal and human studies, which have shown an association between APOE4 and pathologic changes typical of AD in the limbic system and neocortex (6,22–26). Cross-sectional and longitudinal imaging data revealed a more severe hippocampal, entorhinal, and amygdalar volume loss in nondemented APOE4 carriers than in noncarriers (27–29). Moffat et al (29) evaluated longitudinal changes in hippocampal volume in 39 nondemented elderly subjects by comparing two sets of MR images obtained an average of 2.7 years apart and found greater loss of hippocampal volume in APOE4 carriers than in noncarriers. Patients with AD who had the E4/E4 genotype had greater volume loss in the amygdala and hippocampus, especially the right hippocampus and amygdala, when compared with those who had other genotypes (9). Mori et al (10) found that the rate of hippocampal atrophy over a 12-month period was significantly more severe in patients with AD who were APOE4 carriers than in patients with AD who were APOE4 noncarriers.
In prior cross-sectional VBM studies, researchers have investigated the relationship between APOE4 status and GM atrophy in patients with AD and those with MCI. A cross-sectional VBM study showed that APOE4 carriers with stable MCI had greater atrophy in the right hippocampus and amygdala than did noncarriers, while APOE4 carriers in whom MCI eventually progressed to dementia at clinical follow-up had atrophy in the inferior frontal gyrus when compared with noncarriers (30). Pievani et al (31) found that APOE4 status may have a region-specific effect on brain volume loss, with greater volume loss affecting the temporal lobes and right occipital lobe in APOE4 carriers with AD; however, these results were not significant after the researchers applied statistical correction for multiple comparisons. A cross-sectional VBM study revealed significant loss of GM volume in the bilateral parietal cortex, right hippocampus, precuneus, and middle frontal gyrus in APOE4 carriers with AD when compared with noncarriers (20). Conversely, another recent cross-sectional VBM study in a group of 32 patients with AD failed to reveal any significant difference in regional brain atrophy between APOE4 carriers and noncarriers (32).
Neuropathologic changes typical of AD, particularly neurofibrillary tangles, follow a predictable distribution at different stages of the disease (33). Initially, neurofibrillary tangles occur predominantly in the perirhinal region of the temporal lobe (Braak stages I and II, clinically silent). Later on, they occur in the limbic system (Braak stages III and IV, incipient AD). In advanced stages of the disease, they affect the neocortex (Braak stages V and VI, fully developed AD) (34,35). In agreement with this model of neurodegeneration in AD, we found significant loss of GM volume in the temporal and insular regions in APOE4 carriers with stable MCI, while APOE4 carriers had significant GM volume loss not only in the temporal lobe and insula but also in the neocortex, specifically, the parietal lobes 1 year after conversion of MCI to AD. In addition, only patients with clinical progression from MCI to AD had significant loss of hippocampi volume during 2-year follow-up.
The association between hippocampal volume loss and conversion to AD is well known and has been recently evaluated with MR morphometric techniques (36,37).
We found significant GM volume loss in the insula in both the stable MCI group and the MCI-to-AD group, with greatest foci of GM loss centered at the level of the anterior insula (right and left anterior and middle short gyrus) in APOE4 carriers with stable MCI and at the level of the posterior insula (left inferior periinsular gyrus and right anterior longus insular gyrus) in patients with conversion from MCI to AD (38). The insula has been implicated in a variety of processes, ranging from representation of self-awareness and consciousness to visceral control and sensation, as part of a complex functional network that includes multimodality sensory inputs, subcortical and limbic structures, the anterior and posterior cingulate cortex, and the dorsolateral frontal and parietal cortex (39–41). Previous pathologic analyses and imaging studies have revealed substantial abnormalities in the insular cortex in patients with AD (35,42–44). Although the role of the insular cortex in the pathogenesis of AD is not completely understood, insular disease likely contributes to the corruption of concepts of self and well-being (35).
We also found significant loss of GM volume in the supramarginal gyrus in APOE4 carriers during the 12 months after conversion from MCI to AD. The supramarginal gyrus is an area of the posterior cortex that is particularly susceptible to deposition of neurofibrillary tangles and neuronal loss, especially in patients with advanced AD, in whom cognitive deficits in areas other than memory begin to appear (45–47).
Drawbacks of prior VBM studies on the correlation between regional GM volume changes and APOE4 status were use of a cross-sectional approach and potential inclusion of patients at different stages of disease. Thus, more rigorous selection criteria and longitudinal observations are needed to reveal differential patterns of GM loss between APOE4 carriers and noncarriers.
The main strengths of our study when compared with the existing literature were as follows: We used a whole-brain image analysis technique to detect GM changes, and we were not limited to region-of-interest analysis of selected regions in patients stratified on the basis of APOE genotype and disease status. We performed a longitudinal analysis of MR data, which enabled us to perform within-subject comparisons. We selected relatively homogeneous patient groups, with respect to cognitive status and timeline in the natural history of patient condition. We used a stringent statistical threshold compared with that used in prior VBM cross-sectional studies.
The results of the present study and those of prior studies indicate that the rate of hippocampal and neocortical atrophy is greater in association with APOE4 in nondemented elderly subjects, in subjects with MCI, and in those with AD. The greater rate of GM volume loss in APOE4 carriers with AD compared with that in noncarriers with AD 1 year before and 1 year after the diagnosis of AD potentially clarifies the known relationship between treatment response and APOE4 genotype. APOE4 carrier status is thought to be a predictor of poor response to treatment with acetylcholinesterase inhibitors and rosiglitazone in patients with AD (26,48–50). The greater rate of GM volume loss in APOE4 carriers suggests that the brains of APOE4 carriers may be more vulnerable to endo- and exogenous stressors and more difficult to treat than the brains of noncarriers. Significant GM volume loss was observed only in APOE4 carriers, regardless of whether they had stable cognitive impairment or clinically worsening cognitive impairment. On the other hand, there was no significant GM volume loss in APOE4 noncarriers with worsening cognitive status. These findings suggest that APOE4 is related to progression to AD and GM volume loss; however, they also challenge the postulated relationship between GM atrophy and cognitive decline. Our results in the APOE4 noncarriers suggest that accelerated hippocampal and neocortical volume loss cannot entirely account for cognitive deterioration in this clinical setting and that other factors must be investigated to clarify the clinical progression from MCI to AD.
Aβ1 to Aβ42 peptide levels measured in the cerebrospinal fluid are promising AD biomarkers. Reduced values of this peptide are found in the cerebrospinal fluid of patients with AD as a result of its accumulation into insoluble plaques in the brain. Shaw et al (18) found that a cutoff value of 192 pg/mL for Aβ1 to Aβ42 peptide levels had a sensitivity of 96.4% and a negative predictive value of 95.2% in the identification of subjects with AD versus healthy control subjects. There is also a well-known inverse correlation between levels of Aβ1 to Aβ42 peptide and APOE genotype with lowest Aβ1 to Aβ42 values in patients homozygous for APOE4 (51,52). Given the correlation of the APOE4 genotype and decreased Aβ1 to Aβ42 values with amyloid plaque formation, it would be important to assess the differences in GM volume loss rates in patients with AD who are APOE4 carriers and “amyloid positive” (as defined by a cerebrospinal fluid cutoff of 192 pg/mL) and patients who are APOE4 carriers and “amyloid negative.” We were unable to conduct this subgroup analysis, since all of the APOE4 carriers with MCI-to-AD conversion were amyloid positive.
This study had several limitations. An important limitation of the study was the inclusion of only white subjects. Given the small numbers of nonwhite subjects eligible for the study (three patients with conversion to AD, three patients with stable MCI), we decided to focus this investigation on white subjects because a weaker association between APOE4 carrier status and onset of AD has been reported in African-American subjects compared with white subjects (14). When more ADNI data on nonwhite subjects becomes available, further analysis of data from nonwhite subjects should be conducted. Sample sizes may have been insufficient to enable us to detect small volume changes in the APOE4 noncarrier groups and subtle differences in cognitive performance between groups. These findings were not confirmed with pathologic analysis; nevertheless, a multidisciplinary team evaluated patients, and pathologic findings will eventually become available for some patients.
This study focuses on an important but relatively narrow phase of the natural history of this disease. Future investigations of patterns and rates of brain volume loss during transition from normal aging to MCI are needed. The relationship between APOE genotype, brain volume loss, and regional changes in brain metabolism, as measured with positron emission tomography, also requires further investigation. Quantification of longitudinal regional changes in GM volume in APOE4 carriers and noncarriers with MCI and comparison of the relative degree of volume loss over time may assist in the identification of morphometric predictors of MCI-to-AD conversion.
In conclusion, we investigated the correlation between APOE genotype, disease severity, and patterns of GM volume loss in patients with stable MCI and those with progression from MCI to AD. Not only is the APOE genotype linked to the development of AD, it also appears to be specifically related to accelerated atrophy of the hippocampi and neocortical regions in patients with MCI and those with AD. Although the APOE genotype does not strongly influence the rate of cognitive decline in patients with AD, the faster rate of hippocampal and cortical atrophy seen in APOE4 carriers is likely an important factor in determining and modulating treatment response. It is important to understand the role of the APOE genotype in the progression of neurodegeneration to optimize treatment regimens, including therapies that target APOE structure and function, and APOE genotype testing should be included in clinical trials that target patients with probable AD.
Advances in Knowledge.
-
•.
Not only is apoliprotein E ε4 allele (APOE4) carrier status a genetic risk factor for Alzheimer disease (AD), it also appears to be related to accelerated atrophy of the hippocampi and neocortical regions in subjects with amnestic mild cognitive impairment (MCI) and AD.
-
•.
In APOE4 noncarriers with conversion from MCI to AD, there is dissociation between worsening cognitive status and progression of gray matter atrophy.
Implications for Patient Care.
-
•.
It is important to understand the role of the apoliprotein E (APOE) genotype in the progression of cognitive decline and neurodegeneration to optimize treatment regimens.
-
•.
APOE genotype testing should be included in clinical trials in which patients with probable AD are targeted.
APPENDIX
Acknowledgments
Data used in the preparation of this article were obtained from the Alzheimer’s Disease Neuroimaging Initiative (ADNI) database (http://www.loni.ucla.edu/ADNI). As such, the investigators within the ADNI contributed to the design and implementation of ADNI and/or provided data but did not participate in analysis or writing of this report. A complete listing of ADNI investigators is available in Appendix E1 (online), as well as at http://www.loni.ucla.edu/ADNI/Collaboration/ADNI_Manuscript_Citations.pdf.
Received June 22, 2010; revision requested July 29; revision received August 20; accepted September 8; final version accepted September 20.
See also the editorial by Bizzi in this issue.
Disclosures of Potential Conflicts of Interest: M.V.S. Financial activities related to the present article: none to disclose. Financial activities not related to the present article: none to disclose. Other relationships: institution received compensation from Bayer HealthCare and Bracco Diagnostics. Z.R. Financial activities related to the present article: none to disclose. Financial activities not related to the present article: none to disclose. Other relationships: is a consultant for Bracco Diagnostics; provides research support for Bracco Diagnostics, Bayer, and Siemens. R.J.H. No potential conflicts of interest to disclose. J.E.M. Financial activities related to the present article: institution received funding from National Institute on Aging. Financial activities not related to the present article: is on the board of ADNI. Other relationships: none to disclose.
Abbreviations:
- AD
- Alzheimer disease
- ADNI
- Alzheimer’s Disease Neuroimaging Initiative
- CDR
- Clinical Dementia Rating
- GM
- gray matter
- MCI
- mild cognitive impairment
- SB
- sum of boxes
- VBM
- voxel-based morphometry
References
- 1.Mahley RW, Weisgraber KH, Huang Y. Apolipoprotein E4: a causative factor and therapeutic target in neuropathology, including Alzheimer’s disease. Proc Natl Acad Sci U S A 2006;103(15):5644–5651. [DOI] [PMC free article] [PubMed] [Google Scholar]
- 2.Xu PT, Gilbert JR, Qiu HL, et al. Specific regional transcription of apolipoprotein E in human brain neurons. Am J Pathol 1999;154(2):601–611. [DOI] [PMC free article] [PubMed] [Google Scholar]
- 3.Strittmatter WJ, Saunders AM, Schmechel D, et al. Apolipoprotein E: high-avidity binding to beta-amyloid and increased frequency of type 4 allele in late-onset familial Alzheimer disease. Proc Natl Acad Sci U S A 1993;90(5):1977–1981. [DOI] [PMC free article] [PubMed] [Google Scholar]
- 4.Xu Q, Walker D, Bernardo A, Brodbeck J, Balestra ME, Huang Y. Intron-3 retention/splicing controls neuronal expression of apolipoprotein E in the CNS. J Neurosci 2008;28(6):1452–1459. [DOI] [PMC free article] [PubMed] [Google Scholar]
- 5.Mahley RW, Huang Y. Apolipoprotein (apo) E4 and Alzheimer’s disease: unique conformational and biophysical properties of apoE4 can modulate neuropathology. Acta Neurol Scand Suppl 2006;185:8–14. [DOI] [PubMed] [Google Scholar]
- 6.Tiraboschi P, Hansen LA, Masliah E, Alford M, Thal LJ, Corey-Bloom J. Impact of APOE genotype on neuropathologic and neurochemical markers of Alzheimer disease. Neurology 2004;62(11):1977–1983. [DOI] [PubMed] [Google Scholar]
- 7.Ashburner J, Friston KJ. Voxel-based morphometry: the methods. Neuroimage 2000;11(6 pt 1):805–821. [DOI] [PubMed] [Google Scholar]
- 8.Good CD, Johnsrude IS, Ashburner J, Henson RN, Friston KJ, Frackowiak RS. A voxel-based morphometric study of ageing in 465 normal adult human brains. Neuroimage 2001;14(1 pt 1):21–36. [DOI] [PubMed] [Google Scholar]
- 9.Lehtovirta M, Laakso MP, Soininen H, et al. Volumes of hippocampus, amygdala and frontal lobe in Alzheimer patients with different apolipoprotein E genotypes. Neuroscience 1995;67(1):65–72. [DOI] [PubMed] [Google Scholar]
- 10.Mori E, Lee K, Yasuda M, et al. Accelerated hippocampal atrophy in Alzheimer’s disease with apolipoprotein E epsilon4 allele. Ann Neurol 2002;51(2):209–214. [DOI] [PubMed] [Google Scholar]
- 11.McKhann G, Drachman D, Folstein M, Katzman R, Price D, Stadlan EM. Clinical diagnosis of Alzheimer’s disease: report of the NINCDS-ADRDA Work Group under the auspices of Department of Health and Human Services Task Force on Alzheimer’s Disease. Neurology 1984;34(7):939–944. [DOI] [PubMed] [Google Scholar]
- 12.Petersen RC, Smith GE, Waring SC, Ivnik RJ, Tangalos EG, Kokmen E. Mild cognitive impairment: clinical characterization and outcome. Arch Neurol 1999;56(3):303–308. [DOI] [PubMed] [Google Scholar]
- 13.Petersen RC. Mild cognitive impairment: transition between aging and Alzheimer’s disease. Neurologia 2000;15(3):93–101. [PubMed] [Google Scholar]
- 14.Mayeux R. Apolipoprotein E, Alzheimer disease, and African Americans. Arch Neurol 2003;60(2):161–163. [DOI] [PubMed] [Google Scholar]
- 15.Berg L, Miller JP, Baty J, Rubin EH, Morris JC, Figiel G. Mild senile dementia of the Alzheimer type. IV. Evaluation of intervention. Ann Neurol 1992;31(3):242–249. [DOI] [PubMed] [Google Scholar]
- 16.Juva K, Sulkava R, Erkinjuntti T, Ylikoski R, Valvanne J, Tilvis R. Usefulness of the Clinical Dementia Rating scale in screening for dementia. Int Psychogeriatr 1995;7(1):17–24. [DOI] [PubMed] [Google Scholar]
- 17.Morris JC. Clinical dementia rating: a reliable and valid diagnostic and staging measure for dementia of the Alzheimer type. Int Psychogeriatr 1997;9(suppl 1):173–176; discussion 177–178. [DOI] [PubMed] [Google Scholar]
- 18.Shaw LM, Vanderstichele H, Knapik-Czajka M, et al. Cerebrospinal fluid biomarker signature in Alzheimer’s disease neuroimaging initiative subjects. Ann Neurol 2009;65(4):403–413. [DOI] [PMC free article] [PubMed] [Google Scholar]
- 19.Jack CR, Weigand SD, Shiung MM, et al. Atrophy rates accelerate in amnestic mild cognitive impairment. Neurology 2008;70(19 pt 2):1740–1752. [DOI] [PMC free article] [PubMed] [Google Scholar]
- 20.Agosta F, Vossel KA, Miller BL, et al. Apolipoprotein E epsilon4 is associated with disease-specific effects on brain atrophy in Alzheimer’s disease and frontotemporal dementia. Proc Natl Acad Sci U S A 2009;106(6):2018–2022. [DOI] [PMC free article] [PubMed] [Google Scholar]
- 21.Holtzman DM, Bales KR, Tenkova T, et al. Apolipoprotein E isoform-dependent amyloid deposition and neuritic degeneration in a mouse model of Alzheimer’s disease. Proc Natl Acad Sci U S A 2000;97(6):2892–2897. [DOI] [PMC free article] [PubMed] [Google Scholar]
- 22.Nagy Z, Esiri MM, Jobst KA, et al. Influence of the apolipoprotein E genotype on amyloid deposition and neurofibrillary tangle formation in Alzheimer’s disease. Neuroscience 1995;69(3):757–761. [DOI] [PubMed] [Google Scholar]
- 23.Brecht WJ, Harris FM, Chang S, et al. Neuron-specific apolipoprotein e4 proteolysis is associated with increased tau phosphorylation in brains of transgenic mice. J Neurosci 2004;24(10):2527–2534. [DOI] [PMC free article] [PubMed] [Google Scholar]
- 24.Tesseur I, Van Dorpe J, Spittaels K, Van den Haute C, Moechars D, Van Leuven F. Expression of human apolipoprotein E4 in neurons causes hyperphosphorylation of protein tau in the brains of transgenic mice. Am J Pathol 2000;156(3):951–964. [DOI] [PMC free article] [PubMed] [Google Scholar]
- 25.Buttini M, Yu GQ, Shockley K, et al. Modulation of Alzheimer-like synaptic and cholinergic deficits in transgenic mice by human apolipoprotein E depends on isoform, aging, and overexpression of amyloid beta peptides but not on plaque formation. J Neurosci 2002;22(24):10539–10548. [DOI] [PMC free article] [PubMed] [Google Scholar]
- 26.Poirier J, Delisle MC, Quirion R, et al. Apolipoprotein E4 allele as a predictor of cholinergic deficits and treatment outcome in Alzheimer disease. Proc Natl Acad Sci U S A 1995;92(26):12260–12264. [DOI] [PMC free article] [PubMed] [Google Scholar]
- 27.Burggren AC, Zeineh MM, Ekstrom AD, et al. Reduced cortical thickness in hippocampal subregions among cognitively normal apolipoprotein E e4 carriers. Neuroimage 2008;41(4):1177–1183. [DOI] [PMC free article] [PubMed] [Google Scholar]
- 28.den Heijer T, Oudkerk M, Launer LJ, van Duijn CM, Hofman A, Breteler MM. Hippocampal, amygdalar, and global brain atrophy in different apolipoprotein E genotypes. Neurology 2002;59(5):746–748. [DOI] [PubMed] [Google Scholar]
- 29.Moffat SD, Szekely CA, Zonderman AB, Kabani NJ, Resnick SM. Longitudinal change in hippocampal volume as a function of apolipoprotein E genotype. Neurology 2000;55(1):134–136. [DOI] [PubMed] [Google Scholar]
- 30.Hämäläinen A, Grau-Olivares M, Tervo S, et al. Apolipoprotein E epsilon 4 allele is associated with increased atrophy in progressive mild cognitive impairment: a voxel-based morphometric study. Neurodegener Dis 2008;5(3-4):186–189. [DOI] [PubMed] [Google Scholar]
- 31.Pievani M, Rasser PE, Galluzzi S, et al. Mapping the effect of APOE epsilon4 on gray matter loss in Alzheimer’s disease in vivo. Neuroimage 2009;45(4):1090–1098. [DOI] [PMC free article] [PubMed] [Google Scholar]
- 32.Drzezga A, Grimmer T, Henriksen G, et al. Effect of APOE genotype on amyloid plaque load and gray matter volume in Alzheimer disease. Neurology 2009;72(17):1487–1494. [DOI] [PubMed] [Google Scholar]
- 33.Braak H, Braak E. Evolution of neuronal changes in the course of Alzheimer’s disease. J Neural Transm Suppl 1998;53:127–140. [DOI] [PubMed] [Google Scholar]
- 34.Nagy Z, Hindley NJ, Braak H, et al. The progression of Alzheimer’s disease from limbic regions to the neocortex: clinical, radiological and pathological relationships. Dement Geriatr Cogn Disord 1999;10(2):115–120. [DOI] [PubMed] [Google Scholar]
- 35.Bonthius DJ, Solodkin A, Van Hoesen GW. Pathology of the insular cortex in Alzheimer disease depends on cortical architecture. J Neuropathol Exp Neurol 2005;64(10):910–922. [DOI] [PubMed] [Google Scholar]
- 36.Karow DS, McEvoy LK, Fennema-Notestine C, et al. Relative capability of MR imaging and FDG PET to depict changes associated with prodromal and early Alzheimer disease. Radiology 2010;256(3):932–942. [DOI] [PMC free article] [PubMed] [Google Scholar]
- 37.Fennema-Notestine C, Hagler DJ, McEvoy LK, et al. Structural MRI biomarkers for preclinical and mild Alzheimer’s disease. Hum Brain Mapp 2009;30(10):3238–3253. [DOI] [PMC free article] [PubMed] [Google Scholar]
- 38.Türe U, Yaşargil DC, Al-Mefty O, Yaşargil MG. Topographic anatomy of the insular region. J Neurosurg 1999;90(4):720–733. [DOI] [PubMed] [Google Scholar]
- 39.Craig AD. How do you feel? interoception: the sense of the physiological condition of the body. Nat Rev Neurosci 2002;3(8):655–666. [DOI] [PubMed] [Google Scholar]
- 40.Dupont S, Bouilleret V, Hasboun D, Semah F, Baulac M. Functional anatomy of the insula: new insights from imaging. Surg Radiol Anat 2003;25(2):113–119. [DOI] [PubMed] [Google Scholar]
- 41.Taylor KS, Seminowicz DA, Davis KD. Two systems of resting state connectivity between the insula and cingulate cortex. Hum Brain Mapp 2009;30(9):2731–2745. [DOI] [PMC free article] [PubMed] [Google Scholar]
- 42.Foundas AL, Leonard CM, Mahoney SM, Agee OF, Heilman KM. Atrophy of the hippocampus, parietal cortex, and insula in Alzheimer’s disease: a volumetric magnetic resonance imaging study. Neuropsychiatry Neuropsychol Behav Neurol 1997;10(2):81–89. [PubMed] [Google Scholar]
- 43.Karas GB, Burton EJ, Rombouts SA, et al. A comprehensive study of gray matter loss in patients with Alzheimer’s disease using optimized voxel-based morphometry. Neuroimage 2003;18(4):895–907. [DOI] [PubMed] [Google Scholar]
- 44.Rombouts SA, Barkhof F, Witter MP, Scheltens P. Unbiased whole-brain analysis of gray matter loss in Alzheimer’s disease. Neurosci Lett 2000;285(3):231–233. [DOI] [PubMed] [Google Scholar]
- 45.Grignon Y, Duyckaerts C, Bennecib M, Hauw JJ. Cytoarchitectonic alterations in the supramarginal gyrus of late onset Alzheimer’s disease. Acta Neuropathol (Berl) 1998;95(4):395–406. [DOI] [PubMed] [Google Scholar]
- 46.Baron JC, Chételat G, Desgranges B, et al. In vivo mapping of gray matter loss with voxel-based morphometry in mild Alzheimer’s disease. Neuroimage 2001;14(2):298–309. [DOI] [PubMed] [Google Scholar]
- 47.Lerch JP, Pruessner JC, Zijdenbos A, Hampel H, Teipel SJ, Evans AC. Focal decline of cortical thickness in Alzheimer’s disease identified by computational neuroanatomy. Cereb Cortex 2005;15(7):995–1001. [DOI] [PubMed] [Google Scholar]
- 48.Farlow MR, Lahiri DK, Poirier J, Davignon J, Hui S. Apolipoprotein E genotype and gender influence response to tacrine therapy. Ann N Y Acad Sci 1996;802:101–110. [DOI] [PubMed] [Google Scholar]
- 49.Risner ME, Saunders AM, Altman JF, et al. Efficacy of rosiglitazone in a genetically defined population with mild-to-moderate Alzheimer’s disease. Pharmacogenomics J 2006;6(4):246–254. [DOI] [PubMed] [Google Scholar]
- 50.Farlow MR, Lahiri DK, Poirier J, Davignon J, Schneider L, Hui SL. Treatment outcome of tacrine therapy depends on apolipoprotein genotype and gender of the subjects with Alzheimer’s disease. Neurology 1998;50(3):669–677. [DOI] [PubMed] [Google Scholar]
- 51.Tapiola T, Pirttilä T, Mikkonen M, et al. Three-year follow-up of cerebrospinal fluid tau, beta-amyloid 42 and 40 concentrations in Alzheimer’s disease. Neurosci Lett 2000;280(2):119–122. [DOI] [PubMed] [Google Scholar]
- 52.Galasko D, Chang L, Motter R, et al. High cerebrospinal fluid tau and low amyloid beta42 levels in the clinical diagnosis of Alzheimer disease and relation to apolipoprotein E genotype. Arch Neurol 1998;55(7):937–945. [DOI] [PubMed] [Google Scholar]
Associated Data
This section collects any data citations, data availability statements, or supplementary materials included in this article.