Abstract
Purpose
To assess the accuracy of glomerular filtration rate (GFR) measurements obtained with low–contrast agent dose dynamic contrast material–enhanced magnetic resonance (MR) renography in patients with liver cirrhosis who underwent routine liver MR imaging, with urinary clearance of technetium 99m (99mTc) pentetic acid (DTPA) as the reference standard.
Materials and Methods
This HIPAA-compliant study was institutional review board approved. Written informed patient consent was obtained. Twenty patients with cirrhosis (14 men, six women; age range, 41–70 years; mean age, 54.6 years) who were scheduled for routine 1.5-T liver MR examinations to screen for hepatocellular carcinoma during a 6-month period were prospectively included. Five-minute MR renography with a 3-mL dose of gadoteridol was performed instead of a routine test-dose timing examination. The GFR was estimated at MR imaging with use of two kinetic models. In one model, only the signal intensities in the aorta and kidney parenchyma were considered, and in the other, renal cortical and medullary signal intensities were treated separately. The GFR was also calculated by using serum creatinine levels according to the Cockcroft-Gault and modification of diet in renal disease (MDRD) formulas. All patients underwent a 99mTc-DTPA urinary clearance examination on the same day to obtain a reference GFR measurement. The accuracies of all MR- and creatinine-based GFR estimations were compared by using Wilcoxon signed rank tests.
Results
The mean reference GFR, based on 99mTc-DTPA clearance, was 74.9 mL/min/1.73 m2 ± 27.7 (standard deviation) (range, 10.3–120.7 mL/min/1.73 m2). With both kinetic models, 95% of MR-based GFRs were within 30% of the reference values, whereas only 40% and 60% of Cockcroft-Gault– and MDRD-based GFRs, respectively, were within this range. MR-based GFR estimates were significantly more accurate than creatinine level–based estimates (P < .001).
Conclusion
GFR assessment with MR imaging, which outperformed the Cockcroft-Gault and MDRD formulas, adds less than 10 minutes of table time to a clinically indicated liver MR examination without ionizing radiation.
© RSNA, 2011
Supplemental material: http://radiology.rsna.org/lookup/suppl/doi:10.1148/radiol.11101338/-/DC1
Introduction
The glomerular filtration rate (GFR) is an important factor in tailoring drug regimens and monitoring patients with liver cirrhosis. Because there is considerable evidence of altered renal function in these patients (1,2), the model for end-stage liver disease, or MELD, score, which is widely used to predict the likelihood of death within 3 months without liver transplantation, includes the serum creatinine value. This score is used for prioritization of transplant recipients in the United States (3). However, investigators in several studies have pointed out the problems with the current techniques for assessing renal function in patients with cirrhosis (4–6). Many conditions associated with liver disease (decreased muscle mass, anorexia, protein-restricted diet, hyperbilirubinemia, decreased hepatic creatine synthesis, increased tubular creatinine secretion, and abnormal fluid status) contribute to misleadingly low serum creatinine concentrations, even in the presence of moderate to severe renal impairment. This explains why normal or low creatinine values can be measured in patients with cirrhosis who have end-stage renal disease (7). The GFR is routinely estimated by using two creatinine level–based formulas: the Cockcroft-Gault formula (8) and the modification of diet in renal disease (MDRD) formula (9). Neither of these formulas is accurate in patients with cirrhosis, leading to overestimations of the true GFR (4–6).
More accurate methods of assessing the GFR in patients with cirrhosis are based on the urinary clearance of exogenous substances that are filtered solely at the glomeruli, such as inulin and radioactive tracers (10,11). These techniques are cumbersome and time consuming, however, and thus are not used in routine clinical practice.
Many patients with cirrhosis routinely undergo imaging, typically magnetic resonance (MR) imaging or computed tomography, to screen for hepatocellular carcinoma, for which they are at high risk. Recent advances in MR renography (12,13) enable radiologists to estimate the GFR in a few minutes by using a low dose of a gadolinium-based contrast agent (GBCA) (14). Therefore, we hypothesized that during routine liver MR imaging, low-dose MR renography could be performed to assess the GFR without a substantial increase in time or resources. Our goal in this prospective study was to assess the accuracy of GFR measurements obtained by using dynamic low-dose contrast material–enhanced MR renography in patients with cirrhosis who underwent routine liver MR imaging, with urinary clearance of technetium 99m (99mTc) pentetic acid (DTPA) as the reference standard.
Materials and Methods
Patients
Between April 2009 and September 2009, all patients with cirrhosis who were on a transplant list and were referred from the NYU Langone Medical Center Transplant Clinic for routine liver MR imaging were invited to participate in this study. Exclusion criteria included an MDRD-based GFR lower than 15 mL/min/1.73 m2, dialysis treatment, and pregnancy. Twenty consecutive patients with cirrhosis were enrolled. This Health Insurance Portability and Accountability Act–compliant study was approved by our institutional review board, and written informed consent was obtained from all patients.
The severity of liver disease was assessed by using Child-Pugh class (15) and model for end-stage liver disease scores (16,17). All patients underwent an MR examination that included MR renography and liver MR imaging, as well as a radionuclide clearance study on the same day to determine reference GFRs.
MR Imaging
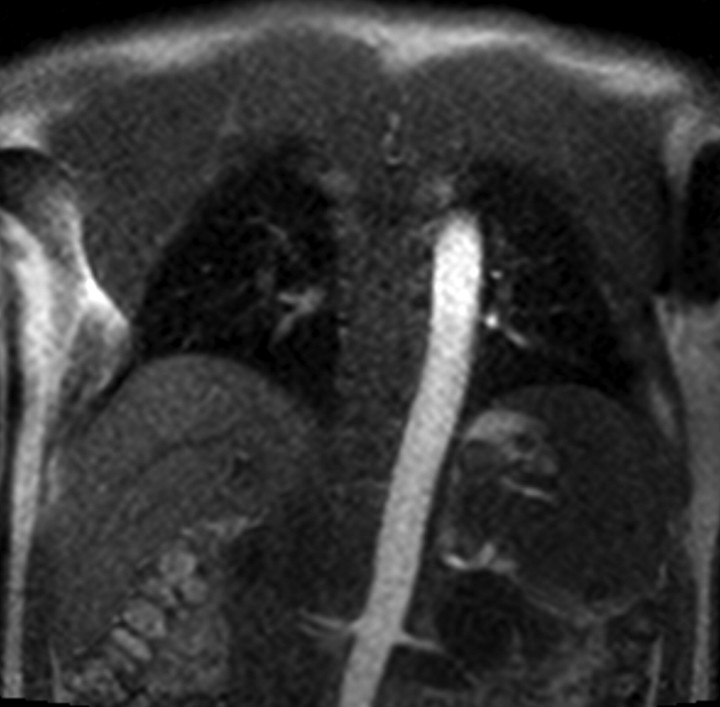
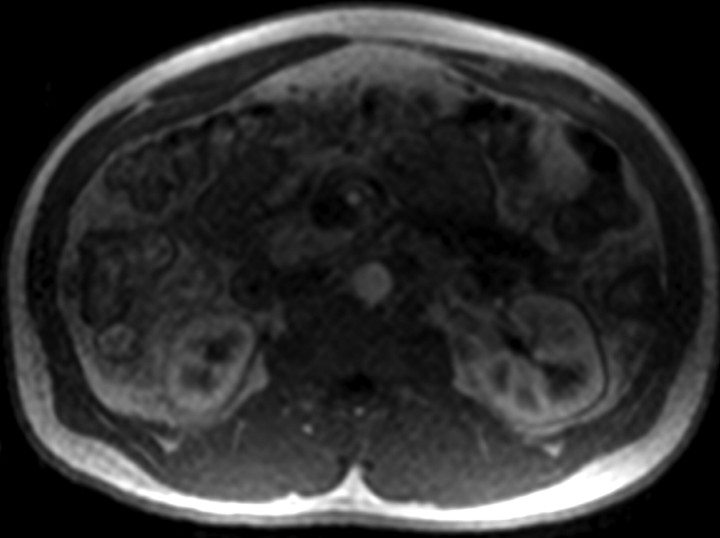
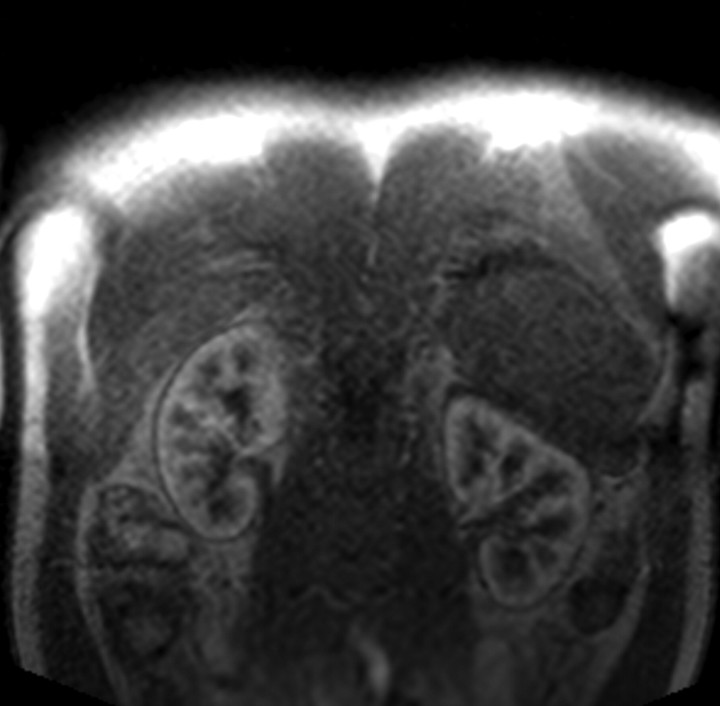
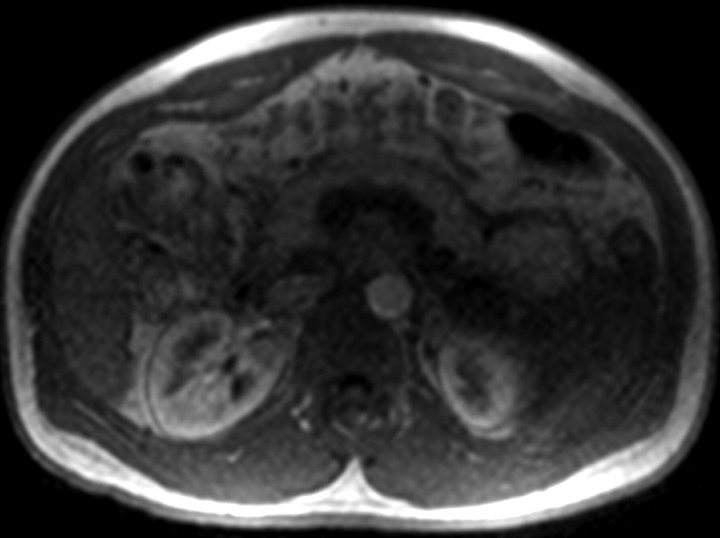
MR imaging was performed at 1.5 T (Avanto; Siemens Medical Solutions, Erlangen, Germany). We followed a standard protocol for contrast-enhanced liver MR imaging (Table 1). For GFR assessment, the MR renographic sequence involved a nonselective saturation-recovery prepulse followed by a centrically ordered low-flip-angle gradient-echo (ie, saturation-recovery turbo fast low-angle shot) readout. Four sections were prescribed (Fig 1): one coronal section through the aorta to measure the arterial input function, one coronal section through the long axis of both kidneys, and two axial sections—one each through the middle of each kidney. To enable conversion of the signal intensities to T1 values, the same sequence was performed before the contrast agent injection without the saturation prepulse and with a long repetition time to obtain a set of proton-density–weighted images. This provided an estimate of the asymptote of the signal recovery curve.
Table 1.
MR Parameters Used for GFR Measurement and Routine Liver Imaging
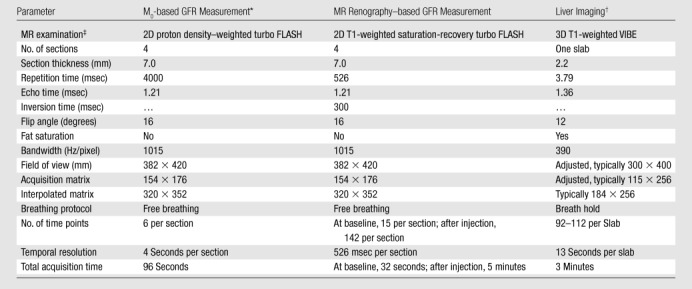
M0 = asymptote of the signal recovery.
Routine dynamic contrast-enhanced liver MR imaging. VIBE = volumetric interpolated breath-hold examination (a fat-suppressed interpolated gradient-echo sequence).
All three MR examinations were performed with a spoiled gradient-echo sequence by using a generalized autocalibrating partially parallel acquisition factor of two and one acquired signal. FLASH = fast low-angle shot, 3D = three-dimensional, 2D = two-dimensional.
Figure 1a:
Four MR renographic sections obtained during arterial phase after injection of 3 mL of gadoteridol: (a) coronal section through aorta, (b) axial section through middle portion of right kidney, (c) coronal section through long axis of both kidneys, and (d) axial section through middle portion of left kidney are shown.
Figure 1b:
Four MR renographic sections obtained during arterial phase after injection of 3 mL of gadoteridol: (a) coronal section through aorta, (b) axial section through middle portion of right kidney, (c) coronal section through long axis of both kidneys, and (d) axial section through middle portion of left kidney are shown.
Figure 1c:
Four MR renographic sections obtained during arterial phase after injection of 3 mL of gadoteridol: (a) coronal section through aorta, (b) axial section through middle portion of right kidney, (c) coronal section through long axis of both kidneys, and (d) axial section through middle portion of left kidney are shown.
Figure 1d:
Four MR renographic sections obtained during arterial phase after injection of 3 mL of gadoteridol: (a) coronal section through aorta, (b) axial section through middle portion of right kidney, (c) coronal section through long axis of both kidneys, and (d) axial section through middle portion of left kidney are shown.
The temporal resolution of the saturation-recovery renography sequence was 2.1 seconds for each set of four images. Fifteen image sets were acquired before the contrast agent injection to obtain an accurate baseline measurement. Contrast-enhanced MR renography was performed after the intravenous injection of 3 mL of gadoteridol (ProHance; Bracco Diagnostics, Milan, Italy), which was administered at a rate of 2 mL/min and followed by a 20-mL saline flush at the same rate. The renographic sequence (with the four-image set) was continued for 5 minutes after the contrast agent injection. Patients were instructed to breath normally during the acquisition.
After the renographic acquisition, standard three-dimensional dynamic contrast-enhanced MR imaging of the liver was performed at four phases (arterial phase; then arteriovenous, portal venous, and delayed phases 5, 60, and 180 seconds, respectively, after the end of the arterial acquisition) with breath holding after the injection of 0.1 mmol of gadoteridol per kilogram of body weight (maximal dose, 20 mL) at 2 mL/sec and a saline flush. The three-dimensional slab was prescribed to include the kidneys. This allowed accurate measurements of the cortical and medullary volumes to be obtained from the three-dimensional images acquired during the arterial phase acquisition. The optimal timing to launch the dynamic contrast-enhanced sequence for arterial phase imaging was determined from the renographic image findings.
MR Image Postprocessing
All MR images were processed off line independently by three observers (P.H.V., A.Y., K.T., 6, 12, and 0 years of experience in abdominal imaging, respectively) who were blinded to the other GFR measurements. Kidney volume measurements and renographic image data were processed separately. Medulla and cortex volumes were measured on the arterial phase three-dimensional dynamic contrast-enhanced images by using a validated segmentation algorithm based on graph cuts (18).
For renographic analysis, all (proton-density–weighted and renographic) MR images corresponding to each of the four sections were gathered and processed at the same time with the same regions of interest (ROIs) by using ImageJ MR Urography Plugin software (Rouen University, Rouen, France) (19). The axial images required little or no registration. The coronal images were manually registered. The boundaries of the kidneys were drawn on one frame (reference frame) that represented the most common position of the kidney during the respiratory cycle. Then, all other frames were translated to align the renal boundaries as much as possible with the mask drawn of the reference frame. ROIs were drawn (Fig 2) (a) over the aorta at the level of the renal arteries on the coronal section (typically 150 analyzed pixels, 215 mm2); (b) over the kidney parenchyma on the axial (650–800 analyzed pixels, 930–1150 mm2) and coronal (1400–1800 analyzed pixels, 2000–2600 mm2) images; (c) over the cortex on the axial images (150–170 analyzed pixels, 215–245 mm2), with ROIs placed over the paravertebral cortex because regions drawn in this location required minimal adjustment for respiratory motion; and (d) over the medulla on the coronal images, with two to four ROIs drawn on each kidney (30–80 pixels per ROI, 45–115 mm2).
Figure 2a:
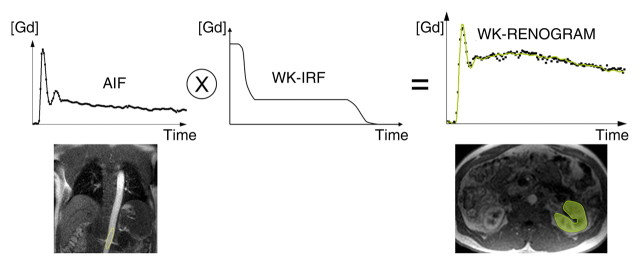
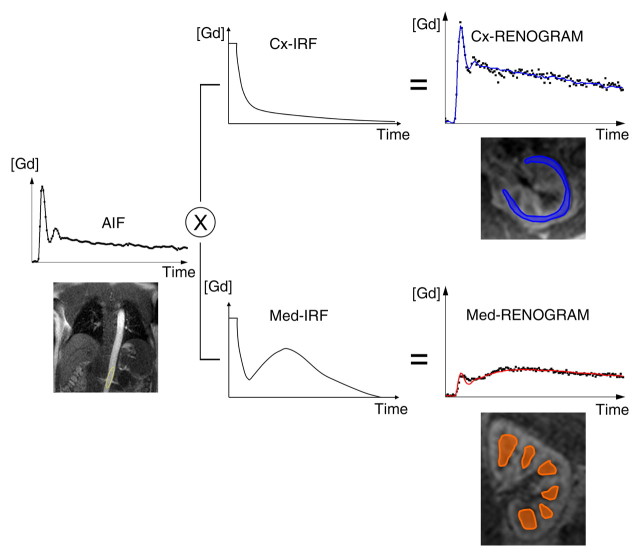
Diagram illustrates two models used to calculate GFR from MR GBCA (Gd) concentration curves. (a) With MR whole-kidney (WK) model, arterial input function (AIF) (ie, GBCA-concentration in aorta) is convolved by using impulse retention function (IRF) of whole-kidney parenchyma to fit whole-kidney parenchymal renogram. The best fit determines the values of the unknown parameters of the IRF, one of which is the GFR. (b) With MR corticomedullary model, arterial input function is convolved by a cortical (Cx) IRF and a medullary (Med) IRF, which are then fitted to the cortex and medulla renograms, respectively.
Figure 2b:
Diagram illustrates two models used to calculate GFR from MR GBCA (Gd) concentration curves. (a) With MR whole-kidney (WK) model, arterial input function (AIF) (ie, GBCA-concentration in aorta) is convolved by using impulse retention function (IRF) of whole-kidney parenchyma to fit whole-kidney parenchymal renogram. The best fit determines the values of the unknown parameters of the IRF, one of which is the GFR. (b) With MR corticomedullary model, arterial input function is convolved by a cortical (Cx) IRF and a medullary (Med) IRF, which are then fitted to the cortex and medulla renograms, respectively.
The signal intensity of the medulla could not be reliably measured on the axial images owing to respiratory motion. Similarly, the signal intensity of the cortex only was not measured on coronal images because of errors introduced by partial volume effects, through-plane motion, and misregistration. The observers were asked to estimate the time spent for postprocessing because the postprocessing duration was not precisely recorded and the reported times were based on the observers’ statements.
MR-based GFR Calculations
To measure the GFR with MR imaging, signal intensities were measured on the renographic images and converted first to T1 values and then to gadoteridol concentrations. To convert signal intensities to T1 values, the asymptote of the signal recovery (M0) was measured from ROIs drawn on the baseline proton-density–weighted images. T1 values were then calculated from the measured signal intensities by using the saturation-recovery turbo fast low-angle shot sequence formula: SI(t) = M0 × (1 − e−TI/T1(t)), where SI is the signal intensity and SI(t) was measured by using ROIs on the renographic images at the time t, M0 was the signal intensity measured by using the same ROIs on the proton-density–weighted images, and the inversion (or saturation) time (TI) was 300 msec.
T1 values were then converted to gadoteridol concentrations by using the following equation: 1/T1(t) = 1/T10 + r1 ⋅ C(t), where T10 is the T1 at baseline, r1 is the known specific relaxivity of gadoteridol (4.1 L ⋅ mmol−1 ⋅ sec−1 [20]), and C(t) is the concentration of gadoteridol at time t.
To calculate the GFR, we used an IRF compartmental model approach. An IRF is a function giving the probability that a molecule (ie, impulse input) that entered a compartment at time 0 is still in the compartment at time t. Convolving the IRF of the kidney parenchyma with its arterial input function (measured as the GBCA concentration in the aorta) yields the GBCA concentration-time curve in the parenchyma, or the renogram. Depending on the complexity of the kinetic model, a variable number of IRF parameters need to be fitted (such as GFR, renal plasma flow, and transit time) to match the model curve with the measured data.
We tested two kinetic models for calculating the GFR (Fig 2, Appendix E1 [online]): The first model, the MR whole-kidney model, involved the use of a single IRF to characterize the signal intensity of the whole-kidney parenchyma, with the signal intensities of the cortex and medulla combined (21). This calculation was performed separately by using axial and coronal MR imaging. The second model, the MR corticomedullary model, involved the use of two IRFs to characterize the signal intensities of the cortex and medulla separately, with the IRFs for the cortex and medulla fitted to cortical and medullary concentration-time curves, respectively (13). Hence, for each subject, three MR-based GFR estimates were determined. Details about the two kinetic models are provided in Appendix E1 (online).
The IRF parameters were adjusted by means of least squares fitting with the Levenberg-Marquardt algorithm in the Matlab program (MathWorks, Natick, Mass) to minimize the residual difference between the convoluted IRF curves and the measured GBCA concentration curves. The GFR was fitted for each kidney separately. The MR-based GFR was then computed as the sum of the left and right single-kidney GFRs.
Reference GFR Calculation
For all subjects, a reference GFR (GFRR) was derived from the urinary clearance of 99mTc-DTPA, which was tested on the same day that MR renography was performed. After an intravenous bolus injection of 5 mCi (185 MBq) 99mTc-DTPA and a 1-hour equilibrium period, two 90-minute urine samples were collected—at 150 and 240 minutes after the injection. Blood samples were collected 60, 150, and 240 minutes after the injection. Urinary clearance was computed as follows: GFRR = (U · V)/P, where U is the counts per minute per milliliter of urine sample, V is the urine flow rate in milliliters per minute, and P is the log average of counts per minute in serum samples bracketing each urine collection (11,22). The reference GFR was defined as the average of the two measurements (at 150 and 240 minutes).
Effect of MR Renography Contrast on Liver MR Imaging
For the MR renography protocol, we used a 3-mL dose of GBCA on the basis of protocols in prior optimization studies (23). During routine liver MR examinations, our standard of care is to use 1 mL of contrast material for a timing bolus. Because the timing bolus test was replaced with the MR renographic examination, we also assessed the effect of the slightly larger 3-mL dose, as compared with our standard timing bolus dose, on the diagnostic quality of the subsequently performed dynamic contrast-enhanced liver imaging examination. For this portion of the study, 40 consecutive control subjects recruited from the same initial population of patients with cirrhosis as our study patients were examined and were imaged by using our regular liver protocol only. This included a timing bolus examination with 1 mL of gadopentetate dimeglumine (Magnevist; Bayer Healthcare, Wayne, NJ) performed before the injection of the full dose (0.1 mmol/kg with maximal dose of 20 mL). The institutional review board waived the requirement of informed consent for the control patients.
One radiologist (R.P.L., 9 years of experience in abdominal imaging), who was not involved in the MR-based GFR evaluation, analyzed the liver images obtained in the 20 patients enrolled in our study and in the 40 control patients. This observer was blinded to patient identities and the control or study patient classification.
Image analysis entailed drawing ROIs in the common hepatic artery before dividing this vessel and in the liver parenchyma lateral to the hepatic artery on the same section. The analysis was performed by using three-dimensional contrast-enhanced arterial phase images. The hepatic artery signal intensity (8–25 pixels per ROI, 20–60 mm2) was divided by the liver signal intensity (250–300 pixels per ROI, 600–750 mm2), and the resultant quotient was defined as the contrast ratio.
Laboratory Tests
Standardized serum creatinine, albumin, and bilirubin levels, and the international normalized ratio were measured the day of the MR examinations. The creatinine level–based GFR was calculated by using the Cockcroft-Gault (8) and MDRD (24) formulas. All GFR results were expressed in milliliters per minute per 1.73 m2.
Statistical Analyses
The accuracy of the GFR estimates was summarized as the median difference (bias) and the root mean square error between the GFR estimates and the reference GFRs. Agreement between the calculated and reference GFRs was assessed in terms of concordance correlation coefficients (25). The MR-based and creatinine level–based GFR estimates were compared in terms of the absolute error (difference between reference and calculated GFRs) by using the Wilcoxon signed rank test. For this purpose, the MR-based GFRs determined by the three observers were averaged. According to the National Kidney Foundation guidelines (26), accuracy was also reported in terms of the percentage of GFR estimates that fell within 10%, 30%, and 50% above or below the measured GFR.
With use of separate MR data from the three readers, the interobserver reproducibility of the MR estimates was assessed in terms of intraclass correlation coefficients and within-patient coefficients of variation. A likelihood ratio test in the context of mixed-model regression was performed to compare the MR-based and reference GFRs in terms of within-subject coefficients of variation. For this comparison, the GFRs were standardized to have a unit mean and a standard deviation equal to the coefficient of variation for the relevant method; each observed value was divided by its respective mean.
Analysis of variance was used to compare the patients with Child-Pugh class A, B, or C cirrhosis in terms of reference GFRs and errors in creatinine level– and MR-based GFR estimates. For this purpose, the MR-based GFRs of the three observers were averaged. To eliminate the unnecessary assumption of variance homogeneity, the error variance was allowed to differ across patient groups. For each measure, two analyses were conducted: one with the observed data used as the dependent variable and the other with the ranks of the observed data used. The analysis based on ranks was performed to confirm that significant findings were not a spurious consequence of outliers in the data.
To assess the effect of MR renography (with 3 mL of gadoteridol) on subsequently performed arterial phase contrast-enhanced liver MR imaging, contrast ratios on the liver images obtained in the study and control patients were compared by using the exact Mann-Whitney test. All reported P values were two-sided. P < .05 indicated statistical significance. SAS, version 9.0 (SAS Institute, Cary, NC), was used to perform all statistical computations.
Results
The mean reference GFR was 74.9 mL/min/1.73 m2 ± 27.7 (standard deviation) (range, 10.3–120.7). Six of the 20 patients had Child-Pugh class A, 11 had Child-Pugh class B, and three had Child-Pugh class C cirrhosis (Table 2).
Table 2.
Patient Characteristics
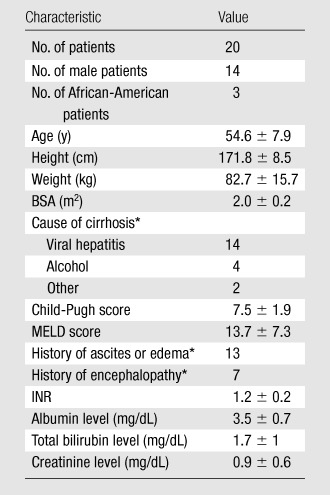
Note.—Unless otherwise noted, data are means ± standard deviations. BSA = body surface area, INR = international normalized ratio, MELD = model for end-stage liver disease.
Data are numbers of patients.
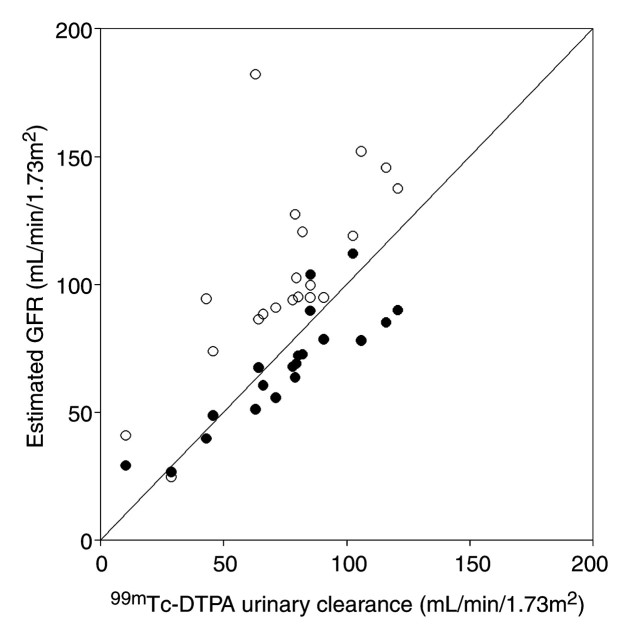
The median difference between the MR-based GFR estimates and the reference values ranged between −4.1 and −7.7 mL/min/1.73 m2 (Table 3). The GFRs estimated by using the Cockcroft-Gault and MDRD formulas exceeded the reference GFRs by median differences of 27.4 and 17.5 mL/min/1.73 m2, respectively (Fig 3).
Table 3.
Accuracy of GFR Estimation Methods and Correlations with Reference GFR

Note.—Median difference and root mean square error (RMSE, difference between estimated and reference GFRs) are expressed in milliliters per minute per 1.73 square meters. MR-CM = MR corticomedullary, MR-WK = MR whole-kidney, R2 = coefficient of determination.
Data are the percentages of estimated GFRs, derived by using the given methods, that were within plus or minus 10%, 30%, or 50% of the reference GFRs.
Numbers in parentheses are 95% confidence intervals.
Figure 3:
Graph illustrates MDRD-based and axial MR whole-kidney GFRs versus reference GFRs. Line indicates line of equality. MR-based GFRs are significantly more accurate than MDRD-based GFRs (P < .001). ● = Axial MR whole-kidney GFR. ○ = MDRD-based GFR.
Ninety-five percent of the MR-based GFRs estimated by using both of the kinetic models (MR whole-kidney and MR corticomedullary models) were within 30% of the true values. Only 40% and 60% of the values calculated by using the Cockcroft-Gault and MDRD formulas were within this range. Regardless of the error measures used, all MR-based GFR estimators were more accurate than the creatinine level–based formulas (P < .001 for each comparison). Reference GFR was poorly but significantly and inversely correlated with Child-Pugh score (R2 = 0.24, P = .03). Mean reference GFRs in the Child-Pugh class A, B, and C cirrhosis groups were 90.3 mL/min/1.73 m2 ± 18.1, 76.2 mL/min/1.73 m2 ± 22.8, and 39.4 mL/min/1.73 m2 ± 35.6, respectively, with values in the Child-Pugh class A group being significantly different from those in the Child-Pugh class C group (P < .04). Errors in the GFR measurements obtained by using creatinine level– and MR-based estimators were not significantly correlated with Child-Pugh score (P > .10).
Intraclass correlation coefficients for the interobserver reproducibility of all MR-based GFR estimates ranged between 0.94 and 0.96, and coefficients of variation ranged between 7.4 and 8.8. MR-based GFR estimates were not significantly different from each other in terms of coefficients of variation (P > .35).
Other MR Parameters
In the study patients, mean precontrast baseline T1 values were 924 msec ± 145, 1306 msec ± 215, and 1394 msec ± 124 for the cortex, medulla, and blood, respectively.
Volume measurements, including those obtained by using registration and segmentation of the cortex and medulla, required about 30 minutes per kidney. Postprocessing of renographic images required 45 minutes per kidney, mainly because of the need for manual registration of the coronal images. Postprocessing for the axial whole-kidney model alone required approximately 2–5 minutes per kidney.
Effect of MR Renography Contrast on Liver MR Imaging
The mean contrast ratio for the arterial phase dynamic contrast-enhanced images in the study patients, who received 3 mL of gadoteridol for MR renography, was 1.91 ± 0.51 (standard deviation) compared with 1.97 ± 0.45 in the control patients, who received 1 mL of gadopentetate dimeglumine for test bolus timing (P = .54).
Discussion
Accurate GFR assessment is of utmost importance in patients with cirrhosis, not only because these individuals are prone to having renal insufficiency but also because the GFR is a major prognostic factor that influences both the priority status for hepatic transplantation and the decision to perform combined liver-kidney transplantation (27). Because it requires less than 10 minutes of imaging time without radiation exposure, GFR determination during routine liver MR imaging may improve the clinical management of patients with cirrhosis.
In our series of 20 patients, MR-based GFR measurements proved to be feasible in patients with cirrhosis and required less than 10 minutes of added table time. When urinary clearance of 99mTc-DTPA was used as the reference-standard method for GFR measurement, all MR-based GFR estimation methods were significantly more accurate than the Cockcroft-Gault and MDRD methods, yielding an almost threefold reduction in the root mean square error. Use of the Cockcroft-Gault and MDRD formulas led to dramatically overestimated reference GFRs—by 27.4 and 17.5 mL/min/1.73 m2 (median difference), respectively. Our results are in agreement with those of Skluzacek et al (11), with whom the true GFR was overestimated by 30.1 and 18.7 mL/min/1.73 m2 with use of the Cockcroft-Gault and MDRD formulas, respectively, in 19 patients with cirrhosis of a more advanced stage compared with the cirrhosis stages of our subjects (Child-Pugh scores 9.4 vs 7.5). The three MR-based GFR estimators compared yielded similar root mean square errors. The axial MR whole-kidney model rendered the smallest bias, with a median difference relative to the reference GFR of −4.1 mL/min/1.73 m2. The MR-based GFR also appeared to be precise. Our interobserver study yielded good reproducibility.
We used the urinary clearance of 99mTc-DTPA as the reference-standard technique for GFR measurement. Urinary clearance has been shown to outperform plasma clearance because of the extrarenal clearance of tracer into ascites and/or edema (10,11). However, despite being the preferred method for patients with cirrhosis, urinary clearance depends on accurate urine sample collections. Moreover, urinary clearance of radioactive tracers or inulin is cumbersome and expensive and thus is rarely performed. In contrast, MR imaging is often performed in patients with cirrhosis who are scheduled for transplantation. MR-based GFR assessment does not require any urine flow measurement, and the calculations are not affected by extrarenal clearance. Moreover, MR-based GFR assessment yields separate estimates of right and left single-kidney function.
Postprocessing with use of the MR whole-kidney model is fast and straightforward because the cortex and medulla do not require separate segmentations. Axial images have an advantage over coronal images: They do not require substantial registration. For these reasons, the whole-kidney model applied to axial data may be preferable.
Our GFR measurement method depends on accurate measurements of T1 for conversion of measured signal intensities to GBCA concentrations. With use of our separate proton-density–weighted measurements, our baseline T1 values were in agreement with those for the cortex (966 msec ± 58 [28], 882 msec ± 59 [29]), medulla (1412 msec ± 58 [28], 1163 msec ± 118 [29]), and blood (1318 msec ± 76 [30], 1434 msec ± 48 [31]) at 1.5 T cited in the literature.
Our MR renographic protocol requires an additional 5 1/2 minutes (postprocessing time of 35–75 minutes per kidney, depending on the model used) and a GBCA dose that is only slightly more than the 1–2 mL commonly used as a test bolus for timing examinations. In our protocol, the overall dose of GBCA was kept lower than or equal to 23 mL for the overall examination. To address the concern that a dose of 3 mL for MR renography might interfere with subsequent liver imaging, we compared the hepatic arterial enhancement in our subjects with the enhancement in another group of patients with cirrhosis who received 1 mL GBCA for a timing examination and 14–19 mL for liver MR imaging. We used the hepatic arterial enhancement during the arterial phase as a surrogate for potential detectability of any arterially enhancing lesions such as hepatocellular carcinoma. The arterial phase contrast was almost identical across the two groups.
This study was limited in that we did not compare the actual detectability of the liver lesions between the two protocols in the same subjects. Another potential limitation was that our standard liver imaging protocol involves the use of gadopentetate dimeglumine, whereas we used gadoteridol for the patients who underwent MR renography. However, these two contrast agents have the same reported relaxivity at body temperature, 4.1 L ⋅ mmol−1 ⋅ sec−1 (20), and, thus, the results should not have been affected.
There is another potential downside to using GBCAs in patients with cirrhosis, particularly those with renal insufficiency. The use of GBCA in patients with chronic kidney disease may induce nephrogenic systemic fibrosis (32). With the institutional review board–approved protocol in our study, enrollment was restricted to those with an estimated GFR (according the MDRD method) greater than or equal to 15 mL/min/1.73 m2. In fact, based on the reference GFRs, one subject had a true GFR lower than 15 mL/min/1.73 m2, reflecting the inaccuracy of the MDRD estimation method. In this case, both the MDRD-based (40.8 mL/min/1.73 m2) and MR-based (32 mL/min/1.73 m2) estimation methods yielded overestimated GFRs. Gadoteridol was chosen because it is considered the safest of the five Food and Drug Administration–approved GBCAs (33,34). The macrocyclic structure of the ligand (HP-DO3A) of gadoteridol, as compared with the other agents, provides a high thermodynamic stability coefficient, minimizing the potential release of free toxic gadolinium.
The availability of new liver-specific contrast agents for liver MR imaging affords new opportunities for the improved diagnosis of liver abnormalities, including differentiation between metastatic disease and primary liver cancers (35). The role of these agents in the evaluation of patients with cirrhosis who are at risk of developing hepatocellular carcinoma is still not clear (36). Nevertheless, for agents that have substantial renal clearance, the proposed method may be adapted to enable the estimation of GFR; this is an area of future research.
Although we examined only 20 patients, a wide range of GFRs were measured in these subjects (10.3–120.7 mL/min/1.73 m2). The patients also had different severities of liver cirrhosis. We found no significant differences in degrees of creatinine level–based GFR underestimation relative to reference GFRs across the Child-Pugh class groups. However, a larger study is needed to evaluate these subgroups more carefully.
MR renography yields accurate and precise measurements of GFR in patients with cirrhosis and significantly outperforms the Cockcroft-Gault and MDRD methods. MR renography adds less than 10 minutes of table time to a clinically indicated liver MR examination, requires an additional 1 or 2 mL of GBCA, and is performed by using commercially available sequences.
Advances in Knowledge.
-
•.
MR estimation of the glomerular filtration rate (GFR) can be performed during routine liver MR imaging in patients with cirrhosis by using low–contrast agent dose renography.
-
•.
MR-based GFR measurements are significantly more accurate (P < .001) than Cockcroft-Gault and modification of diet in renal disease (MDRD) GFR estimates in patients with cirrhosis; 95% of MR-based GFRs in the current study were within 30% of the reference values, whereas only 40% and 60% of the Cockcroft-Gault– and MDRD-based GFRs, respectively, were within this range.
Implication for Patient Care.
-
•.
Axial MR whole-kidney assessment of GFR (root mean square error, 12.9 mL/min/1.73 m2) in patients with cirrhosis, performed as an adjunct to routine liver MR examination, appears to yield better accuracy than does creatinine level–based Cockcroft-Gault GFR estimates (root mean square error, 34.9 mL/min/1.73 m2).
APPENDIX
Acknowledgments
We are grateful to Amy Piepsz, MD, PhD, for valuable advice about the nuclear medicine protocol. We also thank Evelyne Milan, nuclear medicine technologist, and David Stoffel, research coordinator, for their expert assistance.
Received July 20, 2010; revision requested August 23; revision received December 6; accepted December 14; final version accepted December 28.
Supported by a Fulbright grant and a Médaille d’Or des Hôpitaux de Rouen.
Disclosures of Potential Conflicts of Interest: P.H.V. No potential conflicts of interest to disclose. P.S. No potential conflicts of interest to disclose. H.R. No potential conflicts of interest to disclose. J.L.Z. No potential conflicts of interest to disclose. A.Y. No potential conflicts of interest to disclose. K.T. No potential conflicts of interest to disclose. U.K. No potential conflicts of interest to disclose. R.P.L. No potential conflicts of interest to disclose. J.S.B. No potential conflicts of interest to disclose. D.J. No potential conflicts of interest to disclose. L.W.T. No potential conflicts of interest to disclose. H.C. No potential conflicts of interest to disclose. K.F. No potential conflicts of interest to disclose. J.B. Financial activities related to the present article: none to disclose. Financial activities not related to the present article: received payment from Faulkner Law Firm for providing expert testimony. Other relationships: none to disclose.E.Y.S. No potential conflicts of interest to disclose. V.S.L. Financial activities related to the present article: none to disclose. Financial activities not related to the present article: patents are pending for co-inventions with Siemens. Other relationships: none to disclose.
Abbreviations:
- DTPA
- pentetic acid
- GBCA
- gadolinium-based contrast agent
- GFR
- glomerular filtration rate
- IRF
- impulse retention function
- MDRD
- modification of diet in renal disease
- ROI
- region of interest
References
- 1.Ginès P, Schrier RW. Renal failure in cirrhosis. N Engl J Med 2009;361(13):1279–1290. [DOI] [PubMed] [Google Scholar]
- 2.Mackelaite L, Alsauskas ZC, Ranganna K. Renal failure in patients with cirrhosis. Med Clin North Am 2009;93(4):855–869, viii. [DOI] [PubMed] [Google Scholar]
- 3.Wiesner R, Edwards E, Freeman R, et al. . Model for end-stage liver disease (MELD) and allocation of donor livers. Gastroenterology 2003;124(1):91–96. [DOI] [PubMed] [Google Scholar]
- 4.Caregaro L, Menon F, Angeli P, et al. . Limitations of serum creatinine level and creatinine clearance as filtration markers in cirrhosis. Arch Intern Med 1994;154(2):201–205. [PubMed] [Google Scholar]
- 5.Cholongitas E, Shusang V, Marelli L, et al. . Review article: renal function assessment in cirrhosis—difficulties and alternative measurements. Aliment Pharmacol Ther 2007;26(7):969–978. [DOI] [PubMed] [Google Scholar]
- 6.Sherman DS, Fish DN, Teitelbaum I. Assessing renal function in cirrhotic patients: problems and pitfalls. Am J Kidney Dis 2003;41(2):269–278. [DOI] [PubMed] [Google Scholar]
- 7.Papadakis MA, Arieff AI. Unpredictability of clinical evaluation of renal function in cirrhosis: prospective study. Am J Med 1987;82(5):945–952. [DOI] [PubMed] [Google Scholar]
- 8.Cockcroft DW, Gault MH. Prediction of creatinine clearance from serum creatinine. Nephron 1976;16(1):31–41. [DOI] [PubMed] [Google Scholar]
- 9.Levey AS, Bosch JP, Lewis JB, Greene T, Rogers N, Roth D. A more accurate method to estimate glomerular filtration rate from serum creatinine: a new prediction equation—Modification of Diet in Renal Disease Study Group. Ann Intern Med 1999;130(6):461–470. [DOI] [PubMed] [Google Scholar]
- 10.Henriksen JH, Brøchner-Mortensen J, Malchow-Møller A, Schlichting P. Over-estimation of glomerular filtration rate by single injection [51Cr]EDTA plasma clearance determination in patients with ascites. Scand J Clin Lab Invest 1980;40(3):279–284. [DOI] [PubMed] [Google Scholar]
- 11.Skluzacek PA, Szewc RG, Nolan CR, Riley DJ, Lee S, Pergola PE. Prediction of GFR in liver transplant candidates. Am J Kidney Dis 2003;42(6):1169–1176. [DOI] [PubMed] [Google Scholar]
- 12.Lee VS, Rusinek H, Johnson G, Rofsky NM, Krinsky GA, Weinreb JC. MR renography with low-dose gadopentetate dimeglumine: feasibility. Radiology 2001;221(2):371–379. [DOI] [PubMed] [Google Scholar]
- 13.Zhang JL, Rusinek H, Bokacheva L, et al. . Functional assessment of the kidney from magnetic resonance and computed tomography renography: impulse retention approach to a multicompartment model. Magn Reson Med 2008;59(2):278–288. [DOI] [PMC free article] [PubMed] [Google Scholar]
- 14.Teh HS, Ang ES, Wong WC, et al. . MR renography using a dynamic gradient-echo sequence and low-dose gadopentetate dimeglumine as an alternative to radionuclide renography. AJR Am J Roentgenol 2003;181(2):441–450. [DOI] [PubMed] [Google Scholar]
- 15.Pugh RN, Murray-Lyon IM, Dawson JL, Pietroni MC, Williams R. Transection of the oesophagus for bleeding oesophageal varices. Br J Surg 1973;60(8):646–649. [DOI] [PubMed] [Google Scholar]
- 16.MELD/PELD calculator. MELD/PELD Calculator Documentation Web site, 2009. http://optn.transplant.hrsa.gov/resources/MeldPeldCalculator.asp?index=97. Published January 28, 2009.
- 17.Olsen SK, Brown RS. Live donor liver transplantation: current status. Curr Gastroenterol Rep 2008;10(1):36–42. [DOI] [PubMed] [Google Scholar]
- 18.Rusinek H, Boykov Y, Kaur M, et al. . Performance of an automated segmentation algorithm for 3D MR renography. Magn Reson Med 2007;57(6):1159–1167. [DOI] [PubMed] [Google Scholar]
- 19.Vivier PH, Dolores M, Gardin I, Zhang P, Petitjean C, Dacher JN. In vitro assessment of a 3D segmentation algorithm based on the belief functions theory in calculating renal volumes by MRI. AJR Am J Roentgenol 2008;191(3):W127–W134. [DOI] [PubMed] [Google Scholar]
- 20.Rohrer M, Bauer H, Mintorovitch J, Requardt M, Weinmann HJ. Comparison of magnetic properties of MRI contrast media solutions at different magnetic field strengths. Invest Radiol 2005;40(11):715–724. [DOI] [PubMed] [Google Scholar]
- 21.Koh TS, Zhang JL, Ong CK, Shuter B. A biphasic parameter estimation method for quantitative analysis of dynamic renal scintigraphic data. Phys Med Biol 2006;51(11):2857–2870. [DOI] [PubMed] [Google Scholar]
- 22.Levey AS, Greene T, Schluchter MD, et al. . Glomerular filtration rate measurements in clinical trials: Modification of Diet in Renal Disease Study Group and the Diabetes Control and Complications Trial Research Group. J Am Soc Nephrol 1993;4(5):1159–1171. [DOI] [PMC free article] [PubMed] [Google Scholar]
- 23.Rusinek H, Lee VS, Johnson G. Optimal dose of Gd-DTPA in dynamic MR studies. Magn Reson Med 2001;46(2):312–316. [DOI] [PubMed] [Google Scholar]
- 24.Levey AS, Coresh J, Greene T, et al. . Expressing the Modification of Diet in Renal Disease Study equation for estimating glomerular filtration rate with standardized serum creatinine values. Clin Chem 2007;53(4):766–772. [DOI] [PubMed] [Google Scholar]
- 25.Lin LI. A concordance correlation coefficient to evaluate reproducibility. Biometrics 1989;45(1):255–268. [PubMed] [Google Scholar]
- 26.National Kidney Foundation. K/DOQI clinical practice guidelines for chronic kidney disease: evaluation, classification, and stratification. Am J Kidney Dis 2002;39(2 Suppl 1):S1–S266. [PubMed] [Google Scholar]
- 27.Pomfret EA, Fryer JP, Sima CS, Lake JR, Merion RM. Liver and intestine transplantation in the United States, 1996-2005. Am J Transplant 2007;7(5 Pt 2):1376–1389. [DOI] [PubMed] [Google Scholar]
- 28.de Bazelaire CM, Duhamel GD, Rofsky NM, Alsop DC. MR imaging relaxation times of abdominal and pelvic tissues measured in vivo at 3.0 T: preliminary results. Radiology 2004;230(3):652–659. [DOI] [PubMed] [Google Scholar]
- 29.Jones RA, Ries M, Moonen CT, Grenier N. Imaging the changes in renal T1 induced by the inhalation of pure oxygen: a feasibility study. Magn Reson Med 2002;47(4):728–735. [DOI] [PubMed] [Google Scholar]
- 30.Guo JY, Kim SE, Parker DL, Jeong EK, Zhang L, Roemer RB. Improved accuracy and consistency in T1 measurement of flowing blood by using inversion recovery GE-EPI. Med Phys 2005;32(4):1083–1093. [DOI] [PubMed] [Google Scholar]
- 31.Barth M, Moser E. Proton NMR relaxation times of human blood samples at 1.5 T and implications for functional MRI. Cell Mol Biol (Noisy-le-grand) 1997;43(5):783–791. [PubMed] [Google Scholar]
- 32.Grobner T. Gadolinium: a specific trigger for the development of nephrogenic fibrosing dermopathy and nephrogenic systemic fibrosis? Nephrol Dial Transplant 2006;21(4):1104–1108. [DOI] [PubMed] [Google Scholar]
- 33.Perazella MA. How should nephrologists approach gadolinium-based contrast imaging in patients with kidney disease? Clin J Am Soc Nephrol 2008;3(3):649–651. [DOI] [PubMed] [Google Scholar]
- 34.Reilly RF. Risk for nephrogenic systemic fibrosis with gadoteridol (ProHance) in patients who are on long-term hemodialysis. Clin J Am Soc Nephrol 2008;3(3):747–751. [DOI] [PMC free article] [PubMed] [Google Scholar]
- 35.Balci NC, Semelka RC. Contrast agents for MR imaging of the liver. Radiol Clin North Am 2005;43(5):887–898, viii. [DOI] [PubMed] [Google Scholar]
- 36.Bruix J, Sherman M. Management of hepatocellular carcinoma: an update. http://www.aasld.org/practiceguidelines/Documents/Bookmarked%20Practice%20Guidelines/HCCUpdate2010.pdf. Accessed July 28, 2010.
Associated Data
This section collects any data citations, data availability statements, or supplementary materials included in this article.


