Abstract
Purpose
To examine the relationships between breast cancer and both amount of fibroglandular tissue (FGT) and level of background parenchymal enhancement (BPE) at magnetic resonance (MR) imaging.
Materials and Methods
A waiver of authorization was granted by the institutional review board for this retrospective HIPAA-compliant study. Among 1275 women who underwent breast MR imaging screening between December 2002 and February 2008, 39 breast carcinoma cases were identified. Two comparisons were performed: In one comparison, two normal controls—those of the women with negative (benign) findings at breast MR imaging—were matched to each breast cancer case on the basis of age and date of MR imaging. In the second comparison, one false-positive control—that of a woman with suspicious but nonmalignant findings at MR imaging—was similarly matched to each breast cancer case. Two readers independently rated the level of MR imaging–depicted BPE and the amount of MR imaging–depicted FGT by using a categorical scale: BPE was categorized as minimal, mild, moderate, or marked, and FGT was categorized as fatty, scattered, heterogeneously dense, or dense.
Results
Compared with the odds ratio (OR) for a normal control, the OR for breast cancer increased significantly with increasing BPE: The ORs for moderate or marked BPE versus minimal or mild BPE were 10.1 (95% confidence interval [CI]: 2.9, 35.3; P < .001) and 3.3 (95% CI: 1.3, 8.3; P = .006) for readers 1 and 2, respectively. Similar odds were seen when the false-positive controls were compared with the breast cancer cases: The ORs for moderate or marked BPE versus minimal or mild BPE were 5.1 (95% CI: 1.4, 19.1; P = .005) and 3.7 (95% CI: 1.2, 11.2; P = .013) for readers 1 and 2, respectively. The breast cancer odds also increased with increasing FGT, but the BPE findings remained significant after adjustment for FGT.
Conclusion
Increased BPE is strongly predictive of breast cancer odds.
© RSNA, 2011
Introduction
The mammographic appearance of normal breast parenchyma has been shown to provide valuable information regarding breast cancer risk. A strong association between mammographic parenchymal pattern and breast cancer risk was proposed by Wolfe (1,2) in 1976 and since then has been validated by using qualitative and quantitative methods (1–11). Breast tissue consists primarily of fibroglandular tissue (FGT) and fat; at mammography, FGT is characterized as areas of breast tissue that are denser than fat. The risk of breast cancer increases steadily with increasing mammographic breast density (12). The risk of breast cancer in women with mammographically dense breasts is three to five times higher than that in women with predominantly mammographically fatty breasts (3,5,6,9,11,12).
Similar to breast density at mammography, the amount of FGT seen on magnetic resonance (MR) images and the level of background parenchymal enhancement (BPE) at MR imaging after contrast material administration are features of normal breast tissue. MR imaging–depicted FGT is distinguished from fat on the basis of differences in signal intensity. Some studies have shown that breast density at mammography correlates with FGT at MR imaging, and it has been suggested that since breast MR imaging is three-dimensional, it may enable a more accurate assessment of the amount of FGT (13–17). It has also been acknowledged that the volume of dense breast tissue, as a percentage of the total breast volume, might not be determined as accurately from two-dimensional mammograms (18). The level of MR imaging–depicted BPE refers qualitatively to the volume and intensity of the enhancement of normal breast tissue after intravenous contrast material administration (19). Evidence suggests that BPE correlates negatively with subject age and increases with greater hormonal activity (20–23). The findings of one study suggested that BPE does not correlate with mammographic breast density, although the results clearly showed that both of these parameters were reduced in postmenopausal women as compared with premenopausal women (24).
The strong relationship between mammographic breast density and breast cancer risk raises the question of whether there is a similar association between MR imaging FGT and breast cancer. Although MR imaging BPE is hormonally responsive, the association between increased BPE and breast cancer has not, to our knowledge, been tested. If increased BPE proves to be an important risk factor, then it has the potential to serve as an additional tool for risk stratification and may be useful for monitoring chemopreventive strategies. The purpose of this study was to examine the relationship between breast cancer and both MR imaging BPE and MR imaging FGT.
Materials and Methods
Study Design and Patients
A waiver of authorization and patient consent was granted by the institutional review board for this Health Insurance Portability and Accountability Act–compliant retrospective study. We performed a retrospective review of the radiology and pathology records of 1275 women with negative, benign, or suspicious findings at high-risk breast MR imaging screening between December 2002 and February 2008. All breast MR imaging findings were reported according to the level of suspicion of malignancy by using the American College of Radiology Breast Imaging Reporting and Data System (BI-RADS) lexicon (25). Patients with MR imaging findings classified as BI-RADS 4 or 5 lesions underwent biopsy. The biopsies of 39 of these patients yielded a malignancy (breast cancer cases).
From this cohort of 1275 patients, two sets of control subjects were randomly selected and individually matched to each breast cancer case on the basis of age within 5 years and date of breast MR imaging within 1 year. The first control group—the normal control group—was matched 2:1 to the breast cancer cases and consisted of women who had breast MR imaging findings reported as BI-RADS 1 or 2 levels of suspicion and no reported development of breast cancer subsequent to that MR imaging examination (through January 2010). The second control group—the false-positive control group—was matched 1:1 to the breast cancer cases and consisted of women who had breast MR imaging findings reported as BI-RADS 4 or 5 lesions but underwent biopsy and follow-up examinations that did not yield malignancy. The false-positive analysis was performed to control for potential bias due to the presence of a suspicious lesion in the breast. There was one case for which no matched false-positive control could be identified. Patient characteristics such as age, indication for breast MR imaging screening, and mammographic breast density (within the 6 months before the breast MR examination) were determined from the medical records.
MR Image Evaluation
All breast MR imaging screening examinations were performed at 1.5 T with the patient prone and by using a dedicated surface breast coil. The standard imaging protocol included a localizing MR sequence followed by a T2-weighted fat-suppressed sequence, a T1-weighted non–fat-suppressed sequence, and a bilateral T1-weighted simultaneous sagittal fat-suppressed sequence performed before and three times after a rapid bolus injection of 0.1 mmol/L gadopentetate dimeglumine (Magnevist; Bayer Health care Pharmaceuticals, Montville, NJ) per kilogram of body weight through an in-dwelling intravenous catheter. The MR acquisition parameters used are given in Table 1. The section thickness for all sequences was 3 mm. After the MR examination, the nonenhanced images were subtracted from the first acquired contrast material–enhanced images on a pixel-by-pixel basis.
Table 1.
Standard 1.5-T MR Imaging Protocols

Note.—TE = echo time, TR = repetition time.
Sagittal T1-weighted postcontrast fat-suppressed sequence was performed three times after the contrast material injection.
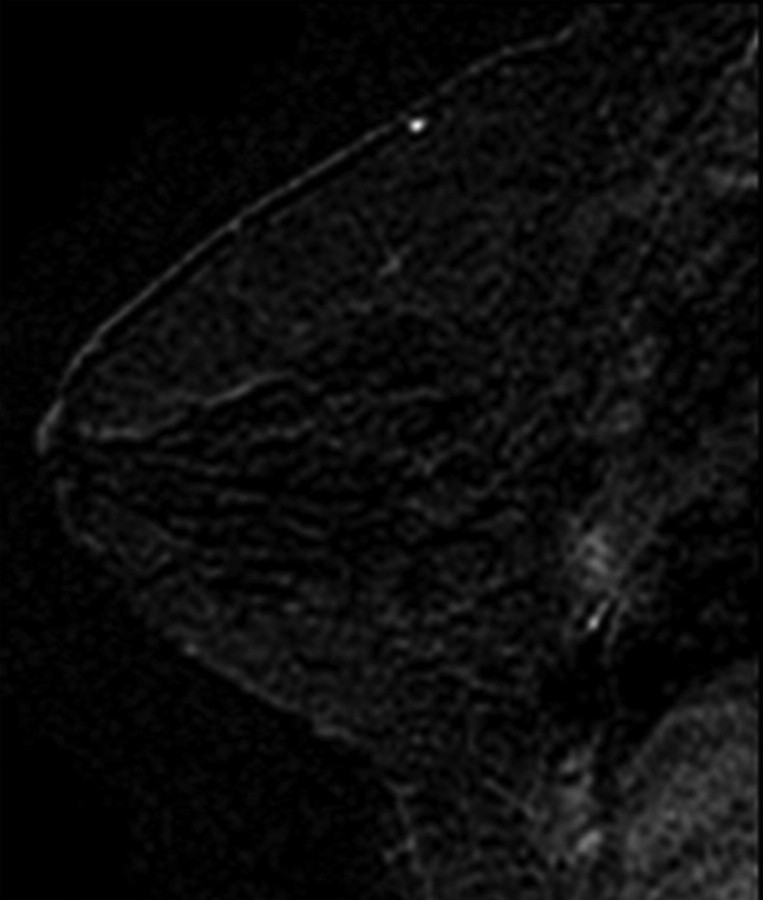
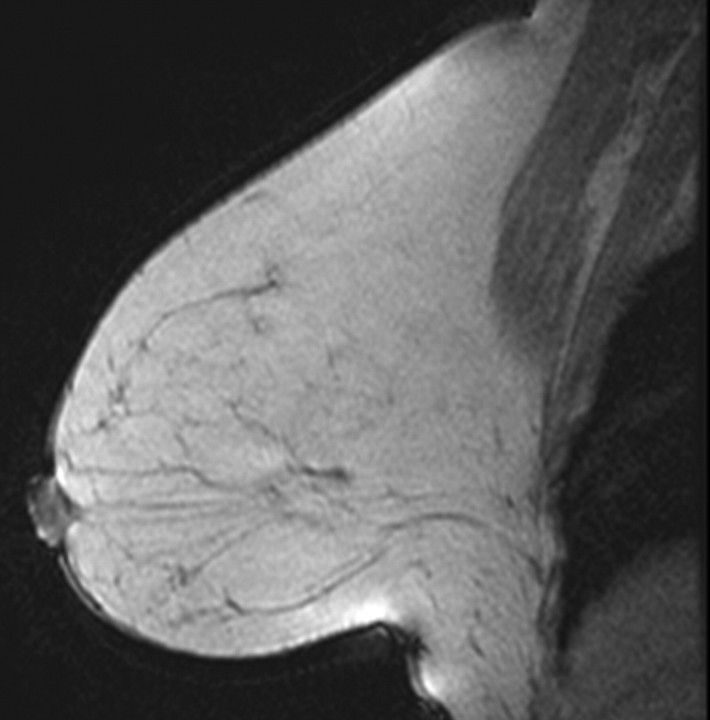
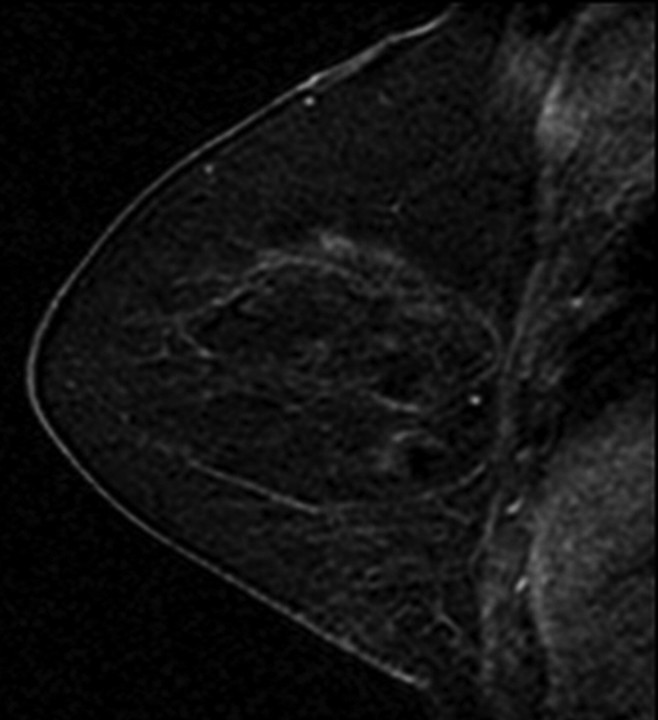
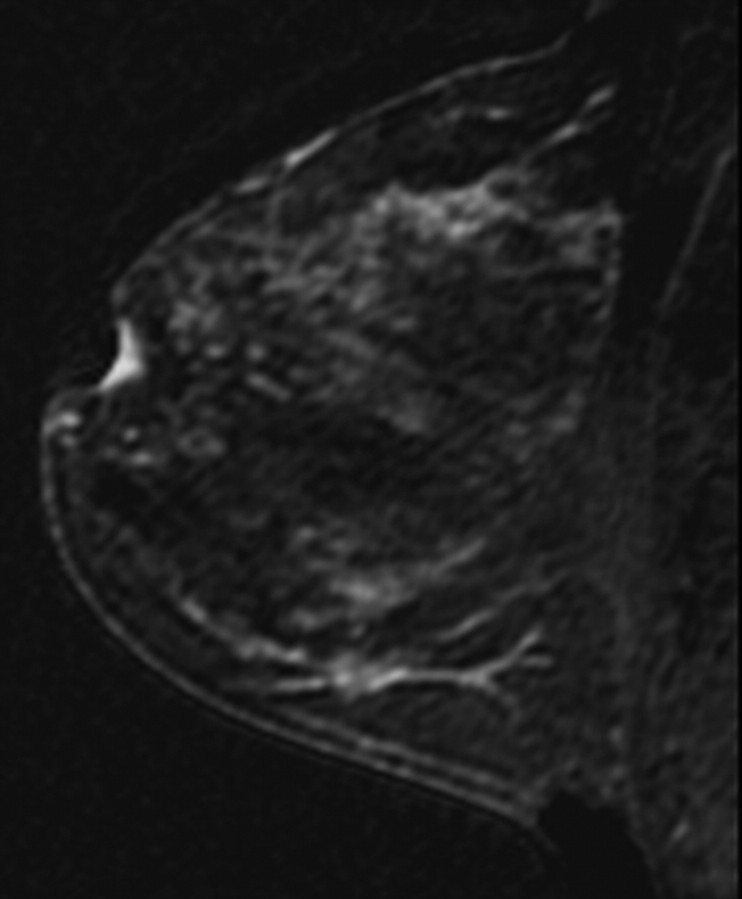
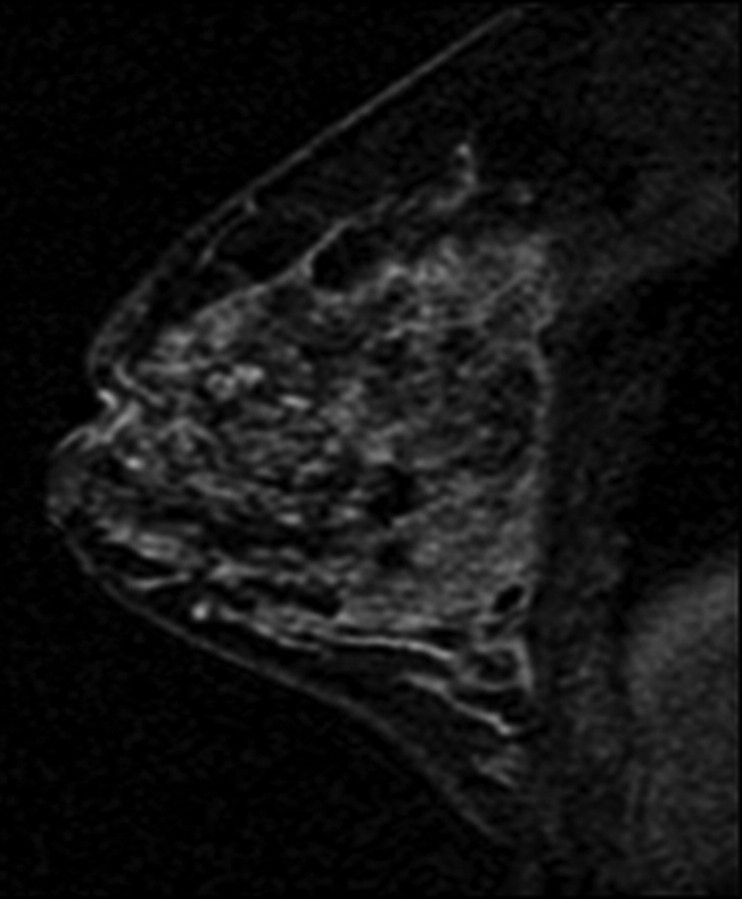
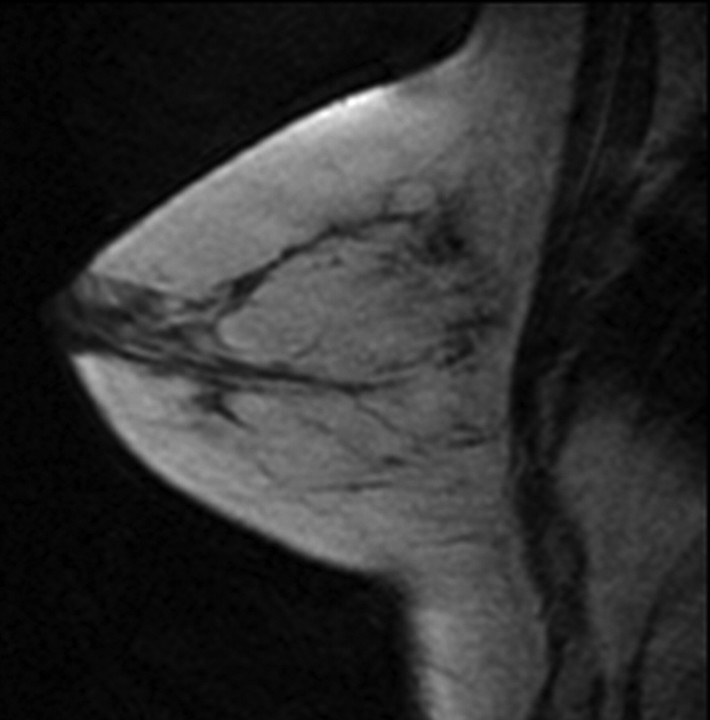
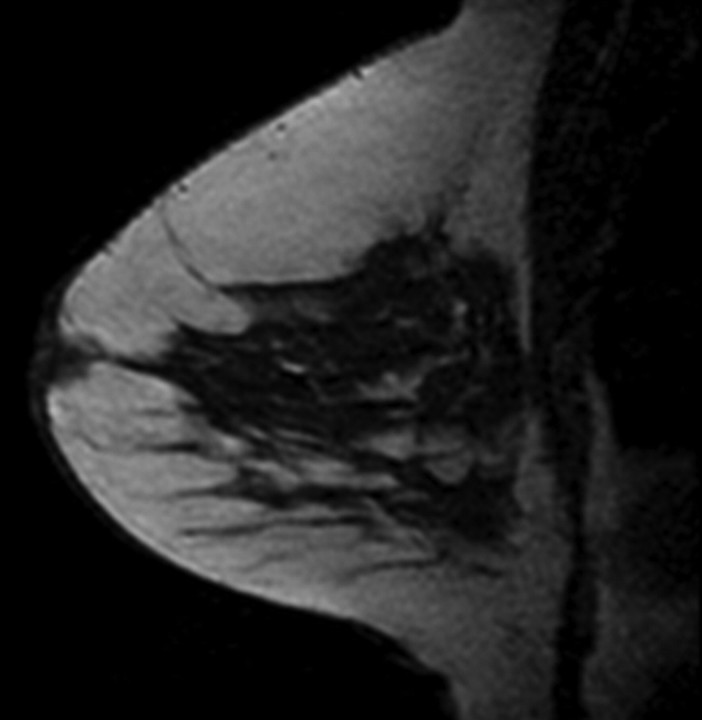
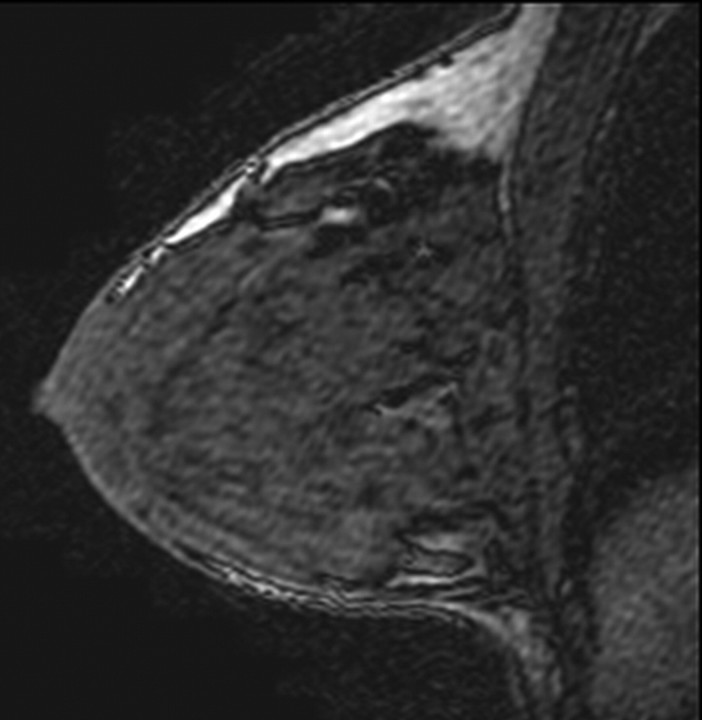
All images were independently reviewed by two fellowship-trained breast imaging radiologists (V.K., E.A.M., 2 and 14 years of experience in breast MR imaging, respectively) who were blinded as to whether the MR imaging findings were from breast cancer cases or controls. The level of MR imaging–depicted BPE and amount of MR imaging–depicted FGT were recorded. The BPE of the entire breast parenchyma was visually assessed by using a combination of precontrast and early postcontrast fat-suppressed T1-weighted and subtraction images and was defined as enhancement of the normal breast parenchyma. The volume and intensity of enhancement were considered in the global assessment of BPE and categorized, on the basis of proposed BI-RADS criteria, as minimal, mild, moderate, or marked (Fig 1) (19). The amount of FGT was visually assessed by using a combination of T2-weighted imaging and T1-weighted non–fat-suppressed and fat-suppressed imaging and was defined as any nonfatty noncystic breast parenchyma. The amount of FGT was graded, on the basis of BI-RADS criteria, as fatty (<25% of breast comprised glandular tissue), scattered (25%–50% of breast comprised glandular tissue), heterogeneously dense (51%–75% of breast comprised glandular tissue), or dense (>75% of breast comprised glandular tissue) (Fig 2). If the breast cancer case or control had a history of prior mastectomy, the remaining breast was used for assessment. To assess intrareader agreement, all breast MR images were reread after a 5-month interval by one reader (V.K.), who remained blinded to any previous reading.
Figure 1a:
T1-weighted fat-suppressed contrast-enhanced subtraction MR images show different right breasts with (a) minimal, (b) mild, (c) moderate, and (d) marked BPE.
Figure 2a:
T1-weighted non–fat-suppressed MR images show different breasts with (a) fatty, (b) scattered, (c) heterogeneously dense, and (d) dense amounts of FGT. (a and d = right breasts, b and c = left breasts.)
Figure 1b:
T1-weighted fat-suppressed contrast-enhanced subtraction MR images show different right breasts with (a) minimal, (b) mild, (c) moderate, and (d) marked BPE.
Figure 1c:
T1-weighted fat-suppressed contrast-enhanced subtraction MR images show different right breasts with (a) minimal, (b) mild, (c) moderate, and (d) marked BPE.
Figure 1d:
T1-weighted fat-suppressed contrast-enhanced subtraction MR images show different right breasts with (a) minimal, (b) mild, (c) moderate, and (d) marked BPE.
Figure 2b:
T1-weighted non–fat-suppressed MR images show different breasts with (a) fatty, (b) scattered, (c) heterogeneously dense, and (d) dense amounts of FGT. (a and d = right breasts, b and c = left breasts.)
Figure 2c:
T1-weighted non–fat-suppressed MR images show different breasts with (a) fatty, (b) scattered, (c) heterogeneously dense, and (d) dense amounts of FGT. (a and d = right breasts, b and c = left breasts.)
Figure 2d:
T1-weighted non–fat-suppressed MR images show different breasts with (a) fatty, (b) scattered, (c) heterogeneously dense, and (d) dense amounts of FGT. (a and d = right breasts, b and c = left breasts.)
In those women who had both breasts, the level of MR imaging BPE and amount of MR imaging FGT were recorded for each breast. There was almost perfect agreement regarding BPE (95.4% agreement on a four-point scale, r = 0.96, κ = 0.93) and FGT (99.2% agreement on four-point scale, r = 0.98, κ = 0.99) between the two breast sides in the breast cancer cases and controls, and data from the overall assessment are cited in this article. In the rare cases in which there was a difference in BPE and/or FGT between the two breasts, the breast with the greater amount of BPE or FGT was used for the overall assessment.
Statistical Analyses
Conditional logistic regression analysis with the matched case control study design incorporated was used to estimate odds ratios (ORs) and corresponding 95% confidence intervals (CIs) for MR imaging BPE and MR imaging FGT as risk factors for breast cancer. Because of the retrospective nature of this study, the mammograms obtained in a substantial number of the women were not available, and, thus, analysis of mammographic breast density as a predictor of a breast cancer case could not be reliably performed. Mammograms were not available in these cases because although the breast MR imaging examinations were performed at our institution, many of the contemporaneous mammographic screening examinations had been performed at outside facilities.
Data were adjusted for menopausal status (pre- vs postmenopausal) in all analyses when both premenopausal and postmenopausal women were included, by adding a binary term for menopausal status in the logistic regression models. Analyses performed within subgroups of women (eg, premenopausal women) were conducted by excluding from consideration women who were not in the given subgroup. The lower two categories of the four-point scales of BPE and FGT were combined to obtain more stable estimates. In cases with two breasts, analysis of reread data was conducted by using the measurement from the breast without the incident cancer and the measurement from the corresponding breast in the matched control. Intra- and interreader agreement regarding BPE and FGT was calculated by using κ statistics and Pearson correlation coefficients (with the four-point scales). Statistical analyses were performed independently for readers 1 and 2. All statistical analyses were performed with SAS, version 9.2 (SAS Institute, Cary, NC), or Stata, version 11.0 (Stata, College Station, Tex), software. For one analysis involving a category with a zero count, the calculation of a lower CI bound was made by using an exact method (exlogistic procedure in Stata). In all instances, statistical significance was evaluated according to changes in log-likelihood values. All reported statistical significance levels (P values) are two sided. P < .05 was considered to indicate significance. Strength of κ agreement was defined as follows: κ values lower than 0.00 indicated poor agreement; values of 0.00–0.20, slight agreement; values of 0.21–0.40, fair agreement; values of 0.41–0.60, moderate agreement; values of 0.61–0.81, substantial agreement; and values of 0.81–1.00, almost perfect agreement (26).
Results
Characteristics of Study Group
The characteristics of the patients who were breast cancer cases and controls are given in Table 2. Of the 39 breast cancer cases, 19 (49%) were cases of invasive ductal carcinoma; six (15%), cases of invasive lobular carcinoma; and 14 (36%), cases of ductal carcinoma in situ without an invasive component. Of the 25 invasive cancers, 21 (84%) were estrogen-receptor positive and 15 (60%) were progesterone-receptor positive; 20 (80%) of these cancers were smaller than 2 cm, four (16%) were 2–5 cm, and for one, size data were missing.
Table 2.
Patient Characteristics in Breast Cancer Cases and Controls
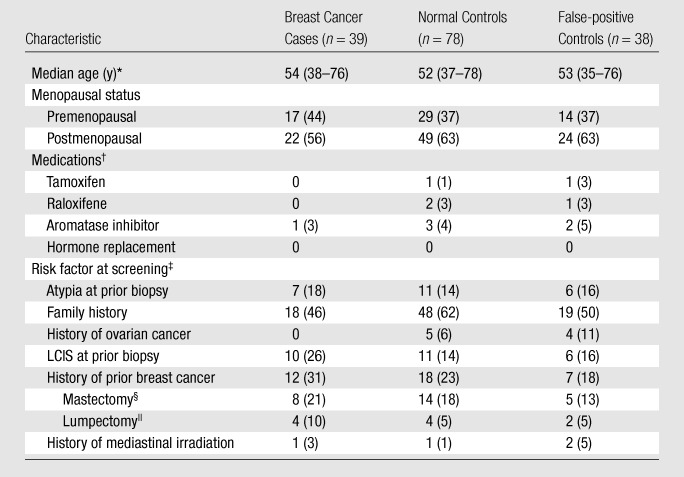
Note.—Unless otherwise noted, data are numbers of subjects, with percentages in parentheses. Thirty-eight (as opposed to 39) false-positive controls were included because there was one case for which no matched control could be identified.
Numbers in parentheses are age ranges.
Raloxifene (Evista) is manufactured by Eli Lilly and Company (Indianapolis, Ind); tamoxifen (Nolvadex) is manufactured by various companies.
Risk factor for breast cancer determined at MR imaging screening. LCIS = lobular carcinoma in situ.
Remaining uninvolved and nontreated breast was examined at screening MR imaging.
All lumpectomies were performed more than 5 years before the high-risk breast MR imaging screening examination.
Breast Cancer Cases versus Normal Controls
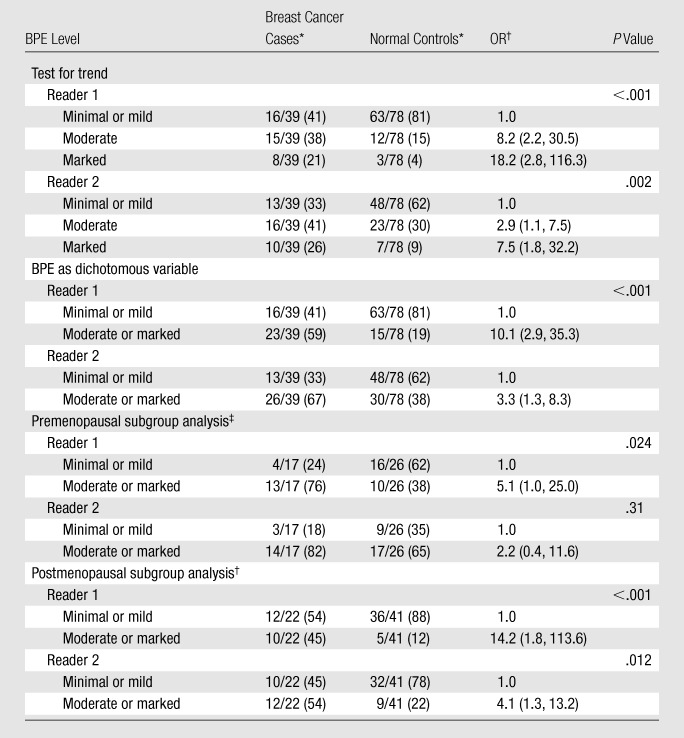
MR imaging BPE.—BPE was strongly associated with menopausal status (Table 3). In the normal controls, the percentage of women classified as having moderate or marked BPE among the premenopausal subjects was approximately three times as large as that among the postmenopausal subjects: 38% versus 12% according to reader 1 and 65% versus 22% according to reader 2.
Table 3.
ORs of Breast Cancer according to BPE Level: Breast Cancer Cases vs Normal Controls
Numbers in parentheses are percentages.
Numbers in parentheses are 95% CIs.
Data were adjusted for menopausal status when pre- and postmenopausal women were included in the analysis. These analyses also were performed with BPE as a dichotomous variable.
When the breast cancer cases were compared with the normal controls, increasing BPE was a significant predictor of being a breast cancer case; the OR increased steadily with increasing BPE (P < .001 at test for trend for reader 1, P = .002 at test for trend for reader 2) (Table 3). When BPE was considered a dichotomous variable, moderate or marked BPE, as compared with minimal or mild BPE, was a significant predictor of being a breast cancer case (ORs: 10.1 [95% CI: 2.9, 35.3] for reader 1; 3.3 [95% CI: 1.3, 8.3] for reader 2). The ORs associated with marked BPE were very high but had wide confidence limits.
These results changed minimally when the patients who underwent prior mastectomy (eight breast cancer cases, and 14 normal controls) were excluded: The ORs for moderate or marked BPE versus minimal or mild BPE changed from 10.1 to 13.0 for reader 1 and from 3.3 to 2.5 for reader 2. There was also little change when the small number of patients who were using tamoxifen, raloxifene, or an aromatase inhibitor at the time of MR imaging were excluded (one breast cancer case, six normal controls): The ORs for moderate or marked BPE versus minimal or mild BPE decreased from 10.1 to 9.0 for reader 1 and from 3.3 to 3.1 for reader 2. Results also did not differ significantly when the data were analyzed with and without the inclusion of pure ductal carcinoma in situ cases. Although BPE was found to decrease substantially after menopause, a relationship between BPE and breast cancer odds was seen in both the premenopausal and the postmenopausal women (Table 3); however, the relationship was not significant among the premenopausal women for reader 2.
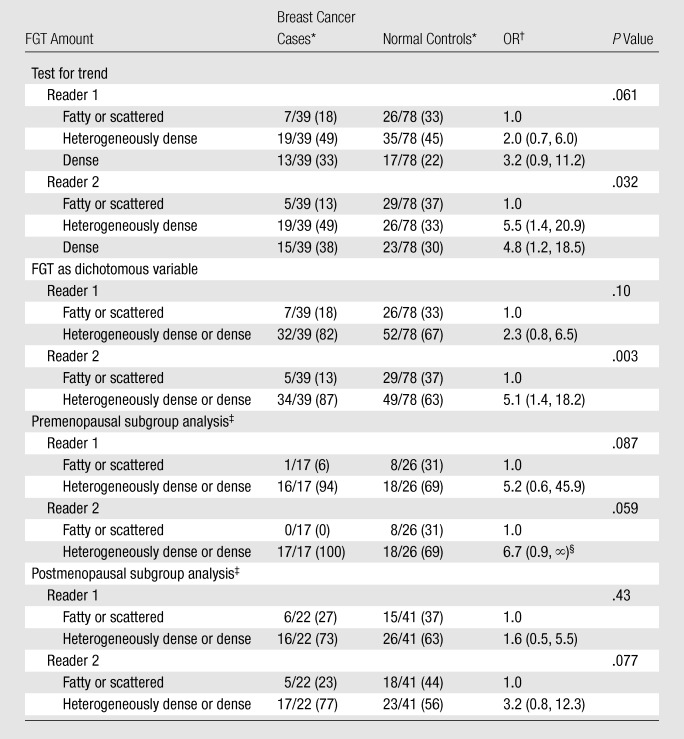
MR imaging FGT.—Although the associations with FGT were not as strong as those with BPE, the breast cancer odds also increased steadily with increasing amount of FGT when the breast cancer cases were compared with the normal controls (P = .061 at test for trend for reader 1, P = .032 at test for trend for reader 2) (Table 4). The ORs for heterogeneously dense or dense FGT versus fatty or scattered FGT were 2.3 (95% CI: 0.8, 6.5) for reader 1 and 5.1 (95% CI: 1.4, 18.2) for reader 2. Like the BPE levels, the amounts of FGT were smaller in the postmenopausal women, but the effect was much smaller for FGT than for BPE.
Table 4.
ORs of Breast Cancer according to FGT Amount: Breast Cancer Cases vs Normal Controls
Numbers in parentheses are percentages.
Numbers in parentheses are 95% CIs.
Data were adjusted for menopausal status when pre- and postmenopausal women were included in the analysis. These analyses also were performed with FGT as a dichotomous variable.
Median unbiased estimate.
The partial correlation of BPE and FGT after adjustments for menopausal status and breast cancer versus control status was weakly positive for reader 1 (r = 0.13, P = .18 with three-point scale) and was more strongly positive for reader 2 (r = 0.40, P < .001). After joint fitting of BPE and FGT, the overall ORs for moderate and marked BPE versus minimal or mild BPE declined slightly from 8.2 and 18.2 to 7.8 and 14.7, respectively (P < .001 at test for trend), for reader 1 and from 2.9 and 7.5 to 2.3 and 6.0, respectively (P = .016 at test for trend), for reader 2 (values from joint fitted analysis are not shown in Tables). After adjustment for BPE, the overall ORs for heterogeneously dense and dense FGT versus fatty or scattered FGT declined from 2.0 and 3.2 to 1.6 and 1.8, respectively (P = .54 at test for trend), for reader 1 and from 5.5 and 4.8 to 3.8 and 2.5, respectively (P = .44 at test for trend), for reader 2 (values from joint fitted analysis are not shown in Tables). BPE and FGT were correlated to some extent, but the BPE findings were only slightly reduced after adjustment for FGT and remained significant.
Breast Cancer Cases versus False-positive Controls
When the breast cancer cases were compared with the false-positive controls, increasing BPE remained a strong predictor of being a breast cancer case (P = .028 at test for trend for reader 1, P = .024 at test for trend for reader 2) (Table 5). Moderate or marked BPE relative to minimal or mild BPE was associated with ORs of 5.1 (95% CI: 1.4, 19.1) for reader 1 and 3.7 (95% CI: 1.2, 11.2) for reader 2. The association between FGT and breast cancer odds was weak and not significant for either reader when the breast cancer and false-positive controls were compared (Table 6).
Table 5.
ORs of Breast Cancer according to BPE Level: Breast Cancer Cases vs False-positive Controls
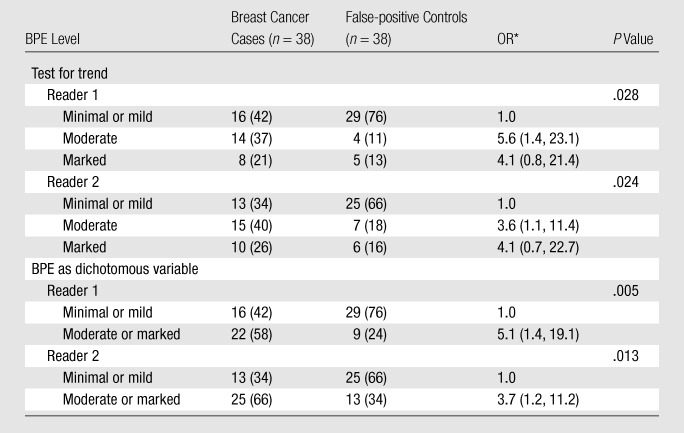
Note.—Data were adjusted for menopausal status. Numbers in parentheses are percentages.
Numbers in parentheses are 95% CIs.
Table 6.
ORs of Breast Cancer according to FGT Amount: Breast Cancer Cases vs False-positive Controls
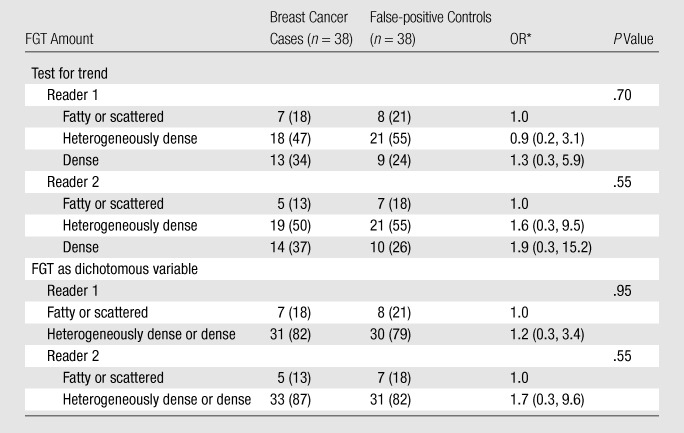
Note.—Data were adjusted for menopausal status. Numbers in parentheses are percentages.
Numbers in parentheses are 95% CIs.
Inter- and Intrareader Agreement
There was reasonable between-reader agreement regarding BPE level (κ = 0.47 for ordinal variables, κ = 0.57 for dichotomized variables) and better between-reader agreement regarding FGT amount (κ = 0.65 for ordinal variables, κ = 0.77 for dichotomized variables). Reader 1 intrareader agreement regarding both BPE level (κ = 0.62 for ordinal variables, κ = 0.69 for dichotomized variables) and FGT amount (κ = 0.76 for ordinal variables, κ = 0.77 for dichotomized variables) was greater.
Discussion
Study results have consistently demonstrated a strong relationship between increased mammographic breast density and increased breast cancer risk. In our study, we evaluated whether there are associations between breast cancer and both MR imaging BPE and MR imaging FGT. When cases of breast cancer were matched with normal controls of similar patient ages and MR imaging dates, BPE level was found to be a highly significant predictor of breast cancer. The odds of breast cancer increased significantly with increasing BPE level. For the women with moderate or marked BPE, as compared with the women with minimal or mild BPE, the ORs for being breast cancer cases were 10.1 and 3.3 for readers 1 and 2, respectively. To evaluate whether this effect could be due to bias secondary to the presence of a suspicious lesion in the breast, we performed a second analysis in which we compared breast cancer cases against controls with false-positive breast MR imaging findings (ie, suspicious lesions depicted at MR imaging that were found not to be cancer at biopsy). Because the readers reviewed the breast cancer cases, normal controls, and false-positive controls in random order, while blinded as to which MR image examinations represented breast cancer cases versus controls, and without knowing whether the lesions on the images were benign or breast cancers, they did not know which breasts had pathology findings positive for breast cancer. One goal in using false-positive controls (all of which had suspicious lesions) in addition to the normal controls was to control for potential bias in describing greater enhancement due to the presence of any lesion (benign or malignant) in the breast. Results of this second analysis, involving comparisons with false-positive controls, confirmed that BPE was a significant predictor of breast cancer: For the patients with moderate or marked BPE, as compared with those who had minimal or mild BPE, the ORs for being a breast cancer case were 5.1 and 3.7 for readers 1 and 2, respectively. In addition, BPE remained a significant predictor of breast cancer even after all women who had undergone a mastectomy previously and the small number of women who were taking tamoxifen, raloxifene, or an aromatase inhibitor were excluded. Similar results were achieved at analyses performed in the subgroups of women with invasive cancer and ductal carcinoma in situ without invasion.
If the amount of FGT correlates with breast density at mammography, then a significant association between increased FGT amount at breast MR imaging and breast cancer odds might be expected. We acknowledge that the amount of FGT, as a percentage of the total breast volume, might not be determined as accurately with two-dimensional mammography as it would with breast MR imaging, which is three-dimensional (18). In our study, MR imaging FGT was strongly associated with breast cancer odds when the breast cancer cases were compared with the normal controls. The relationship was much weaker when the breast cancer cases were compared with the false-positive controls. The reason for this is not completely clear, but it may be related to a greater prevalence of nonmalignant suspicious findings in the women who had dense FGT at MR imaging. When the normal MR examinations were used as controls, we did observe an association between FGT and breast cancer in our study, with ORs of 2.3 and 5.1 for readers 1 and 2, respectively, when the women who had dense breasts were compared with those who had fatty or scattered FGT. These odds are similar to the odds reported with use of mammographic density in the literature.
The association between FGT and breast cancer was lost when the false-positive MR examinations were used as controls (ORs: 1.2 and 1.7 for readers 1 and 2, respectively). We hypothesize that greater breast density and greater FGT amount may be associated with a greater prevalence of breast lesions—malignant or otherwise. Therefore, when the odds of breast cancer are evaluated by using comparisons with normal controls, as has been done in most studies to evaluate mammographic breast density, increased odds will be seen in association with dense breasts. If, however, breast density is simply a risk factor for having a breast lesion—whether benign or malignant—then the breast cancer odds associated with increased breast density might be canceled out when false-positive MR examinations are used as controls, as we saw in this study. The fact that BPE persisted as a risk factor despite the use of false-positive controls suggests that BPE may help to identify the subset of women with dense breasts who are truly at increased risk for breast cancer.
Reader 1 found MR imaging FGT and BPE to be weakly and nonsignificantly correlated, but reader 2 observed a stronger, highly significant association between these parameters. In one other study (24), findings similar to those observed by reader 1 were reported. Adjustment for FGT resulted in only a slight decrease in the estimated effects of BPE on breast cancer odds.
It has been shown previously that BPE can vary with hormonal status and menstrual cycle (21,23,27). We repeated our analysis exclusively in the postmenopausal patients to determine whether the effect would be different after the exclusion of those patients who are most affected by hormonal variation. The fact that excluding the premenopausal patients from our analysis did not change the results suggests that the effect seen in this study was not secondary to normal cyclic hormonal variation.
We found almost perfect agreement regarding level of MR imaging BPE between the two breasts in those patients who underwent bilateral examinations. This shows that BPE is a systemic rather than local phenomenon.
A number of studies have shown that BPE may decrease during antiestrogen treatment with selective estrogen receptor modulators such as toremifene and tamoxifen (28–30). If BPE is a risk factor for breast cancer and could be shown to be predictably reduced by medications used to prevent and/or treat breast cancer, such as selective estrogen receptor modulators, this would have important implications for the potential use of BPE as an imaging biomarker of effect.
One of the limitations of this study was that our assessment of BPE and FGT was qualitative. BPE was qualitatively graded, on the basis of proposed BI-RADS criteria, as minimal, mild, moderate, or marked (19), and FGT was graded, on the basis of American College of Radiology criteria, as fatty, scattered, heterogeneously dense, or dense (25). These criteria are similar to the qualitative criteria used to assess mammographic breast density. Because the MR image interpretations were subjective, intra- and interreader variability was calculated and indicated moderate to substantial agreement regarding all measures. In this study, BPE was a qualitative measure of the volume and intensity of enhancement of the entire breast. Although the percentage of enhancement for a two-dimensional area of interest can be measured, to our knowledge a validated quantitative method of approximating an area of interest to the entire breast is not yet available.
Some study investigators have attempted to quantify the amount of FGT by using water content as a surrogate; however, it is not known whether the water content accurately reflects what is seen as FGT on MR images. While our subjective method of assessing BPE and FGT has limitations, it accurately reflects current clinical practice in that it is similar to the nonquantitative assessment of breast density at mammography. We acknowledge that there may have been a difference in the individual set points of the two readers, with the less experienced reader deriving higher OR estimates. In future research and clinical practice, it will be important to standardize these measurements as much as possible by either automating the measurements or attempting to equalize different readers’ set points, possibly by using a training set (with standard readings) to be read before any reading session is conducted.
A second limitation of our study was the small sample. Nonetheless, even with our relatively small sample, we observed a clear relationship between BPE and breast cancer. However, we did not have a sufficient number of cases to conduct definitive analyses relative to tumor type or hormone receptor status or based on risk factors for breast cancer such as BRCA gene status. To conduct a more detailed assessment of the relationships among breast cancer, parenchymal pattern at mammography, and both MR imaging FGT and MR imaging BPE, a larger, ideally prospective study is needed. A prospective design would allow breast MR imaging and mammography to be performed at the same time with a similar technique, as well as accurate documentation of the patients’ menstrual status and last menstrual period. The sample would need to be large enough to perform subgroup analyses based on factors that might influence BPE—such as menstrual status, last menstrual period, and hormonal medications—and on risk factors for breast cancer such as family history. We also acknowledge the possibility that the presence of breast cancer has some systemic effect that causes increased BPE only during the time that the cancer is present in the breast. Further studies addressing the BPE seen at breast MR examinations performed at varying times before the development of breast cancer would address this concern. As more women undergo high-risk breast MR imaging screening and as quantitative methods of measuring BPE level and FGT amount at breast MR imaging become available, further prospective investigations will enable these and other issues to be addressed.
In conclusion, our study results show that increased BPE at breast MR imaging is associated with greatly increased odds of breast cancer, greater than MR imaging FGT. These odds may be as great as those associated with mammographic density. Additional studies to elucidate the relationship between mammographic breast density and MR imaging BPE, the biologic factors of BPE, how BPE varies over time, and the relationship between BPE and breast cancer tumor type will further clarify the utility of this measure and its importance as a marker of breast cancer risk.
Advances in Knowledge.
-
•.
Moderate or marked background parenchymal enhancement (BPE) at breast MR imaging is associated with significantly greater odds of breast cancer than is minimal or mild BPE when patients with breast cancer are compared with both control subjects with negative (benign) breast MR imaging findings (odds ratio [OR] ≥ 3.3) and control subjects with false-positive breast MR imaging findings (OR ≥ 3.7).
-
•.
The increased odds of breast cancer associated with moderate or marked BPE is evident in pre- and postmenopausal women.
-
•.
When control subjects with false-positive breast MR imaging findings are compared with patients who have breast cancer, the odds of breast cancer associated with increased BPE (OR ≥ 3.7) are higher than those associated with an increased amount of fibroglandular tissue (OR, 1.2).
Implication for Patient Care.
-
•.
BPE has the potential to serve as an additional tool for risk stratification in high-risk women undergoing breast MR imaging screening.
Received November 1, 2010; revision requested December 15; revision received February 7, 2011; accepted February 17; final version accepted February 25.
Disclosures of Potential Conflicts of Interest: V.K. No potential conflicts of interest to disclose. J.D.B. No potential conflicts of interest to disclose. J.L.B. No potential conflicts of interest to disclose. A.S.R. No potential conflicts of interest to disclose. M.C.P. No potential conflicts of interest to disclose. E.A.M. No potential conflicts of interest to disclose.
Abbreviations:
- BI-RADS
- Breast Imaging Reporting and Data System
- BPE
- background parenchymal enhancement
- CI
- confidence interval
- FGT
- fibroglandular tissue
- OR
- odds ratio
References
- 1.Wolfe JN. Risk for breast cancer development determined by mammographic parenchymal pattern. Cancer 1976;37(5):2486–2492. [DOI] [PubMed] [Google Scholar]
- 2.Wolfe JN. Breast patterns as an index of risk for developing breast cancer. AJR Am J Roentgenol 1976;126(6):1130–1137. [DOI] [PubMed] [Google Scholar]
- 3.Wolfe JN, Saftlas AF, Salane M. Mammographic parenchymal patterns and quantitative evaluation of mammographic densities: a case-control study. AJR Am J Roentgenol 1987;148(6):1087–1092. [DOI] [PubMed] [Google Scholar]
- 4.van Gils CH, Hendriks JH, Holland R, et al. Changes in mammographic breast density and concomitant changes in breast cancer risk. Eur J Cancer Prev 1999;8(6):509–515. [DOI] [PubMed] [Google Scholar]
- 5.Byrne C, Schairer C, Wolfe J, et al. Mammographic features and breast cancer risk: effects with time, age, and menopause status. J Natl Cancer Inst 1995;87(21):1622–1629. [DOI] [PubMed] [Google Scholar]
- 6.Brisson J, Merletti F, Sadowsky NL, Twaddle JA, Morrison AS, Cole P. Mammographic features of the breast and breast cancer risk. Am J Epidemiol 1982;115(3):428–437. [DOI] [PubMed] [Google Scholar]
- 7.Brisson J, Sadowsky NL, Twaddle JA, Morrison AS, Cole P, Merletti F. The relation of mammographic features of the breast to breast cancer risk factors. Am J Epidemiol 1982;115(3):438–443. [DOI] [PubMed] [Google Scholar]
- 8.Brisson J, Morrison AS, Kopans DB, et al. Height and weight, mammographic features of breast tissue, and breast cancer risk. Am J Epidemiol 1984;119(3):371–381. [DOI] [PubMed] [Google Scholar]
- 9.Brisson J, Verreault R, Morrison AS, Tennina S, Meyer F. Diet, mammographic features of breast tissue, and breast cancer risk. Am J Epidemiol 1989;130(1):14–24. [DOI] [PubMed] [Google Scholar]
- 10.Carlile T, Thompson DJ, Kopecky KJ, et al. Reproducibility and consistency in classification of breast parenchymal patterns. AJR Am J Roentgenol 1983;140(1):1–7. [DOI] [PubMed] [Google Scholar]
- 11.Boyd NF, Byng JW, Jong RA, et al. Quantitative classification of mammographic densities and breast cancer risk: results from the Canadian National Breast Screening Study. J Natl Cancer Inst 1995;87(9):670–675. [DOI] [PubMed] [Google Scholar]
- 12.Saftlas AF, Hoover RN, Brinton LA, et al. Mammographic densities and risk of breast cancer. Cancer 1991;67(11):2833–2838. [DOI] [PubMed] [Google Scholar]
- 13.Wei J, Chan HP, Helvie MA, et al. Correlation between mammographic density and volumetric fibroglandular tissue estimated on breast MR images. Med Phys 2004;31(4):933–942. [DOI] [PubMed] [Google Scholar]
- 14.Boyd N, Martin L, Chavez S, et al. Breast-tissue composition and other risk factors for breast cancer in young women: a cross-sectional study. Lancet Oncol 2009;10(6):569–580. [DOI] [PubMed] [Google Scholar]
- 15.Thompson DJ, Leach MO, Kwan-Lim G, et al. Assessing the usefulness of a novel MRI-based breast density estimation algorithm in a cohort of women at high genetic risk of breast cancer: the UK MARIBS Study. Breast Cancer Res 2009;11(6):R80. [DOI] [PMC free article] [PubMed] [Google Scholar]
- 16.Klifa C, Carballido-Gamio J, Wilmes L, et al. Magnetic resonance imaging for secondary assessment of breast density in a high-risk cohort. Magn Reson Imaging 2010;28(1):8–15. [DOI] [PMC free article] [PubMed] [Google Scholar]
- 17.Nie K, Chen JH, Chan S, et al. Development of a quantitative method for analysis of breast density based on three-dimensional breast MRI. Med Phys 2008;35(12):5253–5262. [DOI] [PMC free article] [PubMed] [Google Scholar]
- 18.Kopans DB. Basic physics and doubts about relationship between mammographically determined tissue density and breast cancer risk. Radiology 2008;246(2):348–353. [DOI] [PubMed] [Google Scholar]
- 19.Morris EA. Diagnostic breast MR imaging: current status and future directions. Radiol Clin North Am 2007;45(5):863–880, vii. [DOI] [PubMed] [Google Scholar]
- 20.Pfleiderer SO, Sachse S, Sauner D, et al. Changes in magnetic resonance mammography due to hormone replacement therapy. Breast Cancer Res 2004;6(3):R232–R238. [DOI] [PMC free article] [PubMed] [Google Scholar]
- 21.Kuhl CK, Bieling HB, Gieseke J, et al. Healthy premenopausal breast parenchyma in dynamic contrast-enhanced MR imaging of the breast: normal contrast medium enhancement and cyclical-phase dependency. Radiology 1997;203(1):137–144. [DOI] [PubMed] [Google Scholar]
- 22.Delille JP, Slanetz PJ, Yeh ED, Kopans DB, Halpern EF, Garrido L. Hormone replacement therapy in postmenopausal women: breast tissue perfusion determined with MR imaging—initial observations. Radiology 2005;235(1):36–41. [DOI] [PubMed] [Google Scholar]
- 23.Müller-Schimpfle M, Ohmenhaüser K, Stoll P, Dietz K, Claussen CD. Menstrual cycle and age: influence on parenchymal contrast medium enhancement in MR imaging of the breast. Radiology 1997;203(1):145–149. [DOI] [PubMed] [Google Scholar]
- 24.Cubuk R, Tasali N, Narin B, Keskiner F, Celik L, Guney S. Correlation between breast density in mammography and background enhancement in MR mammography. Radiol Med (Torino) 2010;115(3):434–441. [DOI] [PubMed] [Google Scholar]
- 25.American College of Radiology BI-RADS Committee Breast imaging reporting and data system. 4th ed Reston, Va: American College of Radiology, 2003. [Google Scholar]
- 26.Landis JR, Koch GG. The measurement of observer agreement for categorical data. Biometrics 1977;33(1):159–174. [PubMed] [Google Scholar]
- 27.Ellis RL. Optimal timing of breast MRI examinations for premenopausal women who do not have a normal menstrual cycle. AJR Am J Roentgenol 2009;193(6):1738–1740. [DOI] [PubMed] [Google Scholar]
- 28.Oksa S, Parkkola R, Luukkaala T, Mäenpää J. Breast magnetic resonance imaging findings in women treated with toremifene for premenstrual mastalgia. Acta Radiol 2009;50(9):984–989. [DOI] [PubMed] [Google Scholar]
- 29.King V, Morris E, Kaplan J, et al. Impact of tamoxifen on breast density, enhancement, and cystic alteration on breast magnetic resonance imaging (MRI) (abstr). In: Radiological Society of North America scientific assembly and annual meeting program. Oak Brook, Ill: Radiological Society of North America, 2009; 576. [Google Scholar]
- 30.Finlayson CA, Lewin JM, Rabinovitch R, et al. MRI is a potential intermediate marker for tamoxifen response in breast cancer prevention. [abstr]. Breast Cancer Res Treat 2003;82(Suppl 1):S178. [Google Scholar]


