Abstract
Purpose
To evaluate the potential utility of a number of parameters obtained at T2-weighted, diffusion-weighted, and dynamic contrast material–enhanced multiparametric magnetic resonance (MR) imaging for computer-aided diagnosis (CAD) of prostate cancer and assessment of cancer aggressiveness.
Materials and Methods
In this institutional review board–approved HIPAA-compliant study, multiparametric MR images were acquired with an endorectal coil in 48 patients with prostate cancer (median age, 62.5 years; age range, 44–73 years) who subsequently underwent prostatectomy. A radiologist and a pathologist identified 104 regions of interest (ROIs) (61 cancer ROIs, 43 normal ROIs) based on correlation of histologic and MR findings. The 10th percentile and average apparent diffusion coefficient (ADC) values, T2-weighted signal intensity histogram skewness, and Tofts Ktrans were analyzed, both individually and combined, via linear discriminant analysis, with receiver operating characteristic curve analysis with area under the curve (AUC) as figure of merit, to distinguish cancer foci from normal foci. Spearman rank-order correlation (ρ) was calculated between cancer foci Gleason score (GS) and image features.
Results
AUC (maximum likelihood estimate ± standard error) values in the differentiation of prostate cancer from normal foci of 10th percentile ADC, average ADC, T2-weighted skewness, and Ktrans were 0.92 ± 0.03, 0.89 ± 0.03, 0.86 ± 0.04, and 0.69 ± 0.04, respectively. The combination of 10th percentile ADC, average ADC, and T2-weighted skewness yielded an AUC value for the same task of 0.95 ± 0.02. GS correlated moderately with 10th percentile ADC (ρ = −0.34, P = .008), average ADC (ρ = −0.30, P = .02), and Ktrans (ρ = 0.38, P = .004).
Conclusion
The combination of 10th percentile ADC, average ADC, and T2-weighted skewness with CAD is promising in the differentiation of prostate cancer from normal tissue. ADC image features and Ktrans moderately correlate with GS.
© RSNA, 2013
Introduction
Prostate cancer is the most commonly diagnosed nonskin cancer and the second leading cause of cancer death among U.S. men (1–4). Magnetic resonance (MR) imaging is a promising noninvasive imaging tool for imaging prostate cancer (5). In addition to conventional T2-weighted images, multiparametric MR techniques yield additional biologic information on diffusion-weighted (DW) MR images, dynamic contrast material–enhanced (DCE) MR images, and spectroscopic images (5–8). These advanced functional imaging techniques may help increase the sensitivity of prostate cancer detection and the accuracy of predicting Gleason score (GS), which is a measure of cancer aggressiveness. However, interpretation of multiparametric MR images can be challenging because of the large amount of image data from multiple MR sequences in each patient. Without standardized analytic tools, subjective interpretation of multiparametric MR images depends on radiologists’ experience and expertise, thereby limiting the accuracy and reproducibility of prostate cancer detection and the assessment of cancer aggressiveness or GS and impeding wide and optimal use of the imaging techniques.
Computer-aided diagnosis (CAD), in which computer image analysis methods are used to help radiologists detect and diagnose abnormalities on medical images (9), has been developed for breast cancer (10–13), lung cancer (14,15), and colorectal cancer (16,17), but it has seen limited application to prostate cancer (18–26). The purpose of this study was to evaluate the potential utility of a number of parameters obtained at T2-weighted, DW, and DCE multiparametric MR imaging for CAD of prostate cancer and assessment of cancer aggressiveness.
Materials and Methods
Patients
Our institutional review board approved this retrospective and Health Insurance Portability and Accountability Act–compliant study, with a waiver of written informed patient consent. We searched the radiology image archive at our institution and identified 62 consecutive patients who were seen between March 2008 and March 2010 and who had biopsy-proved prostate cancer and underwent prostatectomy and multiparametric endorectal MR imaging, including all sequences of T1-weighted, T2-weighted, DW, and DCE MR imaging in the axial direction with Philips MR imagers (Achieva; Philips Healthcare, Eindhoven, the Netherlands). Patients were excluded from the study if (a) the patient underwent radiation therapy before MR imaging (n = 1), (b) MR imaging was performed after prostatectomy (n = 2), (c) MR images were acquired with a 3.0-T imager (n = 5), (d) DW MR images were missing (n = 1), or (e) DCE MR images were missing (n = 5). A total of 48 patients remained in this study. Standard histologic tissue slices of dissected prostatectomy specimens were available for all patients.
MR Image Data Acquisition
All MR images were acquired with an endorectal coil (Medrad; Bayer Healthcare, Warrendale, Pa) and a phased-array surface coil with the aforementioned Philips MR imagers. Immediately before MR imaging, 1 mg of glucagon (Glucagon; Lilly, Indianapolis, Ind) was injected intramuscularly to decrease peristalsis of the rectum. We imaged the entire prostate and oriented axial images to be perpendicular to the rectal wall, with guidance from sagittal images. We acquired the following images: axial, coronal, and sagittal T2-weighted MR images; axial T1-weighted MR images; axial free-breathing DW MR images (b values of 0, 50, 200, 1500, and 2000 sec/mm2 in 29 patients; b values of 0 and 1000 sec/mm2 in 24 patients); and axial free-breathing DCE MR images. Acquisition of DCE MR images of the entire prostate started 30 seconds before intravenous administration of approximately 0.1 mmol of gadodiamide (Omniscan; GE Healthcare, Princeton, NJ) per kilogram of body weight, which was followed by a 20-mL saline flush at a rate of 2.0 mL/sec. Image acquisition details are summarized in Table 1.
Table 1.
MR Image Acquisition Parameters

Note.—An effective sensitivity encoding (parallel imaging) factor of 2 was used in all sequences. Total image acquisition time was approximately 45 minutes.
Data are the length of one side of a square field of view.
Exceptional acquisition parameters are as follows: repetition time, 9561 msec (n = 1); echo time, 70 msec (n = 1); field of view, 160 (n = 1); matrix, 80 × 78 (n = 1); and number of signals acquired, one (n = 1).
Comma indicates that there are only two values.
Approximately 100–120 DCE MR images were acquired in 5–10 minutes at a temporal resolution of 3–6 seconds.
Histologic–Radiologic Correlation
The reference standard of prostate cancer foci in MR images was established through a systematic consensus-seeking correlative review of histologic findings and MR images by a genitourinary pathologist (T.A., 8 years of experience in genitourinary pathology) and a radiologist (A.O., 9 years of experience in prostate MR imaging). The histologic samples used in this study were processed as follows: Prostatectomy specimens were fixed in 5% buffered formalin, processed, and cut serially into 4-mm-thick blocks from apex to base in transverse planes. Each block was then halved or quartered (depending on its size), and 7–8-µm-thick microtome slices were stained with hematoxylin-eosin.
The pathologist identified all distinct tumor foci larger than approximately 5 mm in diameter, and the radiologist manually outlined the corresponding regions of interest (ROIs) of the tumor foci on MR images. For those tumor foci that were not clearly visible on MR images, their locations were determined based on their relationship with other identifiable landmarks (eg, urethra, ejaculatory ducts, benign prostatic hyperplasia nodules) on MR images by consensus of the radiologist and pathologist. In each case, the radiologist manually drew ROIs of peripheral zone (PZ) and/or central gland (comprising the transition zone and central zone) tumor foci (when present), as well as a normal PZ focus, unless no histologically normal region was present (n = 7). Four patients had no cancer ROIs, 31 patients had one ROI, 10 patients had two ROIs, two patients had three ROIs, and one patient had four ROIs. The ROIs were manually outlined on one two-dimensional MR image on which visualization of the tumor best correlated with histologic findings: Almost all ROIs were outlined on a T2-weighted image, except for four ROIs in four patients, which were outlined on a DW MR image. GS was rendered specifically for each tumor ROI by the study pathologist during the consensus review.
Transferring ROIs between MR Images
To analyze the multiparametric MR images, the ROIs outlined on a T2-weighted or DW MR image must be transferred to all other MR sequences. The ROIs were first mapped between MR sequences with computer software developed in-house with the Python programming language (version 2.6.5; www.python.org) by assuming that there was no patient motion throughout the entire multiparametric MR imaging study. Then, the study radiologist reviewed the results of the transferred ROIs in all cases. In cases in which misalignments were visually obvious, the locations of the ROIs were adjusted manually, without modifying their size or shape.
Quantitative Image Feature Analyses
We calculated pixelwise apparent diffusion coefficient (ADC) values from DW MR images by using a linear least-squares fit (27) to the logarithmic form of a monoexponential DW signal model, as follows:
where s0 and sb are DW MR signal intensities with diffusion weighting of 0 and b, respectively (28–30). All b values (either five or two b values) were used to estimate an ADC without any other normalization by using in-house software written in Python. We calculated the average and 10th percentile ADCs within an ROI. The 10th percentile ADC is less influenced by random statistical fluctuations than is the minimum ADC.
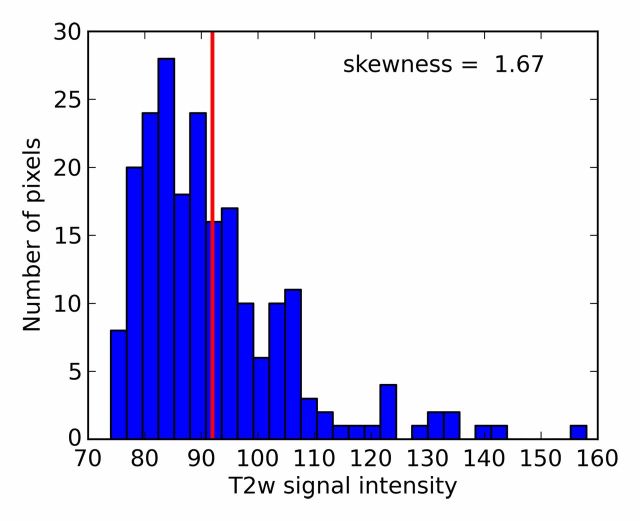
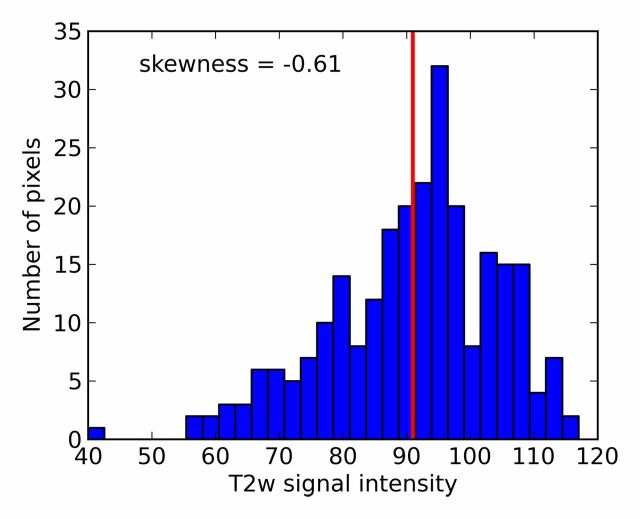
For each ROI, we also calculated the skewness of the T2-weighted signal intensity histogram, which quantifies the symmetry of the signal intensity histogram with respect to the average T2-weighted signal intensity within the ROI. For example, a symmetric histogram (skewness equal to zero) indicates that there are as many dark pixels as bright pixels within the ROI. However, an asymmetric histogram from an ROI that has more dark pixels than bright pixels (skewness > 0) is often seen in ROIs of prostate cancer foci, whereas an asymmetric histogram from an ROI that has more bright pixels than dark pixels (skewness < 0) is sometimes seen in normal tissue. The T2-weighted skewness (T2skew) feature is defined as follows:
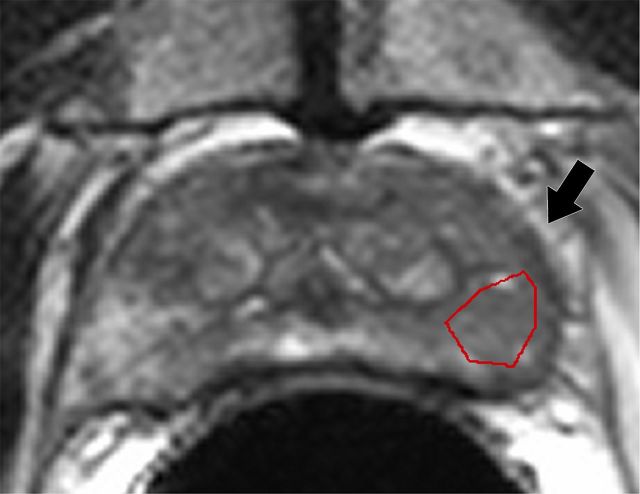
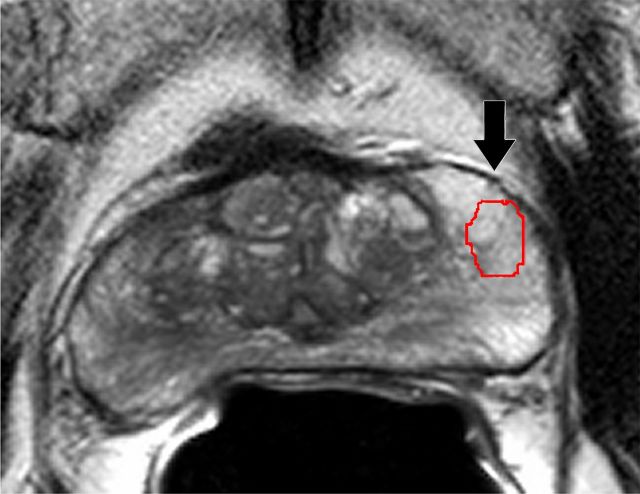
where si denotes T2-weighted signal intensity; µ and σ are the mean and standard deviation of the signal intensity histogram, respectively; and N is the number of pixels within the ROI (31). Skewness is not influenced by the absolute T2-weighted signal intensity (32). It is a third-order statistic; therefore, it may be difficult to perceive reliably with the naked eye. A Python script was developed to calculate T2-weighted skewness. Examples of T2-weighted image ROIs, T2-weighted signal intensity histograms, and their skewness values are shown in Figure 1.
Figure 1a:
T2-weighted MR images show (a) a tumor (arrow) in a 66-year-old man with a GS of 7 (4+3) and a prostate-specific antigen level of 13.02 ng/mL and (b) an area of PZ normal tissue (arrow) in a 64-year-old man with prostate cancer elsewhere. Red outlines indicate ROIs. (c, d) Corresponding histograms show T2-weighted signal intensities within the ROIs and the corresponding skewness image feature values. The tumor ROI has more dark pixels than bright pixels, whereas the normal tissue ROI has more bright pixels than dark pixels. Red lines in c and d identify the average T2-weighted signal intensity within each ROI.
Figure 1b:
T2-weighted MR images show (a) a tumor (arrow) in a 66-year-old man with a GS of 7 (4+3) and a prostate-specific antigen level of 13.02 ng/mL and (b) an area of PZ normal tissue (arrow) in a 64-year-old man with prostate cancer elsewhere. Red outlines indicate ROIs. (c, d) Corresponding histograms show T2-weighted signal intensities within the ROIs and the corresponding skewness image feature values. The tumor ROI has more dark pixels than bright pixels, whereas the normal tissue ROI has more bright pixels than dark pixels. Red lines in c and d identify the average T2-weighted signal intensity within each ROI.
Figure 1c:
T2-weighted MR images show (a) a tumor (arrow) in a 66-year-old man with a GS of 7 (4+3) and a prostate-specific antigen level of 13.02 ng/mL and (b) an area of PZ normal tissue (arrow) in a 64-year-old man with prostate cancer elsewhere. Red outlines indicate ROIs. (c, d) Corresponding histograms show T2-weighted signal intensities within the ROIs and the corresponding skewness image feature values. The tumor ROI has more dark pixels than bright pixels, whereas the normal tissue ROI has more bright pixels than dark pixels. Red lines in c and d identify the average T2-weighted signal intensity within each ROI.
Figure 1d:
T2-weighted MR images show (a) a tumor (arrow) in a 66-year-old man with a GS of 7 (4+3) and a prostate-specific antigen level of 13.02 ng/mL and (b) an area of PZ normal tissue (arrow) in a 64-year-old man with prostate cancer elsewhere. Red outlines indicate ROIs. (c, d) Corresponding histograms show T2-weighted signal intensities within the ROIs and the corresponding skewness image feature values. The tumor ROI has more dark pixels than bright pixels, whereas the normal tissue ROI has more bright pixels than dark pixels. Red lines in c and d identify the average T2-weighted signal intensity within each ROI.
The extended Tofts model (33) was used to estimate the pharmacokinetic parameters, volume transfer constant (Ktrans), blood plasma volume fraction, and extravascular extracellular space volume fraction of an ROI by using a population arterial input function (34) scaled by the contrast agent dose per kilogram of patient weight. Prior to this curve fit, the concentration of the contrast agent was estimated by using a noncontiguous bilateral ROI that covered the gluteal muscles and was manually drawn on a single image section at the precontrast time point reported by Fan et al (35). The curve fit was applied to the average concentration of the contrast agent in the ROI. Because earlier studies (36) and our clinical experience suggest that blood plasma volume fraction and extravascular extracellular space volume fraction are not as effective as Ktrans, we assessed only Ktrans in this study. The computer software for DCE MR image analysis was written in the Matlab programming language (version 7.11.0.584; Mathworks, Natick, Mass).
Statistical Analysis
We evaluated the effectiveness of image features in the differentiation of prostate cancer foci from normal tissue ROIs with receiver operating characteristic (ROC) analysis (37). Proper binormal ROC curves were estimated with maximum likelihood estimation (38), and the area under the ROC curve (AUC) was used as a figure of merit (39). AUC values were compared statistically by using the conventional bivariate binormal model, the output of which includes P values (40). Individual image features were combined by using linear discriminant analysis (LDA) (41) and both leave-one-patient-out and leave-one-ROI-out cross-validation methods to separate training from reporting of classifier performance (42). With these methods, every patient or ROI was used to test the classifier, both in turn and one at a time, when all other patients or ROIs were used to train the classifier; subsequently, ROC analysis was performed on the test results of all patients or ROIs in aggregate. We calculated the Spearman rank-order correlation coefficient (ρ) to characterize correlation strength between image features (continuous numbers) and GS (ordinal numbers); we also calculated the Pearson correlation coefficient (r) to characterize correlation strength between image features (43). All statistical tests were two sided, and P < .05 was considered to indicate a significant difference. Statistical analyses were performed with in-house computer software that was written in Python, except for ROC analysis (44).
Results
Characteristics of patients (n = 48), as well as those of tumor and normal PZ tissue ROIs (n = 104), are summarized in Tables 2 and 3, respectively.
Table 2.
Patient Characteristics

One case was excluded because the prostate-specific antigen level was missing.
One case was excluded because MR imaging was performed before prostate biopsy.
MR images were obtained within 6 weeks of prostate biopsy in 12 (25.5%) of 47 patients.
Table 3.
Characteristics of Tumor and PZ Normal Tissue ROIs

Note.—Unless otherwise indicated, data are number of ROIs and data in parentheses are percentages. Central gland ROIs are transition zone ROI plus central zone ROI.
Cancer ROIs accounted for 58.7% and normal tissue ROIs accounted for 41.3% of the total 104 ROIs.
PZ cancer ROIs accounted for 77.0% and central gland cancer ROIs accounted for 23.0% of the total 61 cancer ROIs.
Data are mean ± standard deviation.
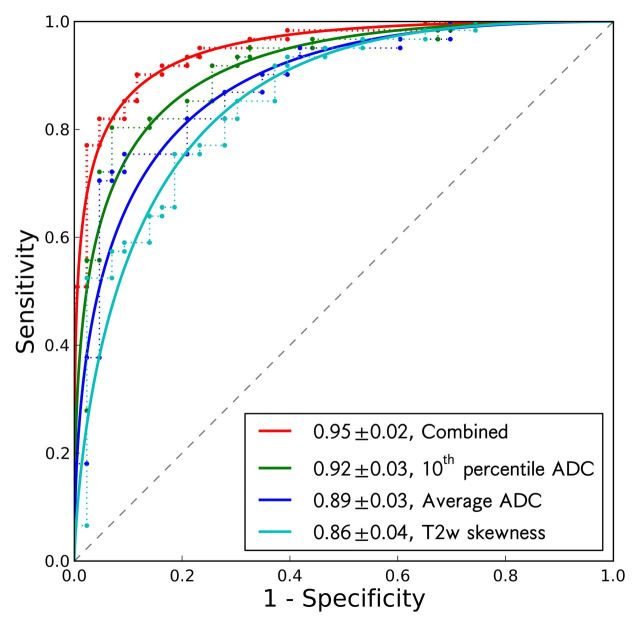
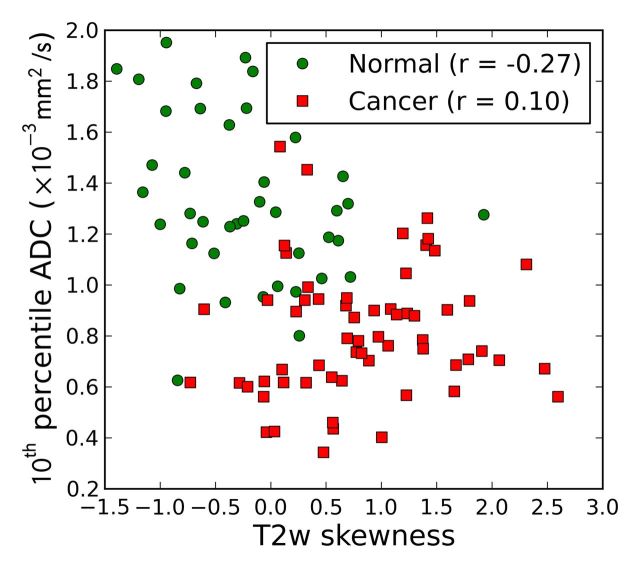
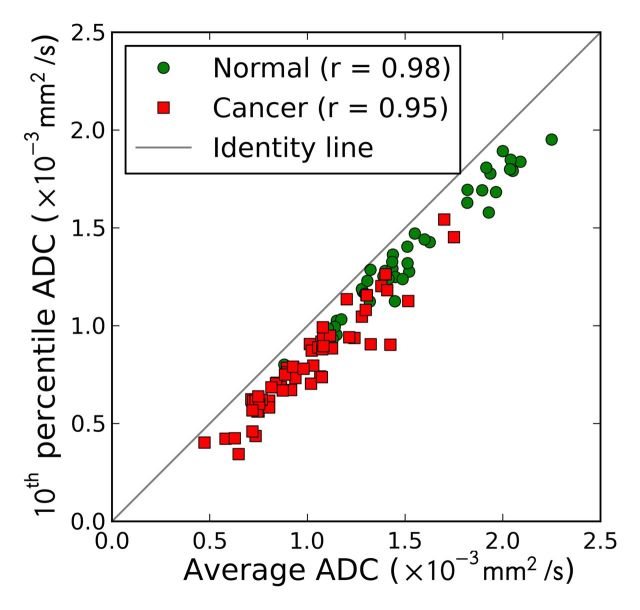
The effectiveness of the image features, both individually and combined (10th percentile ADC, average ADC, and T2-weighted skewness), in the differentiation of prostate cancer foci from normal PZ tissue is summarized in Table 4 and Figure 2. The 10th percentile ADC yielded the best individual feature AUC of 0.92 ± 0.03 (maximum likelihood estimate ± standard error). The three-feature combination further improved AUC to 0.95 ± 0.02 (Table 4). The 10th percentile ADC correlated moderately with T2-weighted skewness (for all ROIs: r = −0.44, P < .001; for normal tissue ROIs: r = −0.27, P = .08; for tumor ROIs: r = 0.10, P = .46) (Fig 3a), whereas the average and 10th percentile ADCs were highly correlated (r = 0.98, 0.98, and 0.95, for all ROIs, normal ROIs, and tumor ROIs, respectively; P < .05 for all groups) (Fig 3b). The linear discriminant analysis classifier accounts for correlation among the features automatically during the training process. The Ktrans performed at a lower level (AUC = 0.69 ± 0.05) and did not improve the AUC value (0.90 ± 0.03) when combined with the 10th percentile ADC; therefore, Ktrans was not further combined with other image features.
Table 4.
Effectiveness of Quantitative Image Features, Individually and in Combination, in the Differentiation of Prostate Cancer Foci from Normal Tissue

Note.—Unless otherwise indicated, results change little if the five patients who underwent 3.0-T MR imaging are included in the analysis; change in AUC was no more than 0.01, and changes in sensitivity and specificity (including the 95% confidence interval) were no more than 2.7% with fixed cutoff values.
Data are maximum likelihood estimate ± standard error.
Empirical sensitivity and specificity values were calculated from the data and fall close to the fitted ROC curve. Data in parentheses are raw data, and data in brackets are 95% confidence intervals, which are exact binomial estimates.
Example of image feature cutoff values that yield the listed sensitivity and specificity values.
Two cases were excluded from the analysis because of image artifacts.
The combination of 10th percentile ADC, average ADC, and T2 skewness with a linear discriminant analysis classifier. P values are for AUC comparison with 10th percentile ADC alone and were .06 for both techniques.
Figure 2:
ROC curves of 10th percentile ADC, average ADC, T2-weighted skewness, and combination of the three image features in the differentiation of prostate cancer foci and normal PZ tissue. Solid lines are maximum likelihood estimates of proper binormal ROC curves, and dashed lines are observed data. AUCs and standard errors are listed in the legend.
Figure 3a:
Scatterplots between (a) 10th percentile ADC and T2-weighted skewness and (b) 10th percentile ADC and average ADC. Pearson correlation coefficients are shown in the legends.
Figure 3b:
Scatterplots between (a) 10th percentile ADC and T2-weighted skewness and (b) 10th percentile ADC and average ADC. Pearson correlation coefficients are shown in the legends.
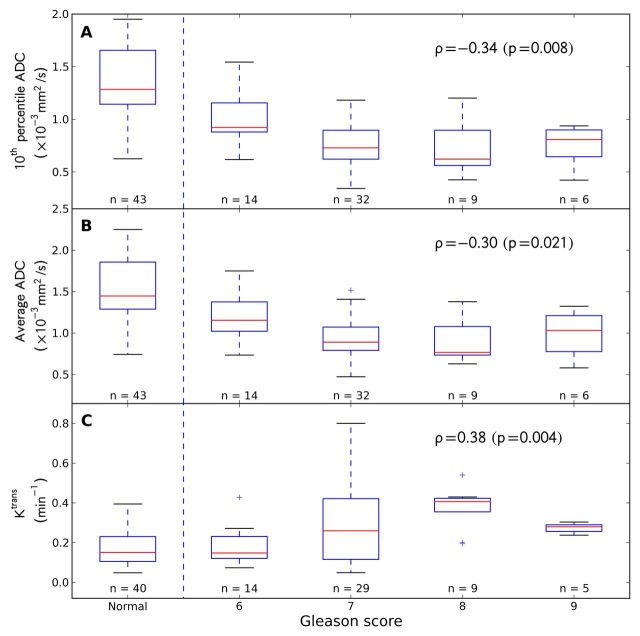
Moderate correlation with tumor GS was found (Fig 4) for the 10th percentile ADC (ρ = −0.34, P = .008), average ADC (ρ = −0.30, P = .02), and Ktrans (ρ = 0.38, P = .004), and no correlation was found for T2 skewness (ρ = −0.07, P = .59). Higher grade was associated with lower 10th percentile and average ADCs but a higher Ktrans (except for GS 9 tumor foci, which apparently showed a trend in the opposite direction) (Fig 4). These features were moderately effective individually in the classification of low-grade (GS 6) versus high-grade (GS 7, 8, or 9) tumors (AUC = 0.78 ± 0.07 for 10th percentile and average ADCs, AUC = 0.72 ± 0.07 for Ktrans). Combining the three features did not yield significantly better AUC values (leave-one-patient-out technique: 0.77 ± 0.05, P = .90; leave-one-ROI-out technique: 0.80 ± 0.06, P = .49) compared with 10th percentile ADC alone.
Figure 4:
Box plots show patterns of correlation between GS and, A, 10th percentile ADC, B, average ADC, and, C, Ktrans. In each box plot, red line indicates median; box indicates interquartile range; whiskers indicate most deviated data points within the 1.5 interquatile range; and crosses are outliers. Normal PZ tissue ROIs are shown for comparison; corresponding Spearman correlation coefficients are also listed (excluding normal tissue ROIs), as well as the number of ROIs in each group.
Discussion
Current clinical interpretations of multiparametric prostate MR images are challenged by a lack of standardized diagnostic criteria and an overwhelming amount of image data that must be analyzed in each case. CAD has the potential to address both of these challenges. The quantitative nature of CAD analysis can help achieve standardization of diagnostic criteria, and we expect automated CAD analysis of multiparametric MR data to help improve the reproducibility of prostate MR image interpretation, thereby enabling us to more accurately detect cancer and predict tumor aggressiveness for better patient counseling and treatment planning.
In this retrospective study, we found that computer-calculated quantitative MR image features—the 10th percentile pixelwise ADC, average ADC, and T2-weighted signal intensity skewness—were effective in the differentiation of prostate cancer from normal PZ tissue and that the 10th percentile ADC, average ADC, and Ktrans correlated moderately with GS. The 10th percentile ADC and T2-weighted skewness are infrequently used image features.
The 10th percentile pixelwise ADC is more effective than average ADC in the differentiation of prostate cancer from normal PZ tissue; by selecting an appropriate cutoff value, both greater sensitivity and greater specificity can be achieved with the 10th percentile ADC. This may be because the 10th percentile ADC is more effective than the average ADC in the identification of areas where cancerous glands intermix with benign prostatic tissue rather than completely replace it (28). The 10th percentile ADC is analogous to and statistically more reliable than the minimum pixelwise ADC (the darkest pixel on the ADC map) in an ROI, which we have found helpful when making a clinical diagnosis. Computer calculation of this feature may be necessary, as it is difficult to estimate visually.
The T2-weighted signal intensity skewness quantifies the relative number of dark pixels versus bright pixels within an ROI, independent of the overall signal intensity. Its AUC of 0.86 in the differentiation of prostate cancer from normal PZ tissue is comparable to that (AUC = 0.85) of a previous report of T2 value (24). It is correlated only moderately at best with the 10th percentile ADC, which is in contrast with a previous report of positive correlation between ADC and T2 values (28). As a third-order statistic, it is best calculated with a computer rather than estimated visually. It would be useful to analyze this feature based on T2 maps (18,21,24); however, our image data did not permit this.
Moderate and negative correlation between ADC and GS has been reported (29,45–50), with a Spearman correlation coefficient of −0.5 to −0.6 for biopsy GS (45,47) and −0.38 to −0.46 for prostatectomy GS (50). Other researchers (29,49) reported a Pearson correlation coefficient of −0.39 to −0.63 for prostatectomy GS, which is not the most appropriate measure, as GS is ordinal. Our results are consistent with those of previous reports (48,50). However, the observed correlation can be influenced by the subjective nature and interobserver variability of GS (51), as well as by variations in DW MR image acquisition (eg, the number and value of b values), the latter of which requires further investigation. Also consistent with the literature (49), we found that the two ADC image features were moderately effective in the differentiation of low-grade (GS ≤6) and high-grade (GS ≥7) tumors. The relatively small number of CG tumors (n = 14) did not permit a separate analysis of correlation for PZ and CG tumors versus GS.
DCE MR image features from pharmacokinetic or empirical time-curve analysis have been reported to help differentiate prostate cancer from benign tissue (AUC range, 0.77–0.885) (20,22,25). Increased vascularity, capillary permeability, and interstitial hypertension in tumors are considered to underlie better tumor visualization (20). However, a recent report suggests that prostate cancer is not associated with increased vascularity (52). Ktrans was not highly effective in the differentiation of tumor from normal tissue in our study. This observation agrees with the literature (36,53) and with our clinical experience. Moderate correlation was found between Ktrans and GS, and Ktrans was moderately effective in the differentiation of low- and high-grade tumors; these findings are inconsistent with previous finding that showed no correlation between quantitative DCE MR parameters and GS (54,55). However, the temporal resolution in our study was higher than that in previous studies (3–6 sec vs 5–12 sec), and one other recent study with higher temporal resolution (2 sec) also reported a significant correlation between GS and washout gradient of the DCE MR images (56). Better temporal resolution may be a factor in revealing moderate correlation between quantitative DCE MR parameters and GS.
Several groups have developed prostate cancer CAD techniques (18,19,21). Early studies often emphasized DCE MR and T2 image analysis (20,22,24,25), and more recent studies have incorporated diffusion image analysis (26). The reported AUC values ranged from 0.77 to 0.89 (20,22,24,25), and a recent study reported sensitivity of 74% with five false-positive detections per patient (26). The present study adds to this literature and, because we identified important image features, it is a first step toward the development of a CAD tool that will help radiologists detect prostate cancer clinically.
Our study had several limitations. First, because precise spatial correlation of tumors between histologic and MR images is critical and difficult, we devoted considerable effort to careful histologic-radiologic correlation in each case. The entire set of prostatectomy tissue slices was reviewed jointly by a genitourinary pathologist and a radiologist before the radiologist outlined tumor ROIs. However, uncertainty still cannot be ruled out in some cases. Second, an additional source of uncertainty was the transferring of ROIs from one MR sequence to another. Respiratory motion, cardiac motion, and other patient motion throughout the course of the MR examination causes rigid transferring to be unsatisfactory in some patients. Thus, a radiologist reviewed all ROI transfer results and manually adjusted the ROI locations, when necessary. Perhaps adoption of new techniques (57) and routine use of whole-mount histology can help reduce this uncertainty. Third, MR images were acquired in patients who underwent prostatectomy; therefore, patient selection bias could have influenced our results. Furthermore, our requirement for rigorous histologic-MR correlation may have led to (a) the inclusion of only cancer and normal tissue ROIs whose locations could be determined definitively on MR images (either visible or locatable via nearby structures) and (b) an inability to include other foci that cannot be readily located on MR images. However, this study is an important first step in the identification of effective quantitative image features, and it demonstrates the benefit of CAD image analysis. Future studies are needed to investigate more subtle tumors. Fourth, reproducibility was not assessed in our study because we had only one set of patient cases, which limited the generalizability of our results. Fifth, we did not analyze the potential effect of DW MR imaging with two versus five b values on these results. Sixth, normal tissue ROIs were taken from only the PZ and not the transition zone. Future studies are needed to address these issues.
This retrospective study suggests that CAD based on combining quantitative image features derived from multiparametric endorectal MR images can be effective in distinguishing prostate cancer from the normal prostate and that ADC features and Ktrans correlate moderately with tumor GS. CAD has the potential to improve image interpretation by providing radiologists with a quantitative and standardized approach to combine both anatomic and functional information from multiparametric MR imaging techniques.
Advances in Knowledge.
• The 10th percentile apparent diffusion coefficient (ADC), average ADC, and T2-weighted signal intensity skewness are effective image features with which to distinguish prostate cancer foci from normal peripheral zone (PZ) tissue (area under the receiver operating characteristic curve [AUC], 0.92 ± 0.03 [maximum likelihood estimate ± standard error], 0.89 ± 0.03, and 0.86 ± 0.04, respectively).
• The combination of the 10th percentile ADC, average ADC, and T2-weighted signal intensity skewness with a linear classifier is better than the 10th percentile ADC alone in the differentiation of prostate cancer foci from normal PZ tissue (AUC, 0.95 ± 0.02).
• The 10th percentile ADC, average ADC, and volume transfer constant (Ktrans) are moderately correlated with tumor Gleason score (GS) (ρ = −0.34, P = .008; ρ = −0.30, P = .02; and ρ = 0.38, P = .004, respectively) and moderately effective when distinguishing low-grade (GS = 6) from high-grade (GS ≥7) prostate cancer foci (AUC = 0.78 ± 0.07 for both ADC features, AUC = 0.72 ± 0.07 for Ktrans).
Implication for Patient Care.
• Quantitative image features identified in this study can be used in computer-aided diagnosis to integrate multiparametric MR image data and potentially help radiologists achieve standardized, accurate, reproducible, and more efficient interpretation of prostate MR images to improve prostate cancer detection and improve predictive accuracy of cancer aggressiveness.
Received July 2, 2012; revision requested August 24; revision received October 20; accepted November 6; final version accepted November 13.
From the 2011 RSNA Annual Meeting.
Supported in part by the U.S. Army Medical Research and Materiel Command Prostate Cancer Research Program through an Idea Development Award (PC093485) and by the Paul C. Hodges Alumni Society of the Department of Radiology, University of Chicago.
Disclosures of Conflicts of Interest: Y.P. No relevant conflicts of interest to disclose. Y.J. No relevant conflicts of interest to disclose. C.Y. No relevant conflicts of interest to disclose. J.B. No relevant conflicts of interest to disclose. T.A. No relevant conflicts of interest to disclose. I.S. No relevant conflicts of interest to disclose. C.S. No relevant conflicts of interest to disclose. M.L.G. Financial activities related to the present article: none to disclose. Financial activities not related to the present article: holds various computer-aided diagnosis patents; receives royalties from Hologic; institution receives royalties from Hologic; holds shares in and is a cofounder of Quantitative Insights; holds stock in Hologic. Other relationships: none to disclose. S.E.E. No relevant conflicts of interest to disclose. A.O. Financial activities related to the present article: none to disclose. Financial activities not related to the present article: is a consultant to Oxford Analytica; institution received a grant from Philips Healthcare; institution receives payment for lectures from Philips Healthcare. Other relationships: none to disclose.
Abbreviations:
- ADC
- apparent diffusion coefficient
- AUC
- area under the receiver operating characteristic curve
- CAD
- computer-aided diagnosis
- DCE
- dynamic contrast material–enhanced
- DW
- diffusion weighted
- GS
- Gleason score
- Ktrans
- volume transfer constant
- PZ
- peripheral zone
- ROC
- receiver operating characteristic
- ROI
- region of interest
References
- 1.Siegel R, Naishadham D, Jemal A. Cancer statistics, 2012. CA Cancer J Clin 2012;62(1):10–29. [DOI] [PubMed] [Google Scholar]
- 2.Chou R, Croswell JM, Dana T, et al. . Screening for prostate cancer: a review of the evidence for the U.S. Preventive Services Task Force. Ann Intern Med 2011;155(11):762–771. [DOI] [PubMed] [Google Scholar]
- 3.Berglund RK, Masterson TA, Vora KC, Eggener SE, Eastham JA, Guillonneau BD. Pathological upgrading and up staging with immediate repeat biopsy in patients eligible for active surveillance. J Urol 2008;180(5):1964–1967; discussion 1967–1968. [DOI] [PMC free article] [PubMed] [Google Scholar]
- 4.Gofrit ON, Zorn KC, Taxy JB, et al. . Predicting the risk of patients with biopsy Gleason score 6 to harbor a higher grade cancer. J Urol 2007;178(5):1925–1928. [DOI] [PubMed] [Google Scholar]
- 5.Hoeks CM, Barentsz JO, Hambrock T, et al. . Prostate cancer: multiparametric MR imaging for detection, localization, and staging. Radiology 2011;261(1):46–66. [DOI] [PubMed] [Google Scholar]
- 6.Kozlowski P, Chang SD, Jones EC, Berean KW, Chen H, Goldenberg SL. Combined diffusion-weighted and dynamic contrast-enhanced MRI for prostate cancer diagnosis: correlation with biopsy and histopathology. J Magn Reson Imaging 2006;24(1):108–113. [DOI] [PubMed] [Google Scholar]
- 7.Tanimoto A, Nakashima J, Kohno H, Shinmoto H, Kuribayashi S. Prostate cancer screening: the clinical value of diffusion-weighted imaging and dynamic MR imaging in combination with T2-weighted imaging. J Magn Reson Imaging 2007;25(1):146–152. [DOI] [PubMed] [Google Scholar]
- 8.Yoshizako T, Wada A, Hayashi T, et al. . Usefulness of diffusion-weighted imaging and dynamic contrast-enhanced magnetic resonance imaging in the diagnosis of prostate transition-zone cancer. Acta Radiol 2008;49(10):1207–1213. [DOI] [PubMed] [Google Scholar]
- 9.Giger ML, Chan HP, Boone J. Anniversary paper: history and status of CAD and quantitative image analysis—the role of Medical Physics and AAPM. Med Phys 2008;35(12):5799–5820. [DOI] [PMC free article] [PubMed] [Google Scholar]
- 10.Chan HP, Doi K, Vyborny CJ, et al. . Improvement in radiologists’ detection of clustered microcalcifications on mammograms: the potential of computer-aided diagnosis. Invest Radiol 1990;25(10):1102–1110. [DOI] [PubMed] [Google Scholar]
- 11.Jiang Y, Nishikawa RM, Schmidt RA, Metz CE, Giger ML, Doi K. Improving breast cancer diagnosis with computer-aided diagnosis. Acad Radiol 1999;6(1):22–33. [DOI] [PubMed] [Google Scholar]
- 12.Warren Burhenne LJ, Wood SA, D’Orsi CJ, et al. . Potential contribution of computer-aided detection to the sensitivity of screening mammography. Radiology 2000;215(2):554–562. [DOI] [PubMed] [Google Scholar]
- 13.Freer TW, Ulissey MJ. Screening mammography with computer-aided detection: prospective study of 12,860 patients in a community breast center. Radiology 2001;220(3):781–786. [DOI] [PubMed] [Google Scholar]
- 14.Kobayashi T, Xu XW, MacMahon H, Metz CE, Doi K. Effect of a computer-aided diagnosis scheme on radiologists’ performance in detection of lung nodules on radiographs. Radiology 1996;199(3):843–848. [DOI] [PubMed] [Google Scholar]
- 15.White CS, Pugatch R, Koonce T, Rust SW, Dharaiya E. Lung nodule CAD software as a second reader: a multicenter study. Acad Radiol 2008;15(3):326–333. [DOI] [PubMed] [Google Scholar]
- 16.Petrick N, Haider M, Summers RM, et al. . CT colonography with computer-aided detection as a second reader: observer performance study. Radiology 2008;246(1):148–156. [DOI] [PubMed] [Google Scholar]
- 17.Dachman AH, Obuchowski NA, Hoffmeister JW, et al. . Effect of computer-aided detection for CT colonography in a multireader, multicase trial. Radiology 2010;256(3):827–835. [DOI] [PMC free article] [PubMed] [Google Scholar]
- 18.Chan I, Wells W, Mulkern RV, et al. . Detection of prostate cancer by integration of line-scan diffusion, T2-mapping and T2-weighted magnetic resonance imaging; a multichannel statistical classifier. Med Phys 2003;30(9):2390–2398. [DOI] [PubMed] [Google Scholar]
- 19.Madabhushi A, Feldman MD, Metaxas DN, Tomaszeweski J, Chute D. Automated detection of prostatic adenocarcinoma from high-resolution ex vivo MRI. IEEE Trans Med Imaging 2005;24(12):1611–1625. [DOI] [PubMed] [Google Scholar]
- 20.Vos PC, Hambrock T, Hulsbergen-van de Kaa CA, Fütterer JJ, Barentsz JO, Huisman HJ. Computerized analysis of prostate lesions in the peripheral zone using dynamic contrast enhanced MRI. Med Phys 2008;35(3):888–899. [DOI] [PubMed] [Google Scholar]
- 21.Langer DL, van der Kwast TH, Evans AJ, Trachtenberg J, Wilson BC, Haider MA. Prostate cancer detection with multi-parametric MRI: logistic regression analysis of quantitative T2, diffusion-weighted imaging, and dynamic contrast-enhanced MRI. J Magn Reson Imaging 2009;30(2):327–334. [DOI] [PubMed] [Google Scholar]
- 22.Puech P, Betrouni N, Makni N, Dewalle AS, Villers A, Lemaitre L. Computer-assisted diagnosis of prostate cancer using DCE-MRI data: design, implementation and preliminary results. Int J CARS 2009;4(1):1–10. [DOI] [PubMed] [Google Scholar]
- 23.Tiwari P, Rosen M, Madabhushi A. A hierarchical spectral clustering and nonlinear dimensionality reduction scheme for detection of prostate cancer from magnetic resonance spectroscopy (MRS). Med Phys 2009;36(9):3927–3939. [DOI] [PMC free article] [PubMed] [Google Scholar]
- 24.Vos PC, Hambrock T, Barenstz JO, Huisman HJ. Computer-assisted analysis of peripheral zone prostate lesions using T2-weighted and dynamic contrast enhanced T1-weighted MRI. Phys Med Biol 2010;55(6):1719–1734. [DOI] [PubMed] [Google Scholar]
- 25.Sung YS, Kwon HJ, Park BW, et al. . Prostate cancer detection on dynamic contrast-enhanced MRI: computer-aided diagnosis versus single perfusion parameter maps. AJR Am J Roentgenol 2011;197(5):1122–1129. [DOI] [PubMed] [Google Scholar]
- 26.Vos PC, Barentsz JO, Karssemeijer N, Huisman HJ. Automatic computer-aided detection of prostate cancer based on multiparametric magnetic resonance image analysis. Phys Med Biol 2012;57(6):1527–1542. [DOI] [PubMed] [Google Scholar]
- 27.Rice JA. Mathematical statistics and data analysis. 2nd ed. Belmont, Calif: Duxbury Press, 1995; 507–528. [Google Scholar]
- 28.Langer DL, van der Kwast TH, Evans AJ, et al. . Intermixed normal tissue within prostate cancer: effect on MR imaging measurements of apparent diffusion coefficient and T2—sparse versus dense cancers. Radiology 2008;249(3):900–908. [DOI] [PubMed] [Google Scholar]
- 29.Verma S, Rajesh A, Morales H, et al. . Assessment of aggressiveness of prostate cancer: correlation of apparent diffusion coefficient with histologic grade after radical prostatectomy. AJR Am J Roentgenol 2011;196(2):374–381. [DOI] [PubMed] [Google Scholar]
- 30.Chenevert TL, Galbán CJ, Ivancevic MK, et al. . Diffusion coefficient measurement using a temperature-controlled fluid for quality control in multicenter studies. J Magn Reson Imaging 2011;34(4):983–987. [DOI] [PMC free article] [PubMed] [Google Scholar]
- 31.Rice JA. Mathematical statistics and data analysis. 2nd ed. Belmont, Calif: Duxbury Press, 1995; 143. [Google Scholar]
- 32.Huo Z, Giger ML, Olopade OI, et al. . Computerized analysis of digitized mammograms of BRCA1 and BRCA2 gene mutation carriers. Radiology 2002;225(2):519–526. [DOI] [PubMed] [Google Scholar]
- 33.Tofts PS, Brix G, Buckley DL, et al. . Estimating kinetic parameters from dynamic contrast-enhanced T(1)-weighted MRI of a diffusable tracer: standardized quantities and symbols. J Magn Reson Imaging 1999;10(3):223–232. [DOI] [PubMed] [Google Scholar]
- 34.Parker GJ, Roberts C, Macdonald A, et al. . Experimentally-derived functional form for a population-averaged high-temporal-resolution arterial input function for dynamic contrast-enhanced MRI. Magn Reson Med 2006;56(5):993–1000. [DOI] [PubMed] [Google Scholar]
- 35.Fan X, Medved M, River JN, et al. . New model for analysis of dynamic contrast-enhanced MRI data distinguishes metastatic from nonmetastatic transplanted rodent prostate tumors. Magn Reson Med 2004;51(3):487–494. [DOI] [PubMed] [Google Scholar]
- 36.Oto A, Kayhan A, Jiang Y, et al. . Prostate cancer: differentiation of central gland cancer from benign prostatic hyperplasia by using diffusion-weighted and dynamic contrast-enhanced MR imaging. Radiology 2010;257(3):715–723. [DOI] [PMC free article] [PubMed] [Google Scholar]
- 37.Metz CE. ROC methodology in radiologic imaging. Invest Radiol 1986;21(9):720–733. [DOI] [PubMed] [Google Scholar]
- 38.Metz CE, Pan X. “Proper” binormal ROC curves: theory and maximum-likelihood estimation. J Math Psychol 1999;43(1):1–33. [DOI] [PubMed] [Google Scholar]
- 39.Hanley JA, McNeil BJ. The meaning and use of the area under a receiver operating characteristic (ROC) curve. Radiology 1982;143(1):29–36. [DOI] [PubMed] [Google Scholar]
- 40.Metz CE, Wang PL, Kronman H. A new approach for testing the significance of differences between ROC curves measured from correlated data. In: , Deconinck F, ed. Information processing in medical imaging. The Hague, the Netherlands: Martinus Nijhoff, 1984; 432–445. [Google Scholar]
- 41.Fukunaga K. Introduction to statistical pattern recognition. 2nd ed. Boston, Mass: Academic Press, 1990; 131–136. [Google Scholar]
- 42.Fukunaga K. Introduction to statistical pattern recognition. 2nd ed. Boston, Mass: Academic Press, 1990; 219–224. [Google Scholar]
- 43.Riffenburgh RH. Statistics in medicine. 2nd ed. Amsterdam, the Netherlands: Elsevier Academic Press, 2006; 454–456. [Google Scholar]
- 44.Metz CE. ROC software. http://metz-roc.uchicago.edu/. Accessed June 25, 2012.
- 45.Tamada T, Sone T, Jo Y, et al. . Apparent diffusion coefficient values in peripheral and transition zones of the prostate: comparison between normal and malignant prostatic tissues and correlation with histologic grade. J Magn Reson Imaging 2008;28(3):720–726. [DOI] [PubMed] [Google Scholar]
- 46.Woodfield CA, Tung GA, Grand DJ, Pezzullo JA, Machan JT, Renzulli JF. Diffusion-weighted MRI of peripheral zone prostate cancer: comparison of tumor apparent diffusion coefficient with Gleason score and percentage of tumor on core biopsy. AJR Am J Roentgenol 2010;194(4):W316–W322. [DOI] [PubMed] [Google Scholar]
- 47.Turkbey B, Shah VP, Pang Y, et al. . Is apparent diffusion coefficient associated with clinical risk scores for prostate cancers that are visible on 3-T MR images? Radiology 2011;258(2):488–495. [DOI] [PMC free article] [PubMed] [Google Scholar]
- 48.Itou Y, Nakanishi K, Narumi Y, Nishizawa Y, Tsukuma H. Clinical utility of apparent diffusion coefficient (ADC) values in patients with prostate cancer: can ADC values contribute to assess the aggressiveness of prostate cancer? J Magn Reson Imaging 2011;33(1):167–172. [DOI] [PubMed] [Google Scholar]
- 49.Bittencourt LK, Barentsz JO, de Miranda LC, Gasparetto EL. Prostate MRI: diffusion-weighted imaging at 1.5T correlates better with prostatectomy Gleason grades than TRUS-guided biopsies in peripheral zone tumours. Eur Radiol 2012;22(2):468–475. [DOI] [PubMed] [Google Scholar]
- 50.Thörmer G, Otto J, Reiss-Zimmermann M, et al. . Diagnostic value of ADC in patients with prostate cancer: influence of the choice of b values. Eur Radiol 2012;22(8):1820–1828. [DOI] [PubMed] [Google Scholar]
- 51.Allsbrook WCJ, Mangold KA, Johnson MH, et al. . Interobserver reproducibility of Gleason grading of prostatic carcinoma: urologic pathologists. Hum Pathol 2001;32(1):74–80. [DOI] [PubMed] [Google Scholar]
- 52.Tretiakova M, Antic T, Binder D, et al. . Microvessel density is not increased in prostate cancer: digital imaging of routine sections and tissue microarrays. Hum Pathol 2012 Oct 12. [Epub ahead of print] [DOI] [PubMed] [Google Scholar]
- 53.Turkbey B, Pinto PA, Mani H, et al. . Prostate cancer: value of multiparametric MR imaging at 3 T for detection—histopathologic correlation. Radiology 2010;255(1):89–99. [DOI] [PMC free article] [PubMed] [Google Scholar]
- 54.Padhani AR, Gapinski CJ, Macvicar DA, et al. . Dynamic contrast enhanced MRI of prostate cancer: correlation with morphology and tumour stage, histological grade and PSA. Clin Radiol 2000;55(2):99–109. [DOI] [PubMed] [Google Scholar]
- 55.Oto A, Yang C, Kayhan A, et al. . Diffusion-weighted and dynamic contrast-enhanced MRI of prostate cancer: correlation of quantitative MR parameters with Gleason score and tumor angiogenesis. AJR Am J Roentgenol 2011;197(6):1382–1390. [DOI] [PubMed] [Google Scholar]
- 56.Chen YJ, Chu WC, Pu YS, Chueh SC, Shun CT, Tseng WY. Washout gradient in dynamic contrast-enhanced MRI is associated with tumor aggressiveness of prostate cancer. J Magn Reson Imaging 2012;36(4):912–919. [DOI] [PubMed] [Google Scholar]
- 57.Shah V, Pohida T, Turkbey B, et al. . A method for correlating in vivo prostate magnetic resonance imaging and histopathology using individualized magnetic resonance-based molds. Rev Sci Instrum 2009;80(10):104301. [DOI] [PMC free article] [PubMed] [Google Scholar]


