Abstract
Purpose
To compare diagnostic accuracy of T2-weighted magnetic resonance (MR) imaging with that of multiparametric (MP) MR imaging combining T2-weighted imaging with diffusion-weighted (DW) MR imaging, dynamic contrast material–enhanced (DCE) MR imaging, or both in the detection of locally recurrent prostate cancer (PCa) after radiation therapy (RT).
Materials and Methods
This retrospective HIPAA-compliant study was approved by the institutional review board; informed consent was waived. Fifty-three men (median age, 70 years) suspected of having post-RT recurrence of PCa underwent MP MR imaging, including DW and DCE sequences, within 6 months after biopsy. Two readers independently evaluated the likelihood of PCa with a five-point scale for T2-weighted imaging alone, T2-weighted imaging with DW imaging, T2-weighted imaging with DCE imaging, and T2-weighted imaging with DW and DCE imaging, with at least a 4-week interval between evaluations. Areas under the receiver operating characteristic curve (AUC) were calculated. Interreader agreement was assessed, and quantitative parameters (apparent diffusion coefficient [ADC], volume transfer constant [Ktrans], and rate constant [kep]) were assessed at sextant- and patient-based levels with generalized estimating equations and the Wilcoxon rank sum test, respectively.
Results
At biopsy, recurrence was present in 35 (66%) of 53 patients. In detection of recurrent PCa, T2-weighted imaging with DW imaging yielded higher AUCs (reader 1, 0.79–0.86; reader 2, 0.75–0.81) than T2-weighted imaging alone (reader 1, 0.63–0.67; reader 2, 0.46–0.49 [P ≤ .014 for all]). DCE sequences did not contribute significant incremental value to T2-weighted imaging with DW imaging (reader 1, P > .99; reader 2, P = .35). Interreader agreement was higher for combinations of MP MR imaging than for T2-weighted imaging alone (κ = 0.34–0.63 vs κ = 0.17–0.20). Medians of quantitative parameters differed significantly (P < .0001 to P = .0233) between benign tissue and PCa (ADC, 1.64 ×10⁻³ mm2/sec vs 1.13 ×10⁻³ mm2/sec; Ktrans, 0.16 min−1 vs 0.33 min−1; kep, 0.36 min−1 vs 0.62 min−1).
Conclusion
MP MR imaging has greater accuracy in the detection of recurrent PCa after RT than T2-weighted imaging alone, with no additional benefit if DCE is added to T2-weighted imaging and DW imaging.
© RSNA, 2013
Supplemental material: http://radiology.rsna.org/lookup/suppl/doi:10.1148/radiol.13122149/-/DC1
Introduction
Detection of the presence and site of prostate cancer (PCa) recurrence after radiation therapy (RT) is crucial to tailor individualized treatment strategies. Approximately 30%–50% of patients who undergo treatment experience a relapse within 5 years of RT (1). Recurrent PCa is suspected if there is an increase in the serum prostate-specific antigen (PSA) level; however, the PSA level may fluctuate after RT, and an increase in the PSA level does not necessarily imply recurrence (2,3). Furthermore, even in cases that meet the definition of biochemical failure after RT, serum PSA measurements are limited in the differentiation between local recurrence and metastatic disease (4). Thus, transrectal ultrasonographically (US) guided biopsies are usually performed to diagnose local recurrence in this context. However, transrectal US-guided biopsy is invasive and prone to sampling error with known pitfalls in pathologic analysis of irradiated prostate tissue, including difficulty in the differentiation of viable tumor from treated tumor (5–8).
Magnetic resonance (MR) imaging is the most detailed and accurate technique for imaging the prostate. Multiparametric (MP) MR imaging, which combines conventional T2-weighted imaging with one or more functional MR imaging techniques such as diffusion-weighted (DW) MR imaging or dynamic contrast material–enhanced (DCE) MR imaging, is widely considered to be state of the art (9). Preliminary reports have shown that such an approach may be particularly useful in the detection of local recurrence after RT for PCa (10–13), where T2-weighted MR imaging alone is limited due to postradiation effects on the prostate, including gland shrinkage, loss of normal zonal anatomy, and decreased contrast between PCa and normal prostatic tissue caused by RT-induced glandular atrophy and fibrosis (14–19). Similar to RT-induced changes, hormone therapy can diffusely decrease signal intensity of prostatic tissue and cause a decrease in glandular volume depending on the type and duration of therapy (19). These therapy-induced changes may complicate differentiation between the treated tumor and tumor recurrence at T2-weighted imaging, and they may influence quantitative parameters of functional MR imaging techniques (20,21).
In spite of the promising results obtained with MP MR imaging in this clinical setting, it remains uncertain whether the addition of more than one functional imaging technique to T2-weighted imaging is needed to significantly improve the detection and characterization of PCa after RT. Thus, the primary purpose of our study was to compare the diagnostic accuracy of T2-weighted imaging alone with that of T2-weighted imaging used in combination with DW imaging, DCE MR imaging, or both in the detection of locally recurrent PCa after RT. In addition, quantitative parameters derived from DW and DCE MR imaging were evaluated for their ability to enable prediction of the aggressiveness of a locally recurrent tumor.
Materials and Methods
This retrospective study complied with the Health Insurance Portability and Accountability Act and was approved by our institutional review board. A waiver of informed consent was issued.
Patients
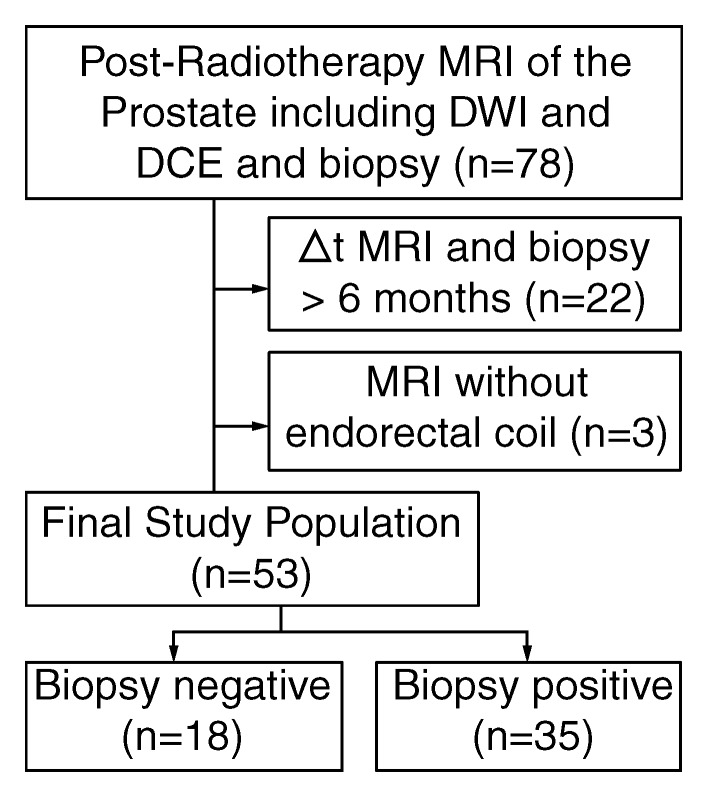
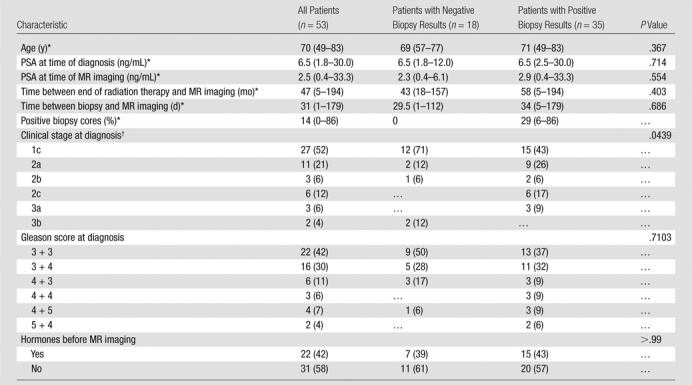
A retrospective search of our electronic hospital information system was performed to identify patients who met the following inclusion criteria: (a) They had histologically proved PCa treated with RT (with or without associated androgen deprivation therapy). (b) Posttreatment MP MR imaging of the prostate, including DW (b = 700 or 1000 sec/mm2) and DCE sequences, was performed. (c) A posttreatment transrectal US–guided biopsy report was available that gave the location or locations of tumor recurrence (if any) by sextant. Between August 2008 and November 2011, 78 patients fulfilled these inclusion criteria. Twenty-two patients were excluded due to an interval of more than 6 months between MR imaging and post-RT biopsy, and three patients were excluded because MR imaging was performed without an endorectal coil. Thus, 53 patients remained in the study (median age, 70 years; range, 49–83 years) (Fig 1), 20 of whom were included in a prior study (11). MR examinations were ordered because of suspected recurrence due to biochemical failure, as defined by the Phoenix criteria (22) (n = 25), or consecutive increases in the PSA level without fulfillment of the Phoenix criteria (n = 28). The median baseline serum PSA level before RT was 6.5 ng/mL (range, 1.8–30.0 ng/mL). At initial diagnosis, the Gleason score was 6 (3 + 3) in 22 (42%) patients, 7 (3 + 4) in 16 (30%) patients, 7 (4 + 3) in six (11%) patients, 8 (4 + 4) in three (6%) patients, and 9 (4 + 5) in six (11%) patients. Thirty-four (64%) patients underwent external-beam RT (median dose, 8100 cGy; range, 3625–8640 cGy), eight (15%) underwent permanent interstitial implantation with iodine 125 (prescription dose, 144 Gy), and 11 (21%) received a combination of brachytherapy and intensity modulated RT; 22 (42%) patients underwent hormonal therapy before MR imaging (Table 1). No patient received hormonal therapy within the 6 months prior to MR imaging (median time, 37.2 months; range, 6.2–187.9 months).
Figure 1:
Flowchart summarizes selection of patients.
Table 1.
Patient Characteristics
Note.—Unless otherwise indicated, data are numbers of patients, and data in parentheses are percentages.
Data are medians, and data in parentheses are the range.
In one patient with negative biopsy results, clinical stage at diagnosis was unknown; therefore, percentages were calculated with a denominator of 52 for all patients and a denominator of 17 for patients with negative biopsy results.
MR Imaging
All images were acquired with a 1.5-T (n = 24) or 3.0-T (n = 29) MR imaging system (Signa or Signa HDX; GE Medical Systems, Milwaukee, Wis). In all patients, a pelvic phased-array coil with four channels was used in combination with an endorectal coil (Medrad, Warrendale, Pa) for signal reception. Transverse T1-weighted images were acquired by using the following parameters: repetition time msec/echo time msec, 467–650/7.9–12.2 at 1.5 T and 550–817/6.9–10.4 at 3.0 T; section thickness, 5 mm; intersection gap, 1 mm; field of view, 22–40 cm; and matrix, 256 × 128 to 448 × 224. Transverse, coronal, and sagittal T2-weighted fast spin-echo images were acquired with the following parameters: 2800–6000/93–126.9 at 1.5 T and 2180–6667/116–143.3 at 3.0 T; section thickness, 2–3 mm; intersection gap, 0–1 mm; field of view, 14–24 cm; and matrix, 96 × 96 to 448 × 224.
Transverse DW sequences were performed in the transverse plane by using a single-shot spin-echo echo-planar imaging sequence with two b values (0 and 1000 sec/mm2 [n = 42] or 0 and 700 sec/mm2 [n = 11]) (3500–8050/74.1–129.2; section thickness, 3 mm; no intersection gap; field of view, 14–24 cm; matrix, 96 × 96 to 256 × 192) and with the same orientation and location used to acquire transverse T2-weighted images. Parametric maps of apparent diffusion coefficients (ADCs) were calculated by using a designated workstation (Advanced Workstation; GE Medical Systems). DCE MR imaging was performed by using a transverse three-dimensional T1-weighted spoiled gradient-echo sequence that covered the entire prostate in contiguous sections (3.0–10.1/0.8–2.4 at 1.5 T, 3.3–4.4/1.1–1.5 at 3.0 T; section thickness, 4–9 mm; field of view, 14–26 cm; matrix, 256 × 128 to 256 × 160). Temporal resolution was 3.4–6.7 seconds. Images were acquired after intravenous injection of 0.1 mmol of gadopentetate dimeglumine per kilogram of body weight (Magnevist; Berlex Laboratories, Montville, NJ) at a rate of 2 mL/sec with an automatic injector (Medrad). Pharmacokinetic analysis of the images was performed by using research software (CineTool; GE Medical Systems) with a population-based arterial input function and reference T1 times of 1317 msec at 1.5 T and 1597 msec at 3.0 T for the prostate (23). The volume transfer constant (Ktrans) and the rate constant (kep) were calculated.
Image Analysis
Two radiologists (O.F.D, a body imaging research fellow performing dedicated research in genitourinary imaging with 1 year of experience in interpreting prostate MR images; S.I.J., a faculty radiologist with 8 years of experience in interpreting prostate MR images) who were blinded to clinical and laboratory findings and histologic and imaging findings independently interpreted MR imaging data. Both readers interpreted four different imaging data sets: (a) T2-weighted images alone; (b) T2-weighted images in combination with DW images and corresponding ADC maps (hereafter, T2-weighted and DW imaging); (c) T2-weighted images in combination with DCE images and corresponding parametric maps, as well as fused presentations of T2-weighted images and Ktrans and kep parametric maps (hereafter, T2-weighted and DCE imaging); and (d) T2-weighted images in combination with DW and DCE images and the corresponding ADC and parametric maps from DW and DCE imaging (hereafter, T2-weighted, DW, and DCE imaging). The readers interpreted the data sets in different orders, waiting 4 weeks between the interpretation of each data set. For each sextant (right and left base, midgland, and apex) in each data set, readers evaluated the peripheral zone of the prostate and assigned a score ranging from 1 to 5 regarding the likelihood of the presence of PCa (1, definitely absent; 2, probably absent; 3, indeterminate; 4, probably present; 5, definitely present). Recurrent tumor was defined as a focal nodular area with (a) low signal intensity on T2-weighted images, (b) restricted diffusion on DW images and ADC maps, and (c) rapid enhancement with washout on DCE images, high Ktrans, or kep on parametric maps.
Quantitative Analysis
Four weeks after qualitative assessment of the last data set, one reader (O.F.D) drew regions of interest in each sextant of the prostate that covered the focal area most suspicious for PCa within the sextant based on imaging and biopsy results. If no suspicious area was present, the region of interest was placed in an area of benign-appearing tissue. The areas of the regions of interest and the following quantitative parameters were recorded from ADC maps and DCE parametric maps: mean ADC, Ktrans, and kep.
Reference Standard
Transrectal US-guided biopsy samples (12–20 cores per patient) were interpreted by genitourinary pathologists at our institution. Information from written reports was used for this study. Median time between MR imaging and biopsy was 31 days (range, 1–179 days).
Statistical Analysis
Qualitative assessment.—The Wilcoxon rank sum test for continuous variables and the Fisher exact test for categorical variables were used to examine differences be tween patients with positive biopsy results and those with negative biopsy results.
Analysis of diagnostic accuracy.—Receiver operating characteristic (ROC) curves and empirical areas under the ROC curve (AUCs) were assessed for T2-weighted imaging alone and for each type of MP MR imaging separately for both readers. The methods of DeLong et al (24) were used to compare AUCs for diagnostic accuracy at the patient-based level, and the nonparametric method proposed by Obuchowski (25) was used to compare AUCs at the sextant-based level, taking into account the clustered data. Bonferroni adjustment of P values was used to adjust for multiple comparisons.
With biopsy results as the reference standard, sensitivity, specificity, and positive and negative predictive values along with 95% confidence intervals were calculated, treating scores of 4–5 as indicative of a tumor on MR images. For patient-based analysis, the highest score of all six sextants was considered. For clustered data at the sextant-based level, the 95% confidence interval was estimated by using the method of Zhou et al (26).
Analysis of interreader agreement.—Interreader agreement was assessed by using weighted κ statistics with quadratic weights (27). For clustered data at the sextant-based level, the 95% confidence interval of the κ statistic was estimated by using the bootstrapping technique and resampling the cluster (patient). The κ values were interpreted as follows: 0.00–0.20, slight agreement; 0.21–0.40, fair agreement; 0.41–0.60, moderate agreement; 0.61–0.80, substantial agreement; and 0.81–1.00, almost perfect agreement (28).
Quantitative parameters.—Median and range were summarized for quantitative parameters by biopsy result (positive or negative for cancer) and Gleason score (6, 7, and ≥8). At the patient-based level, the Wilcoxon rank sum test was used to compare quantitative parameters between biopsy groups, and the Kruskal-Wallis test was used to compare the same parameters across Gleason score groups. For analysis at the patient-based level, the data from all sextants were consolidated, and the lowest mean ADC value and the highest Ktrans and kep values were used. At the sextant-based level, generalized estimating equations were used to assess the associations between quantitative parameters, biopsy groups, or Gleason score groups, with an independent correlation structure and a robust covariance matrix. The P value from the score test was reported.
All statistical analyses were performed with SAS 9.2 software (SAS Institute, Cary, NC) and R, version 2.13, software (The R Foundation for Statistical Computing, Vienna, Austria). P < .05 indicated a significant difference.
Results
Biopsy
Recurrent PCa was identified at biopsy in 35 (66%) of 53 patients and 87 (27.4%) of 318 sextants. Gleason scores were 6 (3 + 3) in 13 (14.9%) of the 87 sextants that showed recurrence, 7 (3 + 4) in 20 (23.0%) sextants, 7 (4 + 3) in 13 (14.9%) sextants, 8 (4 + 4) in 12 (13.8%) sextants, 9 (4 + 5) in seven (8.0%) sextants, and 9 (5 + 4) in two (2.3%) sextants. In 20 (23.0%) of 87 sextants and nine (26%) of 35 patients with recurrence, the Gleason score could not be evaluated because of treatment effects. Clinical characteristics did not differ significantly between patients with positive biopsy results and those with negative biopsy results, except for clinical stage at diagnosis (Table 1).
Diagnostic Accuracy
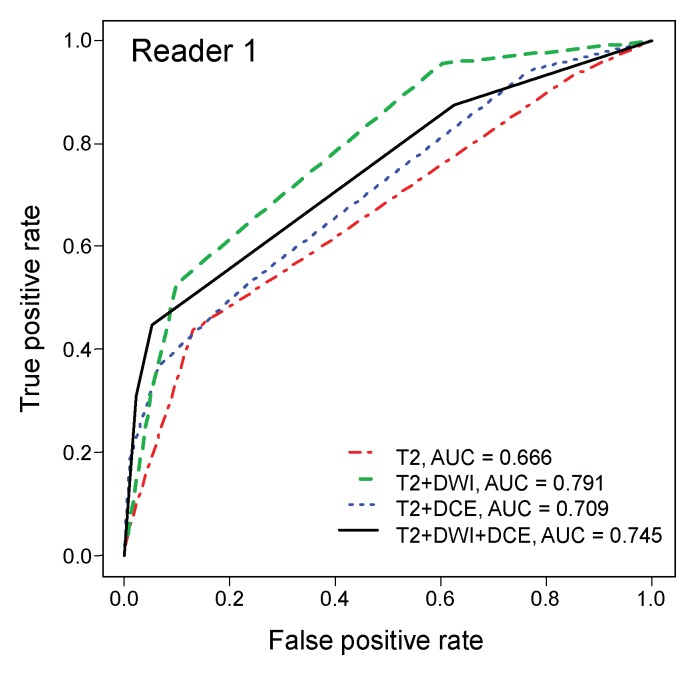
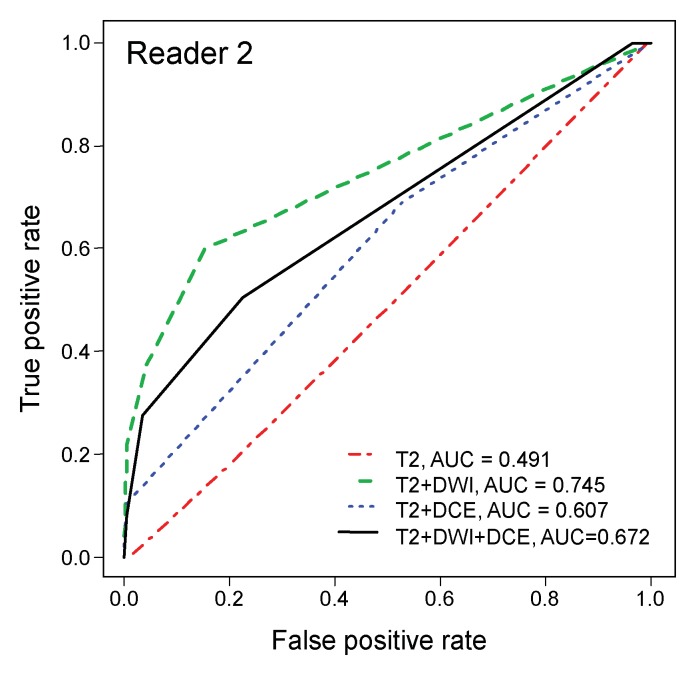
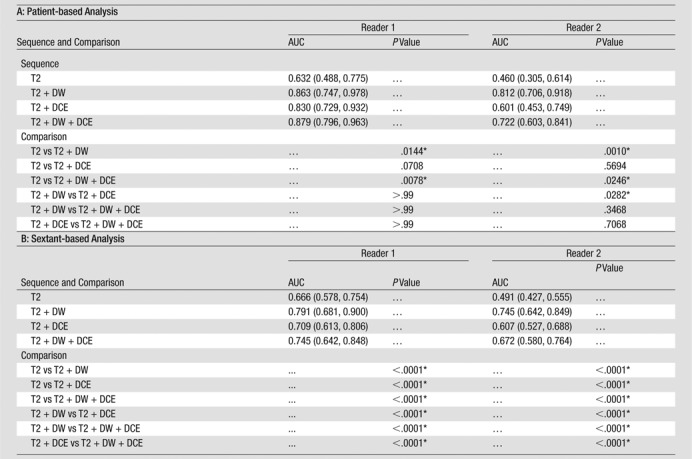
ROC analysis.—On the sextant-based level, diagnostic accuracy was highest when evaluating T2-weighted imaging with DW imaging (AUC of 0.79 and 0.75 for readers 1 and 2, respectively) (Table 2) and lowest when evaluating T2-weighted imaging alone (AUC of 0.67 and 0.49 for readers 1 and 2, respectively) (Fig 2). The differences in the AUCs for T2-weighted and DW imaging and for T2-weighted imaging alone were significant (P < .001) for both readers.
Table 2.
ROC Analysis
Note.— Data in parentheses are 95% confidence intervals. AUCs were estimated and compared on the patient level by using the methods of DeLong et al (24) and on the sextant level by using the methods of Obuchowski (25).
Difference is significant.
Figure 2a:
ROC curves for (a) reader 1 and (b) reader 2 for diagnostic accuracy on a sextant-based level.
Figure 2b:
ROC curves for (a) reader 1 and (b) reader 2 for diagnostic accuracy on a sextant-based level.
At patient-based analysis, diagnostic accuracy was highest with T2-weighted, DW, and DCE imaging for reader 1 (AUC, 0.88) and with T2-weighted and DW imaging for reader 2 (AUC, 0.81) (Fig 3). T2-weighted, DW, and DCE imaging was not significantly more accurate than T2-weighted and DCE imaging or T2-weighted and DW imaging for either reader. For both readers, AUCs were lowest for T2-weighted imaging alone (AUC of 0.63 and 0.46 for readers 1 and 2, respectively). For reader 2, T2-weighted and DW imaging was significantly more accurate than T2-weighted and DCE imaging (P = .03) (Fig 4).
Figure 3a:
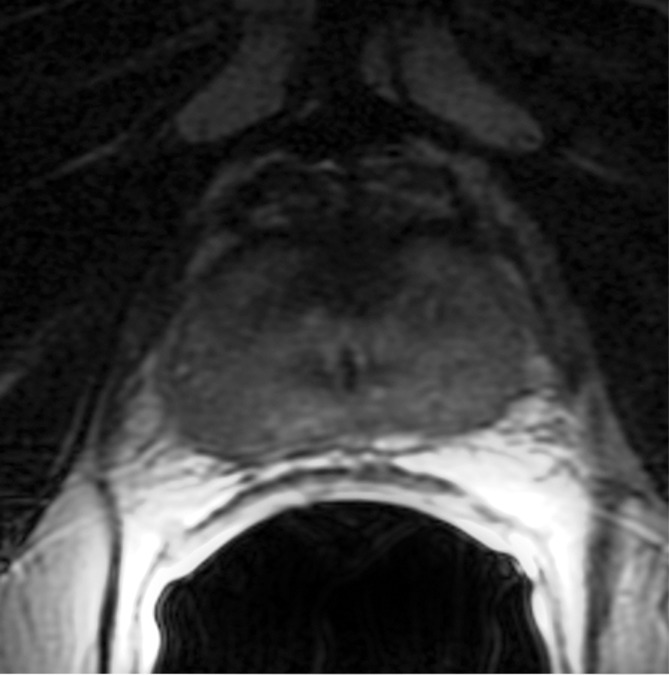
Images obtained in a 69-year-old patient with biopsy-proved PCa (Gleason score, 3 + 4) in the right midgland. (a) Neither reader saw the cancer on the T2-weighted image. On the (b) parametric map of Ktrans, (c) ADC map (b = 0 and 1000 sec/mm2), and (d) fused presentation of a and b, both readers clearly identified the tumor (arrowheads). Note the hypointense peripheral zone on a caused by postradiation changes.
Figure 4a:
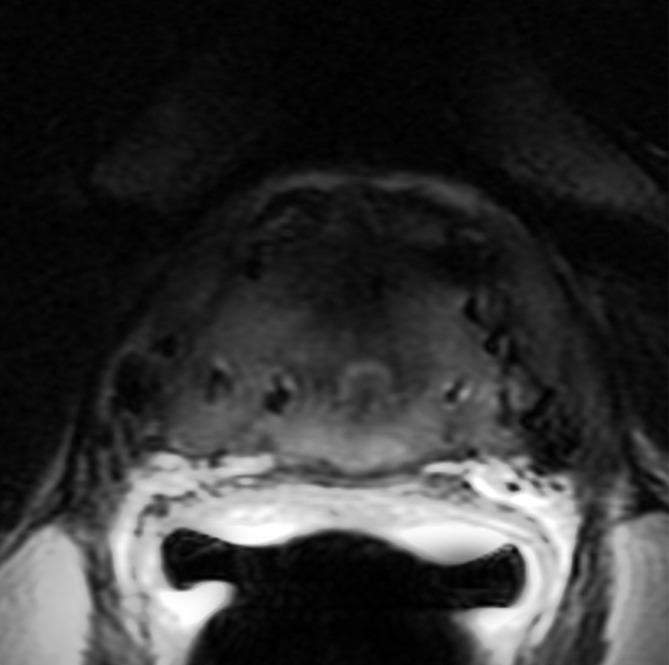
Images obtained in a 62-year-old patient with biopsy-proved PCa (Gleason score, 4+5) in the right apex. The PCa focus was not seen on (a) the T2-weighted image, (b) the parametric map of Ktrans, or (d) the fused presentation of a and b. (c) ADC map (b = 0 and 1000 sec/mm2) shows the tumor (arrowhead), which was identified by both readers.
Figure 3b:
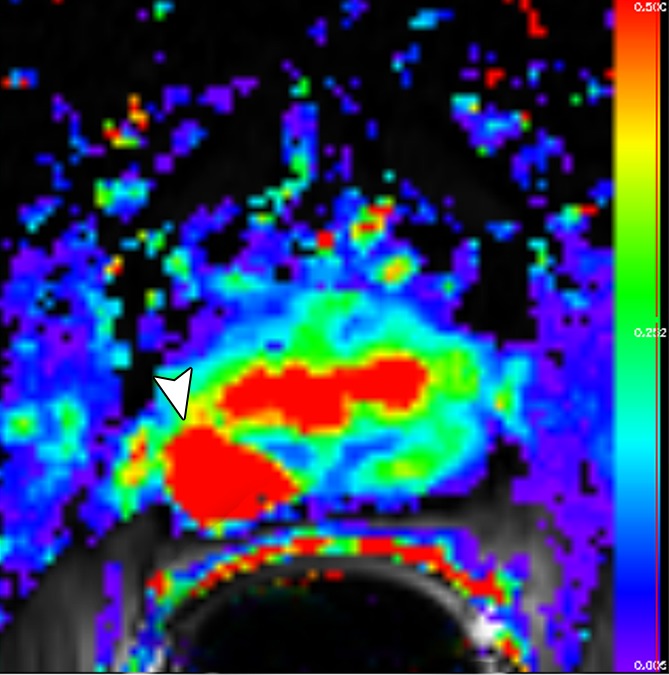
Images obtained in a 69-year-old patient with biopsy-proved PCa (Gleason score, 3 + 4) in the right midgland. (a) Neither reader saw the cancer on the T2-weighted image. On the (b) parametric map of Ktrans, (c) ADC map (b = 0 and 1000 sec/mm2), and (d) fused presentation of a and b, both readers clearly identified the tumor (arrowheads). Note the hypointense peripheral zone on a caused by postradiation changes.
Figure 3c:
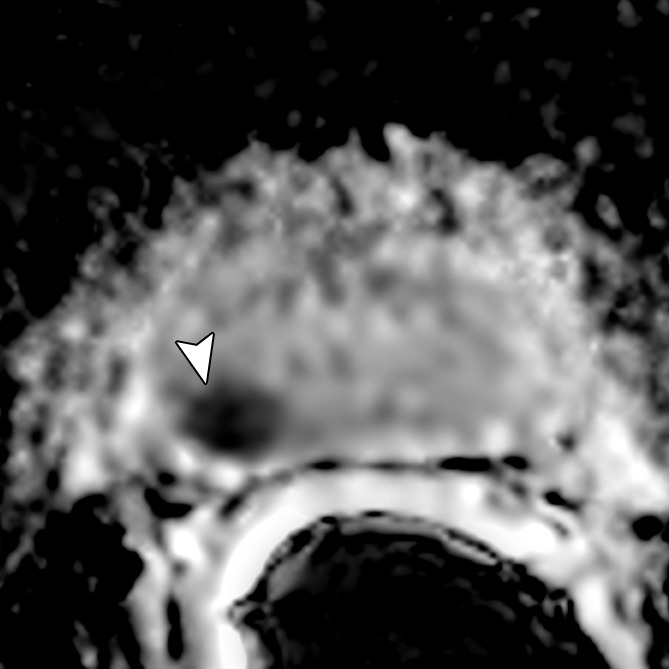
Images obtained in a 69-year-old patient with biopsy-proved PCa (Gleason score, 3 + 4) in the right midgland. (a) Neither reader saw the cancer on the T2-weighted image. On the (b) parametric map of Ktrans, (c) ADC map (b = 0 and 1000 sec/mm2), and (d) fused presentation of a and b, both readers clearly identified the tumor (arrowheads). Note the hypointense peripheral zone on a caused by postradiation changes.
Figure 3d:
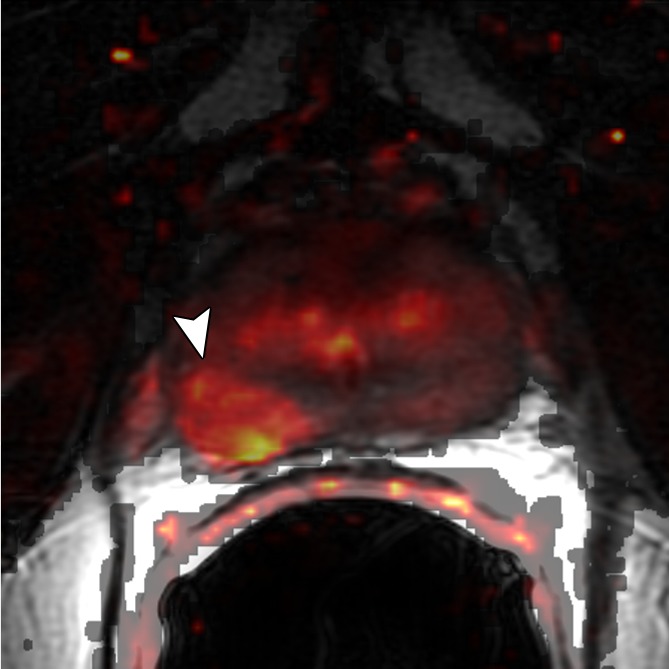
Images obtained in a 69-year-old patient with biopsy-proved PCa (Gleason score, 3 + 4) in the right midgland. (a) Neither reader saw the cancer on the T2-weighted image. On the (b) parametric map of Ktrans, (c) ADC map (b = 0 and 1000 sec/mm2), and (d) fused presentation of a and b, both readers clearly identified the tumor (arrowheads). Note the hypointense peripheral zone on a caused by postradiation changes.
Figure 4b:
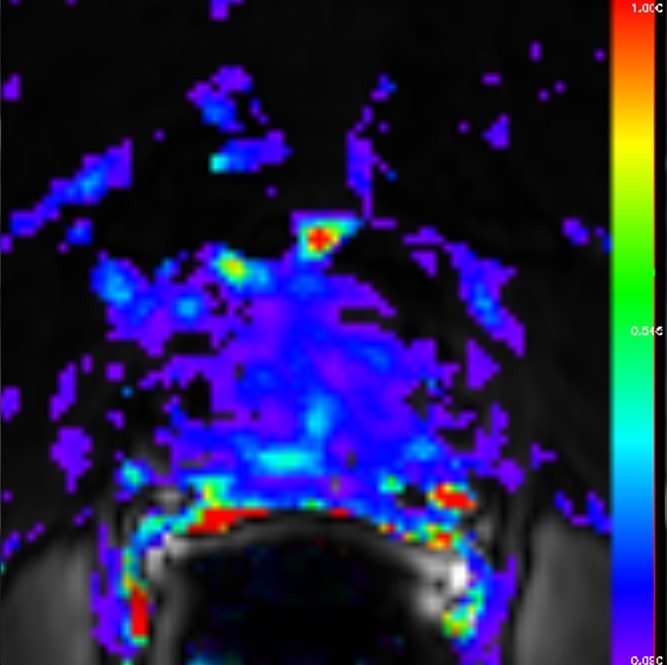
Images obtained in a 62-year-old patient with biopsy-proved PCa (Gleason score, 4+5) in the right apex. The PCa focus was not seen on (a) the T2-weighted image, (b) the parametric map of Ktrans, or (d) the fused presentation of a and b. (c) ADC map (b = 0 and 1000 sec/mm2) shows the tumor (arrowhead), which was identified by both readers.
Figure 4c:
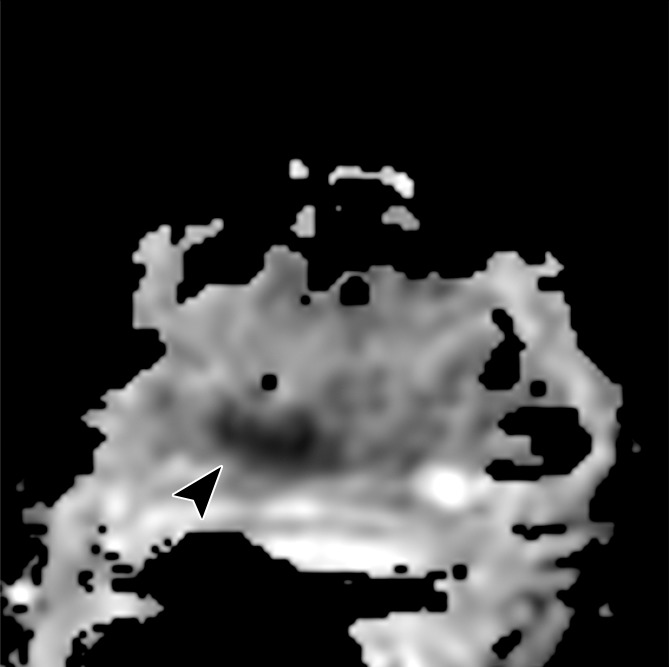
Images obtained in a 62-year-old patient with biopsy-proved PCa (Gleason score, 4+5) in the right apex. The PCa focus was not seen on (a) the T2-weighted image, (b) the parametric map of Ktrans, or (d) the fused presentation of a and b. (c) ADC map (b = 0 and 1000 sec/mm2) shows the tumor (arrowhead), which was identified by both readers.
Figure 4d:
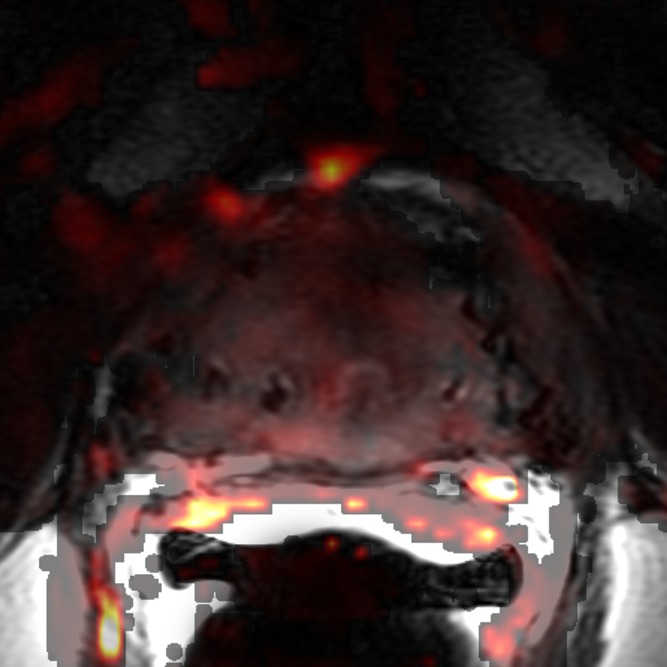
Images obtained in a 62-year-old patient with biopsy-proved PCa (Gleason score, 4+5) in the right apex. The PCa focus was not seen on (a) the T2-weighted image, (b) the parametric map of Ktrans, or (d) the fused presentation of a and b. (c) ADC map (b = 0 and 1000 sec/mm2) shows the tumor (arrowhead), which was identified by both readers.
Sensitivity, specificity, and positive and negative predictive values.—For reader 1, T2-weighted and DW imaging yielded the highest sensitivity at sextant- and patient-based analyses (0.829 and 0.529, respectively) (Table 3). For reader 2, patient-based sensitivity was highest with T2-weighted and DCE imaging (0.629), while sextant-based sensitivity was highest with T2-weighted and DW imaging (0.379). Positive predictive value was highest with T2-weighted, DW, and DCE imaging for reader 1 (0.765 and 0.962 at sextant- and patient-based analyses, respectively) and with T2-weighted and DW imaging for reader 2 (0.767 and 0.95 at sextant- and patient-based levels, respectively). At sextant- and patient-based analyses, both readers reported the highest negative predictive value with T2-weighted and DW imaging (reader 1, 0.835 and 0.727; reader 2, 0.804 and 0.515, respectively).
Table 3.
Diagnostic Accuracy
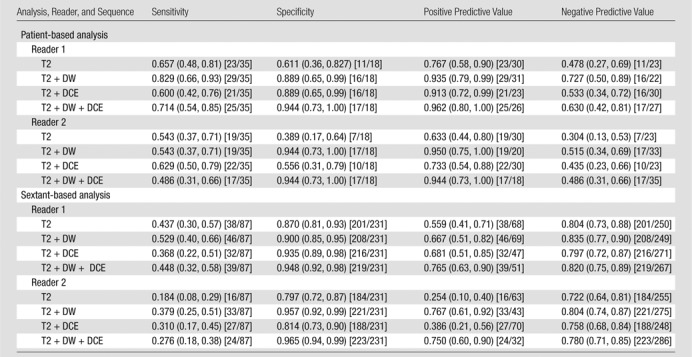
Note.— Data in parentheses are 95% confidence intervals. Data in brackets were used to calculate the statistics.
Interreader Agreement
At both sextant- and patient-based analyses, interreader agreement was highest for T2-weighted and DW imaging and lowest for T2-weighted imaging alone. On the sextant-based level, interreader agreement was slight for evaluation of T2-weighted imaging alone (κ = 0.20), fair for evaluation of T2-weighted and DCE imaging (κ = 0.34), and moderate for evaluation of T2-weighted and DW imaging (κ = 0.55), as well as for evaluation of T2-weighted, DW, and DCE imaging (κ = 0.49). On a patient-based level, interreader agreement was slight for evaluation of T2-weighted imaging alone (κ = 0.17), fair for evaluation of T2-weighted and DCE imaging (κ = 0.32), moderate for T2-weighted, DW, and DCE imaging (κ = 0.58), and substantial for evaluation of T2-weighted and DW imaging (κ = 0.63).
Quantitative Parameters
The median area of regions of interest placed on ADC maps was 20 mm2 (range, 19.5–25.6 mm2) and 20 mm2 (4.3–88.4 mm2) in sextants with negative and positive biopsy results, respectively. The median areas of regions of interest on DCE parametric maps were 33.2 mm2 (range, 24.4–53.0 mm2) and 63.3 mm2 (range, 17.5–200 mm2) in sextants with negative and positive biopsy results, respectively. DW imaging data in three patients were excluded from analysis due to severe susceptibility artifacts.
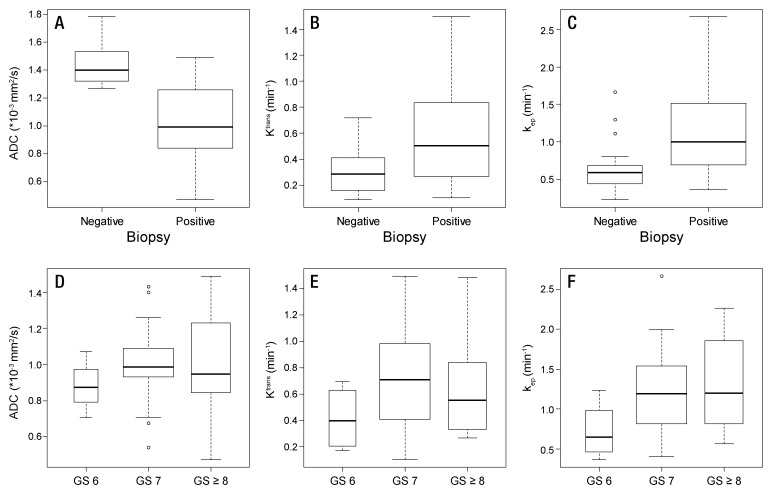
Median ADC values of benign prostatic regions were significantly higher than median ADC values of cancerous regions at both the per-patient level (P < .0001) and the per-sextant level (P < .0001) (Table 4). Median Ktrans and kep values of benign prostatic regions were significantly lower than median Ktrans and kep values of cancerous regions at both the per-patient level (P = .0233 and P = .0025, respectively) and the per-sextant level (P = .0002 and P = .0001, respectively) (Table 4). No significant associations were found between Gleason scores and median ADC, Ktrans, or kep values (P values ranged from .19 to .77) (Table 4, Fig 5). Overall, the same trends were observed when we performed subgroup analysis according to field strength (1.5 T vs 3.0 T) and prior hormonal treatment; however, statistical significance was lost in some of the comparisons, possibly because of the small sample size in certain subgroups (Tables E1, E2; Figs E1, E2 [online]).
Table 4.
Quantitative Parameters
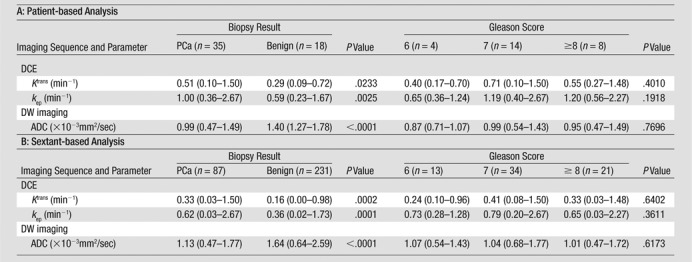
Note.— Unless otherwise indicated, data are means, and data in parentheses are the range.
Figure 5:
Box plots of quantitative parameters (A and C, ADC; B and E, Ktrans; C and F, kep) in benign and malignant prostatic tissue (A–C) and different Gleason scores (D–F). Box plots displayed were calculated on a per-patient basis. Horizontal line = median, boundaries of the box = first and third quantiles, whiskers = mininimum and maximum values.
Discussion
We found that the best overall diagnostic accuracy and the highest interreader agreement in the detection of recurrent PCa after RT were achieved with a combination of T2-weighted and DW imaging. The addition of DCE MR imaging to these sequences did not significantly improve accuracy in the detection of recurrent PCa.
Prior studies have been performed to evaluate the role of a multiparametric MR imaging approach in the detection of PCa recurrence after radiation therapy (10–12); however, to our knowledge, no studies have been performed to compare the diagnostic performance of all possible combinations of T2-weighted, DW, and DCE sequences. Tamada et al (10) reported a significant increase in sensitivity from 27% in the evaluation of T2-weighted imaging alone to 77% in the evaluation of T2-weighted, DW, and DCE imaging together. Only 16 patients were assessed in consensus (thus, evaluation of interreader agreement was not possible), and no ROC or quantitative analyses were performed. Arumainayagam et al (12) reported similar findings in 13 patients with ROC analysis. The AUCs in the detection of post-RT PCa recurrence with the combination of T2-weighted imaging with DW and DCE imaging in that study (0.77 and 0.89 for two independent readers) were similar to those in our study (0.72 and 0.88 for two independent readers). Akin et al (11) found that T2-weighted imaging with DW and DCE imaging yielded significantly higher diagnostic accuracy than did T2-weighted imaging alone. Their reported AUCs (0.95 and 0.86 for two independent readers) were slightly higher than ours, possibly due to the presence of lower-grade tumors in our study population (four patients with a Gleason score of 3+3 vs no patient with a Gleason score of 3+3 in the Akin et al study [11]). Our sensitivities were slightly lower than those reported in the literature (10,11), possibly as a result of the inclusion of patients with a mild increase in PSA without fulfilling the Phoenix criteria for biochemical recurrence and a larger proportion of patients with a lower Gleason score.
Although usually considered part of the multiparametric prostate MR imaging protocol, the incremental value of DCE MR imaging over that of other MR imaging sequences in the detection of recurrent PCa after RT has not been shown. Our results suggest that in this clinical context, DCE MR imaging may be omitted from the multiparametric MR protocol without hindering diagnostic performance, thereby eliminating the risks and costs associated with the intravenous administration of gadolinium-based contrast agents. However, DCE MR imaging can be helpful, especially in patients with seed placement after brachytherapy, as DW imaging is prone to susceptibility artifacts and distortion in these cases. This is substantiated by the fact that we had to exclude three patients from quantitative analysis with DW imaging because of such artifacts.
Another advantage of MP MR imaging is improvement of interreader agreement. In our study, κ values for all possible variations of MP MR imaging were higher than those for T2-weighted imaging alone (κ = 0.17–0.20 for T2-weighted imaging alone, κ = 0.55–0.63 for T2-weighted and DW imaging, κ = 0.32–0.34 for T2-weighted and DCE imaging, and κ = 0.49–0.58 for T2-weighted, DW, and DCE imaging). Although our interreader agreement for evaluation of T2-weighted imaging alone was lower than values reported in the literature (11,16), for combinations of MP MR imaging, interreader agreement was comparable to that in other studies (11,12). The assessment of tumor detection and localization and the differentiation of viable tumor from treated tumor is notoriously difficult on T2-weighted images (19).
Moreover, we validated the findings of Akin et al (11) by showing that quantitative assessment of MP MR imaging–derived parameters (ADC from DW imaging, Ktrans and kep from DCE imaging) can be useful in the differentiation of areas of benign prostatic tissue from foci containing PCa. We attempted to build on this finding by assessing the association between quantitative MP MR imaging parameters and the Gleason score, a strong prognostic factor that features prominently in all risk stratification systems used to guide care of patients with primary PCa (eg, D’Amico scoring system [29] and Epstein criteria [30]). Although the Gleason score has been shown to correlate with quantitative MP MR imaging parameters in the untreated prostate (31–34), we did not find a significant association between the Gleason score and these parameters in irradiated prostates. The lack of association between MP MR imaging parameters and aggressiveness may partly be due to the reference standard used or the small sample size. Although pathologic analysis is typically the preferred reference standard, adequate determination of Gleason scores at pathologic analysis in the irradiated prostate may be inaccurate due to treatment effects (7,8).
Our study had several limitations. First, this was a retrospective analysis of patients who presented over more than 3 years. While changes in MR imaging parameters during this period were not substantial, they may have affected quantitative analysis. Second, while we used standard acquisition parameters (35), variations in imaging protocols (different b values for DW imaging or temporal resolution for DCE imaging) may have affected imaging results. Third, although our readers were blinded to clinical details and breaks of at least 4 weeks were maintained between readings, there may have been some recall bias. We attempted to control for this by alternating the order in which each reader evaluated the different data sets. Fourth, we used transrectal US–guided biopsy and not step-section pathologic analysis of prostatectomy specimens as the reference standard. Biopsy has known limitations in the localization of PCa (36); however, the exclusion of patients suspected of having post-RT recurrence who did not undergo salvage prostatectomy would have introduced further bias. Fifth, MR spectroscopy was not included in our multiparametric MR imaging protocol, as it is not routinely used in our institution for this clinical setting. Thus, comparisons with recent reports (37) could not be drawn. Finally, the two readers in this study had a special interest in genitourinary imaging and dedicated training in the interpretation of prostate MR images; therefore, the results might not be applicable to every radiologist.
Advances in Knowledge.
• The evaluation of T2-weighted MR imaging in combination with diffusion-weighted (DW) MR imaging resulted in significantly better diagnostic accuracy (AUC of 0.79-0.86 for reader 1 and 0.75-0.81 for reader 2) than assessment of T2-weighted imaging alone (AUC of 0.63-0.67 for reader 1 and 0.46-0.49 for reader 2).
• The addition of dynamic contrast-enhanced (DCE) MR imaging to T2-weighted and DW imaging did not contribute significant incremental value in the detection of locally recurrent prostate cancer after radiation therapy for either reader (reader 1, P > .99; reader 2, P = 0.35) in this study.
• Interreader agreement in the detection of locally recurrent prostate cancer was higher when T2-weighted images were evaluated in combination with functional techniques (T2-weighted imaging with DW imaging, κ = 0.55-0.63; T2-weighted imaging with DCE imaging, κ = 0.32-0.34; T2-weighted imaging with DW and DCE imaging, κ = 0.49-0.58) than when T2-weighted images were evaluated alone (κ = 0.17-0.20).
• There was a significant difference of median apparent diffusion coefficient (ADC), volume transfer constant (Ktrans), and rate constant (kep) between benign prostatic tissue and PCa (P < .0001 to P = 0.023); Gleason score was not significantly associated with ADC, Ktrans, or kep in our patient population, with recurrent prostate cancer after radiation therapy (P = .19-.77).
Implication for Patient Care.
• In the detection of locally recurrent prostate cancer in patients who underwent radiation therapy, the combination of T2-weighted imaging with DW imaging appears to be the optimal approach, as the further addition of DCE MR imaging sequences to this combination did not result in incremental value in this study; T2-weighted imaging with DW imaging also yielded higher interreader agreement than any other combination tested.
Supplemental Figures and Tables
Acknowledgments
We thank Katharine Ristich, BA, and Ada Muellner, MS, for editing the manuscript.
Received September 24, 2012; revision requested October 31; revision received December 12; accepted December 27; final version accepted January 7, 2013.
O.F.D. supported by the Swiss National Science Foundation and the Swiss Radiological Society. H.A.V. and O.F.D. supported by the Peter Michael Foundation.
Current address: Department of Radiology, Konkuk University Medical Center, Konkuk University School of Medicine, Seoul, Korea.
Disclosures of Conflicts of Interest: O.F.D. No relevant conflicts of interest to disclose. S.I.J. No relevant conflicts of interest to disclose. H.A.V. No relevant conflicts of interest to disclose. D.H.G. No relevant conflicts of interest to disclose. J.Z. No relevant conflicts of interest to disclose. C.S.M. No relevant conflicts of interest to disclose. H.H. No relevant conflicts of interest to disclose. M.J.Z. No relevant conflicts of interest to disclose. O.A. No relevant conflicts of interest to disclose.
Abbreviations:
- ADC
- apparent diffusion coefficient
- AUC
- area under the ROC curve
- DCE
- dynamic contrast material enhanced
- DW
- diffusion weighted
- kep
- rate constant
- Ktrans
- volume transfer constant
- MP
- multiparametric
- PCa
- prostate cancer
- PSA
- prostate-specific antigen
- ROC
- receiver operating characteristic
- RT
- radiation therapy
References
- 1.Dearnaley DP, Sydes MR, Graham JD, et al. Escalated-dose versus standard-dose conformal radiotherapy in prostate cancer: first results from the MRC RT01 randomised controlled trial. Lancet Oncol 2007;8(6):475–487. [DOI] [PubMed] [Google Scholar]
- 2.Caloglu M, Ciezki J. Prostate-specific antigen bounce after prostate brachytherapy: review of a confusing phenomenon. Urology 2009;74(6):1183–1190. [DOI] [PubMed] [Google Scholar]
- 3.Horwitz EM, Levy LB, Thames HD, et al. Biochemical and clinical significance of the posttreatment prostate-specific antigen bounce for prostate cancer patients treated with external beam radiation therapy alone: a multiinstitutional pooled analysis. Cancer 2006;107(7):1496–1502. [DOI] [PubMed] [Google Scholar]
- 4.Vicini FA, Vargas C, Abner A, Kestin L, Horwitz E, Martinez A. Limitations in the use of serum prostate specific antigen levels to monitor pa tients after treatment for prostate cancer. J Urol 2005;173(5):1456–1462. [DOI] [PubMed] [Google Scholar]
- 5.Stewart CS, Leibovich BC, Weaver AL, Lieber MM. Prostate cancer diagnosis using a saturation needle biopsy technique after previous negative sextant biopsies. J Urol 2001;166(1):86–91; discussion 91–92. [PubMed] [Google Scholar]
- 6.Boukaram C, Hannoun-Levi JM. Management of prostate cancer recurrence after definitive radiation therapy. Cancer Treat Rev 2010;36(2):91–100. [DOI] [PubMed] [Google Scholar]
- 7.Algaba F, Epstein JI, Aldape HC, et al. Assessment of prostate carcinoma in core needle biopsy: definition of minimal criteria for the diagnosis of cancer in biopsy material. Cancer 1996;78(2):376–381. [DOI] [PubMed] [Google Scholar]
- 8.Humphrey PA. Gleason grading and prognostic factors in carcinoma of the prostate. Mod Pathol 2004;17(3):292–306. [DOI] [PubMed] [Google Scholar]
- 9.Hoeks CM, Barentsz JO, Hambrock T, et al. Prostate cancer: multiparametric MR imaging for detection, localization, and staging. Radiology 2011;261(1):46–66. [DOI] [PubMed] [Google Scholar]
- 10.Tamada T, Sone T, Jo Y, et al. Locally recurrent prostate cancer after high-dose-rate brachytherapy: the value of diffusion-weighted imaging, dynamic contrast-enhanced MRI, and T2-weighted imaging in localizing tumors. AJR Am J Roentgenol 2011;197(2):408–414. [DOI] [PubMed] [Google Scholar]
- 11.Akin O, Gultekin DH, Vargas HA, et al. Incremental value of diffusion weighted and dynamic contrast enhanced MRI in the detection of locally recurrent prostate cancer after radiation treatment: preliminary results. Eur Radiol 2011;21(9):1970–1978. [DOI] [PMC free article] [PubMed] [Google Scholar]
- 12.Arumainayagam N, Kumaar S, Ahmed HU, et al. Accuracy of multiparametric magnetic resonance imaging in detecting recurrent prostate cancer after radiotherapy. BJU Int 2010;106(7):991–997. [DOI] [PubMed] [Google Scholar]
- 13.Haider MA, Chung P, Sweet J, et al. Dynamic contrast-enhanced magnetic resonance imaging for localization of recurrent prostate cancer after external beam radiotherapy. Int J Radiat Oncol Biol Phys 2008;70(2):425–430. [DOI] [PubMed] [Google Scholar]
- 14.Chan TW, Kressel HY. Prostate and seminal vesicles after irradiation: MR appearance. J Magn Reson Imaging 1991;1(5):503–511. [DOI] [PubMed] [Google Scholar]
- 15.Fuchsjäger M, Akin O, Shukla-Dave A, Pucar D, Hricak H. The role of MRI and MRSI in diagnosis, treatment selection, and post-treatment follow-up for prostate cancer. Clin Adv Hematol Oncol 2009;7(3):193–202. [PubMed] [Google Scholar]
- 16.Sala E, Eberhardt SC, Akin O, et al. Endorectal MR imaging before salvage prostatectomy: tumor localization and staging. Radiology 2006;238(1):176–183. [DOI] [PubMed] [Google Scholar]
- 17.Akin O, Hricak H. Imaging of prostate cancer. Radiol Clin North Am 2007;45(1):207–222. [DOI] [PubMed] [Google Scholar]
- 18.Pucar D, Shukla-Dave A, Hricak H, et al. Prostate cancer: correlation of MR imaging and MR spectroscopy with pathologic findings after radiation therapy—initial experience. Radiology 2005;236(2):545–553. [DOI] [PMC free article] [PubMed] [Google Scholar]
- 19.Vargas HA, Wassberg C, Akin O, Hricak H. MR imaging of treated prostate cancer. Radiology 2012;262(1):26–42. [DOI] [PMC free article] [PubMed] [Google Scholar]
- 20.Barrett T, Gill AB, Kataoka MY, et al. DCE and DW MRI in monitoring response to androgen deprivation therapy in patients with prostate cancer: a feasibility study. Magn Reson Med 2012;67(3):778–785. [DOI] [PubMed] [Google Scholar]
- 21.Røe K, Kakar M, Seierstad T, Ree AH, Olsen DR. Early prediction of response to radiotherapy and androgen-deprivation therapy in prostate cancer by repeated functional MRI: a preclinical study. Radiat Oncol 2011;6:65. [DOI] [PMC free article] [PubMed] [Google Scholar]
- 22.Roach M, Hanks G, Thames H, et al. Defining biochemical failure following radiotherapy with or without hormonal therapy in men with clinically localized prostate cancer: recommendations of the RTOG-ASTRO Phoenix Consensus Conference. Int J Radiat Oncol Biol Phys 2006;65(4):965–974. [DOI] [PubMed] [Google Scholar]
- 23.de Bazelaire CM, Duhamel GD, Rofsky NM, Alsop DC. MR imaging relaxation times of abdominal and pelvic tissues measured in vivo at 3.0 T: preliminary results. Radiology 2004;230(3):652–659. [DOI] [PubMed] [Google Scholar]
- 24.DeLong ER, DeLong DM, Clarke-Pearson DL. Comparing the areas under two or more correlated receiver operating characteristic curves: a nonparametric approach. Biometrics 1988;44(3):837–845. [PubMed] [Google Scholar]
- 25.Obuchowski NA. Nonparametric analysis of clustered ROC curve data. Biometrics 1997;53(2):567–578. [PubMed] [Google Scholar]
- 26.Zhou XH, Obuchowski NA, McClish DK. Statistical methods in diagnostic medicine. 2nd ed. New York, NY: Wiley-Interscience, 2011. [Google Scholar]
- 27.Fleiss JL, Cohen J. The equivalence of weighted kappa and the intraclass correlation coefficient as measures of reliability. Educ Psychol Meas 1973;33(3):613–619. [Google Scholar]
- 28.Landis JR, Koch GG. The measurement of observer agreement for categorical data. Biometrics 1977;33(1):159–174. [PubMed] [Google Scholar]
- 29.D’Amico AV, Whittington R, Malkowicz SB, et al. Biochemical outcome after radical prostatectomy, external beam radiation therapy, or interstitial radiation therapy for clinically localized prostate cancer. JAMA 1998;280(11):969–974. [DOI] [PubMed] [Google Scholar]
- 30.Epstein JI, Walsh PC, Carmichael M, Brendler CB. Pathologic and clinical findings to predict tumor extent of nonpalpable (stage T1c) prostate cancer. JAMA 1994;271(5):368–374. [PubMed] [Google Scholar]
- 31.Kobus T, Vos PC, Hambrock T, et al. Prostate cancer aggressiveness: in vivo assessment of MR spectroscopy and diffusion-weighted imaging at 3 T. Radiology 2012;265(2):457–467. [DOI] [PubMed] [Google Scholar]
- 32.Oto A, Yang C, Kayhan A, et al. Diffusion-weighted and dynamic contrast-enhanced MRI of prostate cancer: correlation of quantitative MR parameters with Gleason score and tumor angiogenesis. AJR Am J Roentgenol 2011;197(6):1382–1390. [DOI] [PubMed] [Google Scholar]
- 33.Turkbey B, Shah VP, Pang Y, et al. Is apparent diffusion coefficient associated with clinical risk scores for prostate cancers that are visible on 3-T MR images? Radiology 2011;258(2):488–495. [DOI] [PMC free article] [PubMed] [Google Scholar]
- 34.Vargas HA, Akin O, Franiel T, et al. Diffusion-weighted endorectal MR imaging at 3 T for prostate cancer: tumor detection and assessment of aggressiveness. Radiology 2011;259(3):775–784. [DOI] [PMC free article] [PubMed] [Google Scholar]
- 35.Barentsz JO, Richenberg J, Clements R, et al. ESUR prostate MR guidelines 2012. Eur Radiol 2012;22(4):746–757. [DOI] [PMC free article] [PubMed] [Google Scholar]
- 36.Wefer AE, Hricak H, Vigneron DB, et al. Sextant localization of prostate cancer: comparison of sextant biopsy, magnetic resonance imaging and magnetic resonance spectroscopic imaging with step section histology. J Urol 2000;164(2):400–404. [PubMed] [Google Scholar]
- 37.Westphalen AC, Reed GD, Vinh PP, Sotto C, Vigneron DB, Kurhanewicz J. Multiparametric 3T endorectal MRI after external beam radiation therapy for prostate cancer. J Magn Reson Imaging 2012;36(2):430–437. [DOI] [PMC free article] [PubMed] [Google Scholar]
Associated Data
This section collects any data citations, data availability statements, or supplementary materials included in this article.


