Abstract
Purpose
To investigate the use of quantitative multiphasic contrast material–enhanced magnetic resonance (MR) imaging in differentiating between common benign and malignant histologic subtypes of renal cortical tumors.
Materials and Methods
The institutional review board waived informed consent and approved this retrospective HIPAA-compliant study of 138 patients who underwent preoperative contrast-enhanced MR imaging during the period of January 2004–December 2008. At surgery, 152 renal tumors were identified (77 clear cell, 22 papillary, 18 chromophobe, and 10 unclassified carcinomas; 16 oncocytomas; nine angiomyolipomas). Three readers independently identified and measured the most-enhanced area in each tumor and placed corresponding regions of interest in similar positions on images from the precontrast, corticomedullary, nephrographic, and excretory phases. The percentage change in signal intensity (%SI change) between precontrast imaging and each postcontrast phase was calculated. Interreader agreement was evaluated by using the overall concordance correlation coefficient (OCC). A linear mixed-effects model was used to estimate and compare the trajectories of the means of log %SI change across all phases between the six histologic subtypes.
Results
Interreader agreement was substantial to almost perfect (OCC, 0.77–0.88). The %SI change differed significantly between clear cell carcinomas and papillary and chromophobe carcinomas in all phases of enhancement (P < .0001–.0120). In addition, %SI change was significantly higher in angiomyolipomas than in clear cell carcinomas, but only in the corticomedullary phase (P = .0231). Enhancement did not differ significantly between clear cell carcinoma and oncocytoma in any phase (P = .2081–.6000).
Conclusion
Quantitative multiphase contrast-enhanced MR imaging offers a widely available, reproducible method to characterize several histologic subtypes of renal cortical tumors, although it does not aid differentiation between clear cell carcinomas and oncocytomas.
© RSNA, 2012
Introduction
Renal cortical tumors represent a complex family of neoplasms with unique histopathologic features, cytogenetic defects, and variable clinical behaviors, ranging from the benign oncocytoma to indolent variants of papillary and chromophobe carcinomas to the more aggressive conventional clear cell carcinoma (1–5). Because of increased use of imaging, about 70% of cases of renal cortical tumor are now detected incidentally; both the size and stage of tumors at presentation have been declining, and benign and indolent biologic subtypes represent about 45% of cases (6–15). As a consequence, the management of renal cortical tumors has been undergoing a transformation, with increasing emphasis being placed on minimally invasive approaches that preserve renal tissue and function while achieving optimal oncologic control (14,15).
The changes in the nature of the renal cortical tumors being detected has engendered a need for better characterization of such tumors, as the various tumor subtypes have different clinical implications and demand different therapeutic strategies. The reported accuracy of percutaneous biopsy of renal cortical tumors ranges from 70% to 90% (16–20), and recent advances in imaging and image-guided intervention, as well as cytologic, immunohistochemical, and molecular techniques, might further expand the role of percutaneous biopsy in the diagnosis of renal cortical tumors (20). However, widespread use of biopsy of renal cortical tumors has been controversial in the urology community owing to factors such as (a) the invasiveness and the potential complications of biopsy, (b) the possibility of sampling errors and the dependence on an adequate biopsy sample for analysis, and (c) concerns about how the biopsy information might alter the treatment plan (15).
A potential alternative to increased use of biopsy might lie in the use of diagnostic imaging to characterize renal cortical tumors on the basis of their tissue composition, morphologic features, and/or contrast enhancement patterns (21–32). Doppler ultrasonography, contrast material–enhanced computed tomography, and magnetic resonance (MR) imaging have shown potential for enabling differentiation of clear cell renal carcinomas (which show increased vascular flow and enhance avidly) from papillary and chromophobe carcinomas (which show reduced vascular flow and less enhancement) (21–24,26–28). Yet despite the encouraging early results, imaging diagnosis and particularly differentiation of benign and malignant histologic subtypes of renal cortical tumors remains problematic, and further studies with multiple independent readers are needed to assess the diagnostic performance of imaging in this clinical context. Thus, the purpose of our study was to investigate the use of multiphase contrast-enhanced MR imaging in differentiating between the common benign and malignant histologic subtypes of renal cortical tumors and to evaluate interobserver agreement in the quantitative assessment of contrast enhancement patterns in these tumors.
Materials and Methods
The institutional review board approved this retrospective study and waived the informed consent requirement. The study was compliant with the Health Insurance Portability and Accountability Act.
Patients
A computerized search of institutional urology and radiology databases was performed to identify all patients who met the following search criteria during a 5-year period (January 1st, 2004, through December 31st, 2008): (a) total or partial nephrectomy, (b) preoperative multiphase contrast-enhanced abdominal MR imaging performed within 6 months of surgery, and (c) surgical pathologic evaluation confirming the renal cortical tumor diagnosis. One hundred eighty patients satisfied the inclusion criteria. Exclusion criteria were histologic findings other than renal cell carcinoma, oncocytoma, and angiomyolipoma (one angiosarcoma, one pheochromocytoma, one primitive neuroectodermal tumor, three spindle-cell lesions, three lymphomas, and four metanephric adenomas) and complex cystic lesions (nine multilocular cystic nephroma/mixed epithelial stromal tumors, seven cystic renal cell carcinomas, and 13 benign complex cysts). Thus, one hundred thirty-eight consecutive patients were included in our study (Table 1).
Table 1.
Patient and Tumor Characteristics
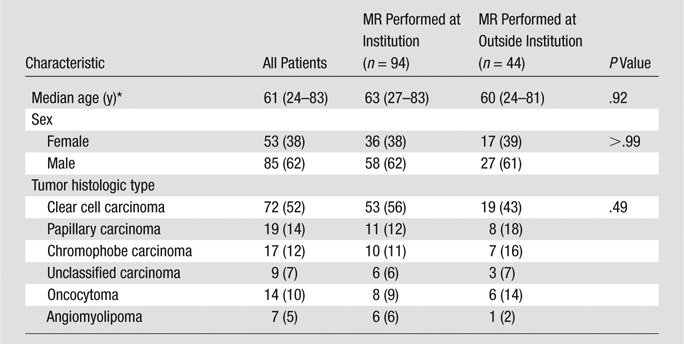
Note.—Unless otherwise indicated, data are numbers of patients, and numbers in parentheses are percentages.
Data in parentheses are the range.
MR Imaging Technique
MR imaging studies were obtained at our institution for 94 patients and were submitted from outside institutions for 44 patients. All MR imaging studies, including those that were obtained outside our institution, were digitized and were available on our picture archiving and communication system (PACS) (Centricity; GE Medical Systems, Milwaukee, Wis).
At our institution, MR imaging was performed with 1.5-T imaging units (GE Medical Systems) by using a phased-array body coil. Owing to the length of the study period, the MR imaging parameters varied slightly as per the standard clinical protocols in place at our institution at the time each examination was performed. However, all MR imaging studies involved the following typical sequences: (a) transverse T1-weighted dual-echo in-phase and out-of-phase sequence: repetition time msec/echo time msec, 210/2.2, 4.4; field of view, 36–44 cm; section thickness, 7–8 mm; intersection gap, 1 mm; and matrix, 256 × 128; (b) transverse and coronal T2-weighted single-shot fast spin-echo sequence: infinite/90–105; field of view, 36–44 cm; section thickness, 4 mm; no intersection gap; and matrix, 256 × 256; (c) and transverse fat-saturated T1-weighted contrast-enhanced three-dimensional spoiled gradient echo sequence: 3.5–3.9/1.6–1.9; field of view, 36–44 cm; interpolated section thickness, 2.5 mm; and matrix, 256–320 × 160–192. Gadopentetate dimeglumine (Magnevist; Berlex Laboratories, Montville, NJ; 0.1 mmol per kilogram of body weight) was injected intravenously at a rate of 2 mL/sec by using a power injector (Medrad, Warrendale, Pa) followed by a 20 mL saline flush. A multiphasic contrast-enhanced MR imaging sequence was performed at four time points: precontrast, corticomedullary phase, nephrographic phase, and excretory phase. Computer software (SmartPrep; GE Medical Systems) was used to synchronize the contrast material administration with the image acquisition. The first postcontrast sequence was acquired 5 seconds after peak arterial enhancement, followed by 70 seconds after contrast material administration and 3–4 minutes after contrast material administration. Subtraction of the precontrast images from the postcontrast images was performed at the console.
The types of MR imaging units and imaging protocols used for the MR imaging studies obtained at other institutions varied; however, one of the authors (H.A.V., not one of the readers) verified that all outside MR imaging studies to be included in the study were consistent with our MR imaging protocol and contained at least the following sequences: T1-weighted dual-echo in-phase and out-of-phase sequence, T2-weighted single-shot fast spin-echo sequence, and multiphase T1-weighted dynamic contrast-enhanced three-dimensional spoiled gradient echo sequence. Regarding the timing of the contrast-enhanced sequences of studies obtained at outside institutions, the mean time between corticomedullary and nephrographic phase acquisitions was 76 seconds (range, 35–146 seconds) and the mean time between corticomedullary and excretory phase acquisition was 180 seconds (range, 72–480 seconds). It was not possible to determine the time from intravenous contrast agent injection to corticomedullary phase acquisition in the outside studies, as the exact time of contrast agent administration was not available.
Image Analysis
Three fellowship-trained genitourinary radiologists (J.C., Y.L., and R.L., with 1, 2, and 10 years of experience, respectively) independently interpreted the MR imaging studies on PACS over a 12-week period. The readers were blinded to the patients’ demographic and clinical information, pathologic results, and original MR imaging readings. Before image interpretation, the readers and one of the authors (O.A.) met and agreed on the MR imaging findings to be recorded and designed a standard data collection form.
The readers recorded the largest tumor dimension. Then they performed region-of-interest (ROI) analysis of tumor enhancement. First, an ROI was placed within the most enhancing region of the tumor on the corticomedullary phase image; next, by using the automatic coregistration tool on PACS and by visual correlation in each case, identical ROIs were placed within the same region of the tumor on precontrast, corticomedullary phase, nephrographic phase, and excretory phase images. The mean size of the ROI placed by each reader was 9.0 mm2, 9.2 mm2, and 11.1 mm2 for the three readers respectively. The mean and the standard deviation of the signal intensity (SI) within the tumor ROIs were recorded separately during each of the four phases. The percentage change in SI (%SI change) was calculated in the three postcontrast phases (corticomedullary, nephrographic, and excretory) relative to the SI in the precontrast phase according to the following formula: [(SIpost − SIpre)/SIpre] × 100, where SIpost is the SI of the ROI on the postcontrast images and SIpre is the SI of the ROI on the precontrast image. A retrospective review of the MR imaging studies in patients with final pathologic results demonstrating angiomyolipomas was performed by one of the authors not involved in the original assessment of tumor enhancement (H.A.V., with 3 years of experience in body MR imaging) to determine their SI characteristics on unenhanced images as well as to identify the presence of fat within these lesions (as defined by signal dropout on the out-of-phase relative to the in-phase images of the T1-weighted dual-echo sequence).
Standard of Reference
The standard of reference was established from the original surgical histopathology report as one of the following six histologic subtypes: clear cell carcinoma, papillary carcinoma, chromophobe carcinoma, unclassified carcinoma, oncocytoma, or angiomyolipoma.
Statistical Methods
Interreader agreement was evaluated by using the overall concordance correlation coefficient (OCC) for continuous variables (33), and the corresponding 95% confidence interval was calculated by using the bootstrapping technique. The scale used for interpretation of the OCC was as follows: slight agreement, less than 0.20; fair agreement, 0.20 to 0.40; moderate agreement, 0.40 to 0.60; substantial agreement, 0.60 to 0.80; and almost perfect agreement, 0.80 to 1.00 (34).
The means and standard deviations of the %SI changes in tumor ROIs were summarized according to histologic tumor subtype for each reader. A linear mixed-effects model was used to estimate and compare the trajectories of log %SI change across all phases between the six histologic tumor subtypes. Age, sex, contrast enhancement phase, histologic tumor subtypes, and the interaction between contrast enhancement phase and histologic tumor subtype were fixed effects. A significant interaction effect reflected that the %SI changes from phase to phase differed between two histologic subtypes. A separate analysis combining the data across all three readers was performed again by using a linear mixed-effects model but this time treating the reader as a random effect with other factors included the same way as in the previous linear mixed effects models.
A difference with a P value of less than .05 was considered statistically significant. All analyses were performed with use of SAS 9.2 (SAS Institute, Cary, NC) and R version 2.9.2 (available at http://www.r-project.org/).
Results
Histologic Subtypes
There were a total of 152 renal cortical tumors (77 clear cell carcinomas, 22 papillary carcinomas, 18 chromophobe carcinomas, 10 unclassified carcinomas, 16 oncocytomas and nine angiomyolipomas) in the 138 patients. Ten patients had more than one renal cortical tumor (three patients with multiple clear cell carcinomas, two with multiple papillary carcinomas, one with multiple chromophobe carcinomas, one with multiple unclassified carcinomas, two with multiple oncocytomas, and one with multiple angiomyolipomas). Of the nine angiomyolipomas, four demonstrated evidence of intralesional fat on opposed-phase dual-echo images. Of these, two were resected, as they coexisted in a patient with a third non–fat-containing T2-hypointense (compared with the adjacent renal cortex) lesion in the same kidney (all three lesions were confirmed as angiomyolipoma at pathologic evaluation). The indication for surgical resection in the other two fat-containing pathologically confirmed angiomyolipomas was recurrent bleeding episodes and inability to discern between an exophytic renal lesion and a fat-containing perinephric lesion (eg, retroperitoneal liposarcoma) on preoperative images. Of the five lipid-poor angiomyolipomas, three measured smaller than 2 cm (two of these were T2 hypointense and one was T2 isointense compared with the adjacent renal cortex). The other two lipid-poor angiomyolipomas were larger than 10 cm and showed heterogeneous SI on T2-weighted images. The possibility of renal and perirenal tumors was considered preoperatively in both cases.
Tumor Size
As measured at MR imaging, the median largest diameters of the 152 tumors were as follows: 3.95 cm (range, 0.8–18.6 cm) for reader 1, 3.90 cm (range, 0.9–18.5 cm) for reader 2, and 3.70 cm (range, 1.0–18.5 cm) for reader 3. Interreader agreement in tumor size measurement was almost perfect (OCC = 0.97; 95% confidence interval: 0.95, 0.99).
ROI Analysis of Tumor Enhancement
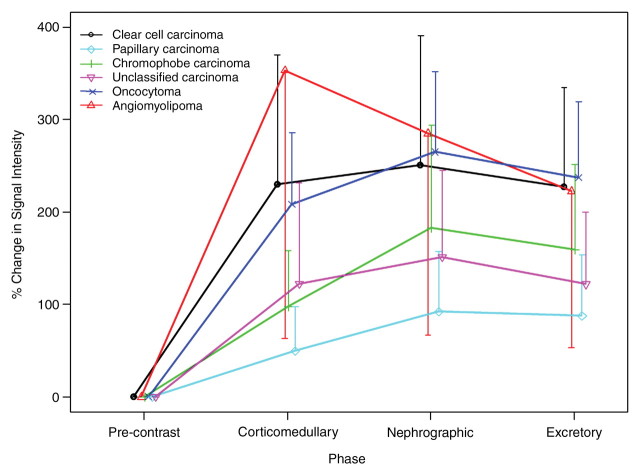
Interreader agreement with regard to %SI change was substantial to almost perfect, with OCCs ranging from 0.77 to 0.88 (Table 2). In all the three postcontrast phases (corticomedullary, nephrographic, and excretory phases), the %SI change relative to the precontrast phase (averaged for all readers) was significantly greater in clear cell carcinoma (230%, 250%, and 227% for corticomedullary, nephrographic, and excretory phases, respectively) than in papillary carcinoma (49%, 92%, and 88% for corticomedullary, nephrographic, and excretory phases, respectively) or chromophobe carcinoma (98%, 183%, and 159% for corticomedullary, nephrographic, and excretory phases, respectively; Table 3). The %SI change was significantly higher in angiomyolipomas than in clear cell carcinomas, but only in the corticomedullary phase (P = .0231). Angiomyolipomas were the only tumor histologic type to demonstrate washout from the corticomedullary to the later phases of enhancement. No significant difference in %SI change was observed between clear cell carcinoma and oncocytoma in any phase of enhancement (P = .2081–.6000).
Table 2.
Interreader Agreement for %SI Change

Note.—Data in parentheses are 95% confidence intervals.
Table 3.
The %SI Change according to Renal Cortical Tumor Subtype at Three Postcontrast Phases of MR Imaging
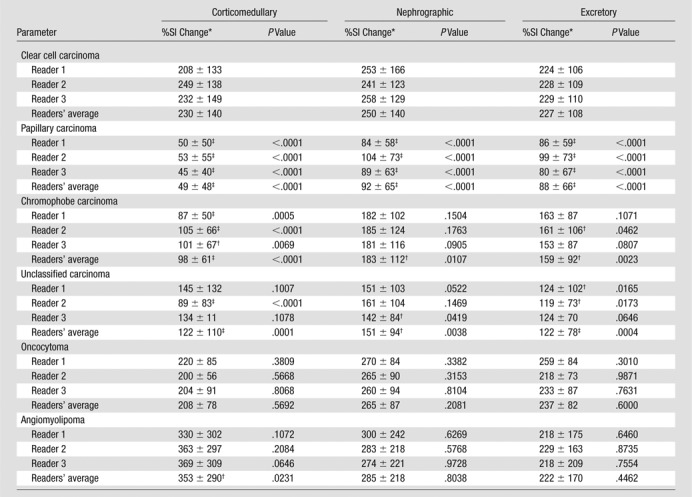
Data are mean percentages ± standard deviation.
P ≤ .001–.05, %SI change significantly different from that of clear cell carcinoma based on the mixed-effects models at the corresponding postcontrast phase.
P < .001, %SI change significantly different from that of clear cell carcinoma based on the mixed-effects models at the corresponding postcontrast phase.
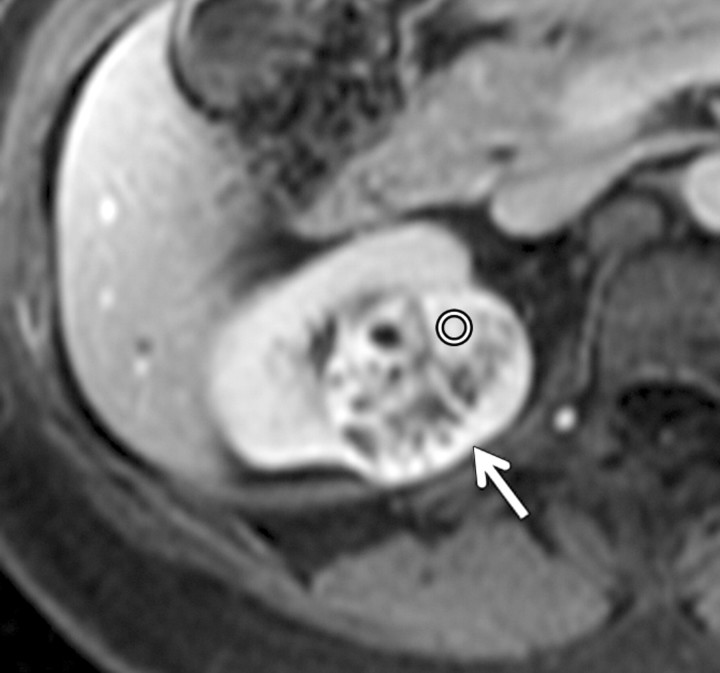
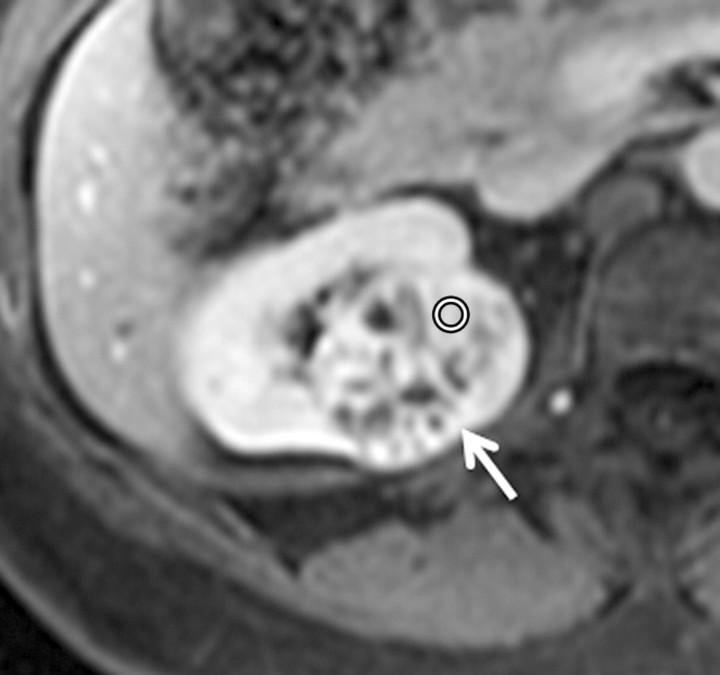
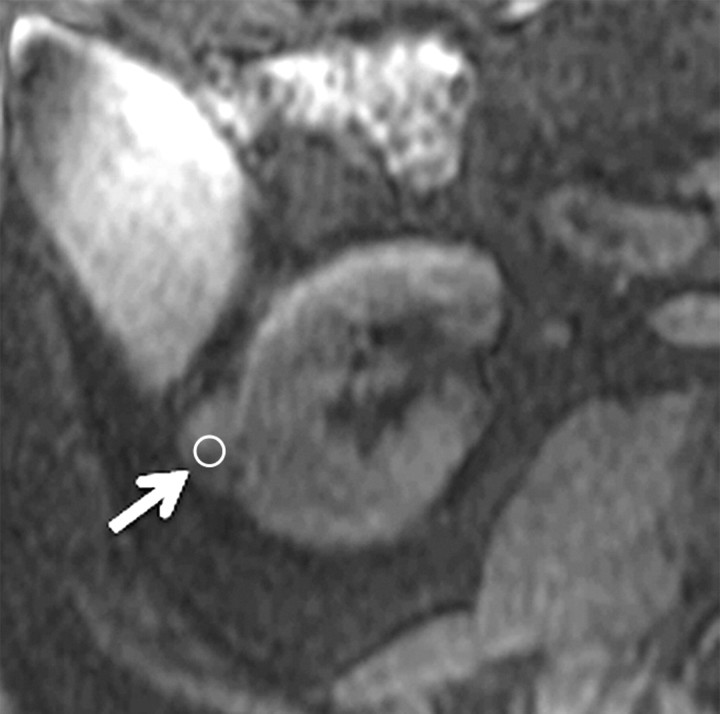
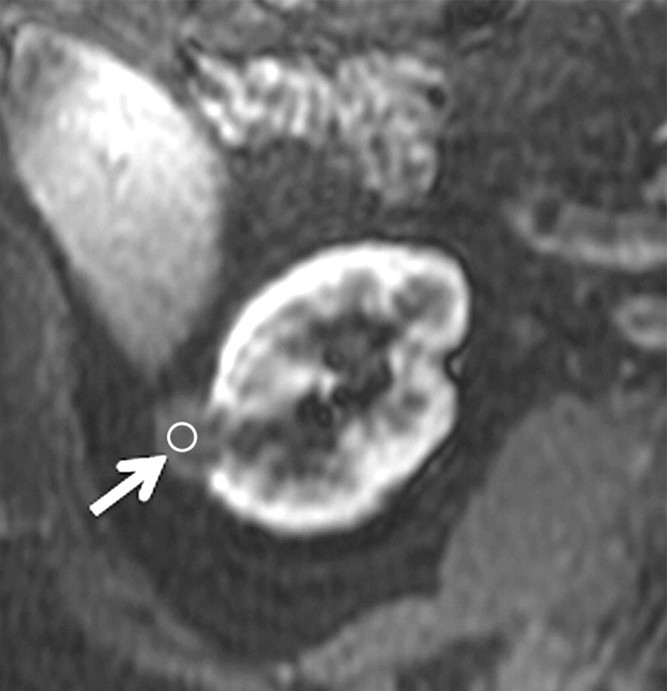
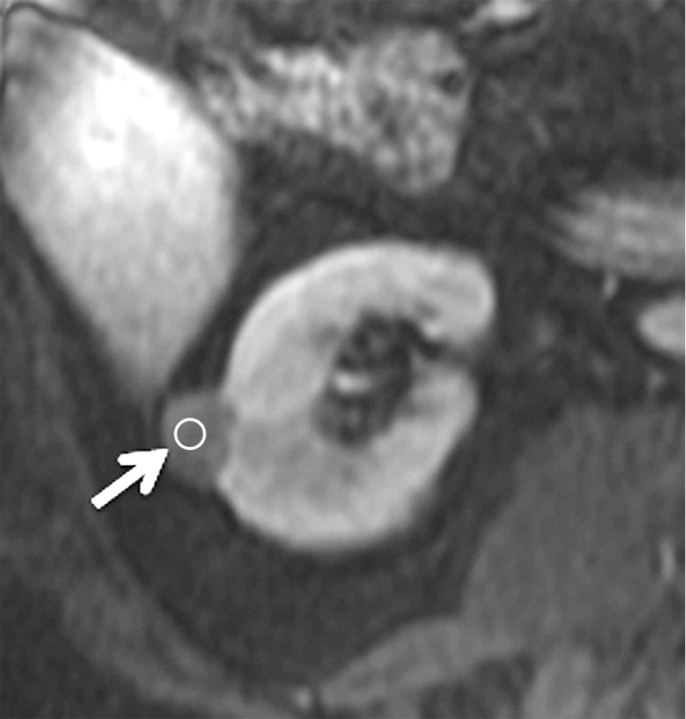
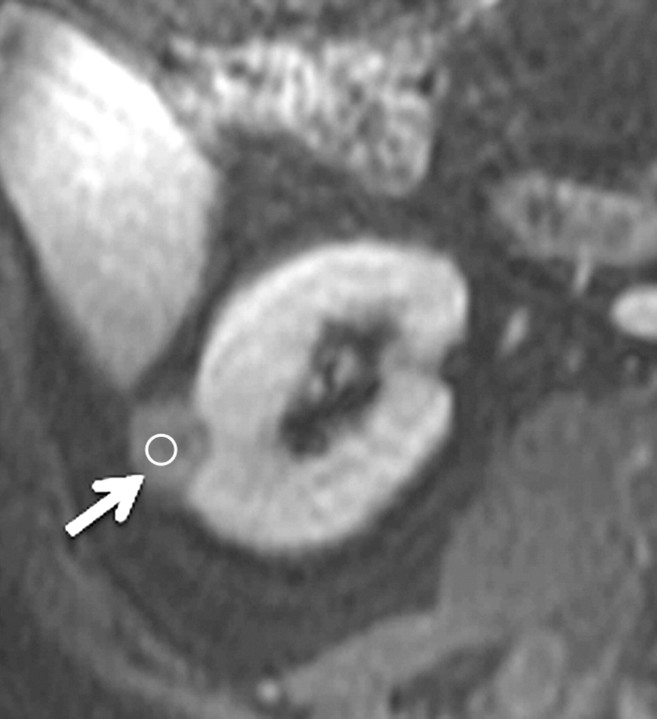
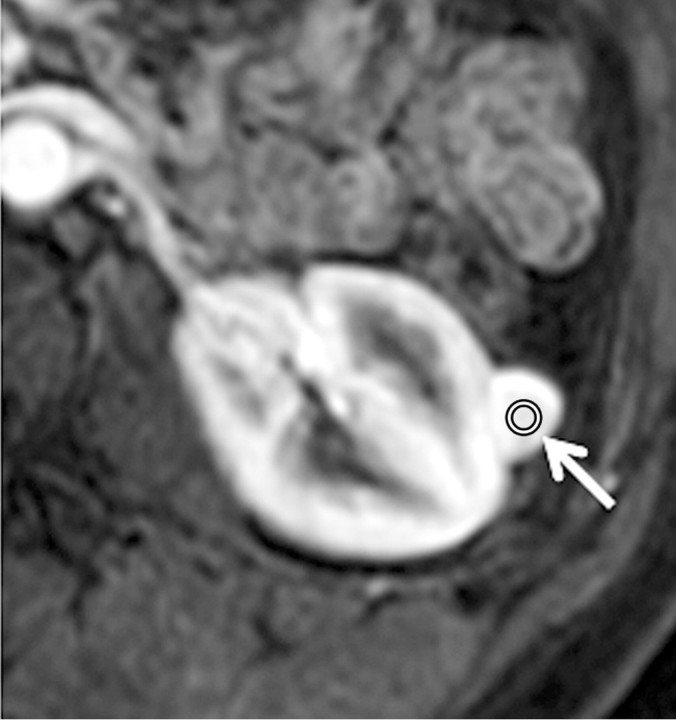
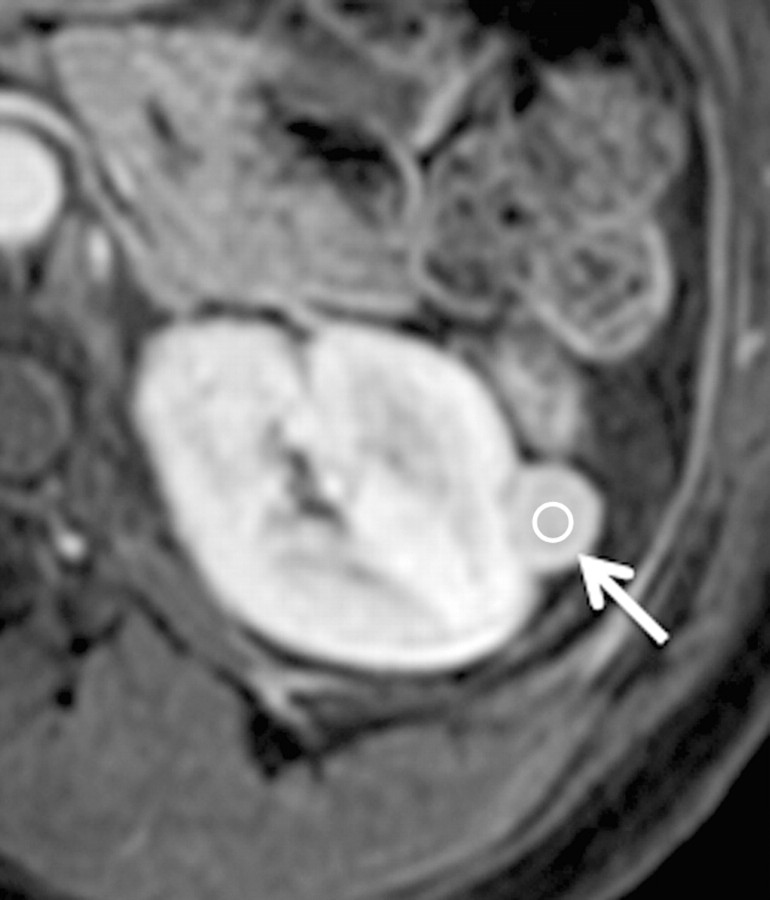
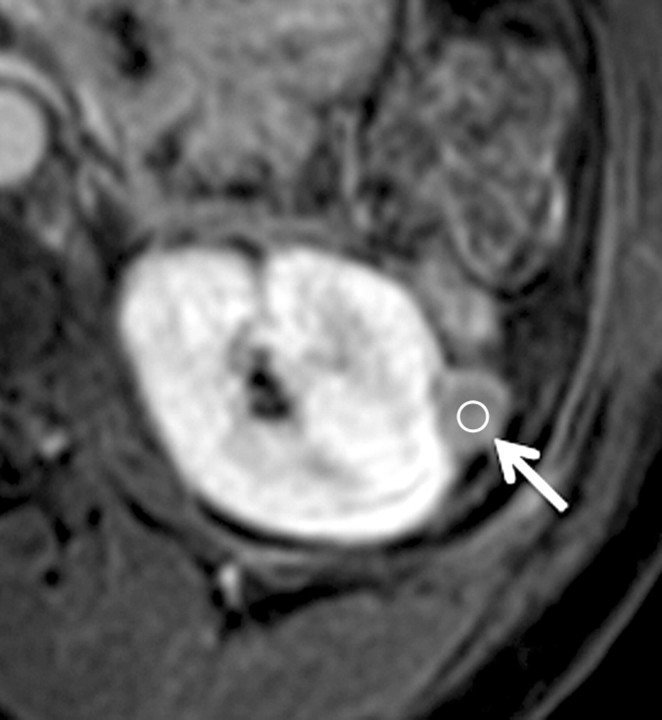
Enhancement in the corticomedullary phase was observed in all histologic subtypes compared with the precontrast images (%SI change: range, 49%–353%) (Figs 1, 2). Angiomyolipomas were the only histologic subtype to show a decrease in %SI change from the corticomedullary to the nephrographic phase of enhancement (SI% change from the precontrast images to the corticomedullary phase of 353% and from the precontrast images to the nephrographic phase of 285%). On the basis of the linear mixed-effects model with the reader as a random effect, chromophobe (P < .0001–.0120), papillary (P < .0001), and unclassified (P = .0001–.0038) carcinomas displayed significantly smaller mean %SI changes than did clear cell carcinoma at all three postcontrast phases. In this model, no association was found between age and mean %SI change (P = .2300). Representative examples from clear cell, papillary, and chromophobe carcinomas as well as angiomyolipomas are shown in Figures 3–5.
Figure 1:
Plot shows the mean %SI change (bars indicate standard error) observed for each renal cortical tumor subtype from the precontrast phase through three postcontrast phases of MR imaging. The data from all three readers were averaged.
Figure 2:
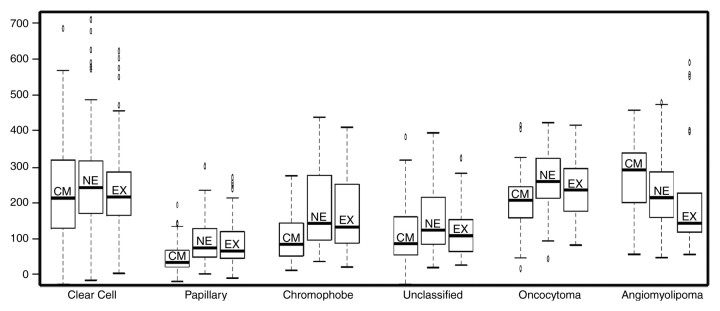
Box-and-whisker plots illustrate the contrast enhancement features of renal cortical tumor histologic types in the corticomedullary (CM), nephrographic (NE), and excretory (EX) phases of enhancement (y-axis indicates %SI change). Box = values from the lower to the upper quartile, horizontal line inside each box = median, horizontal lines outside box = minimum and maximum values, and dots = outlying values.
Figure 3a:
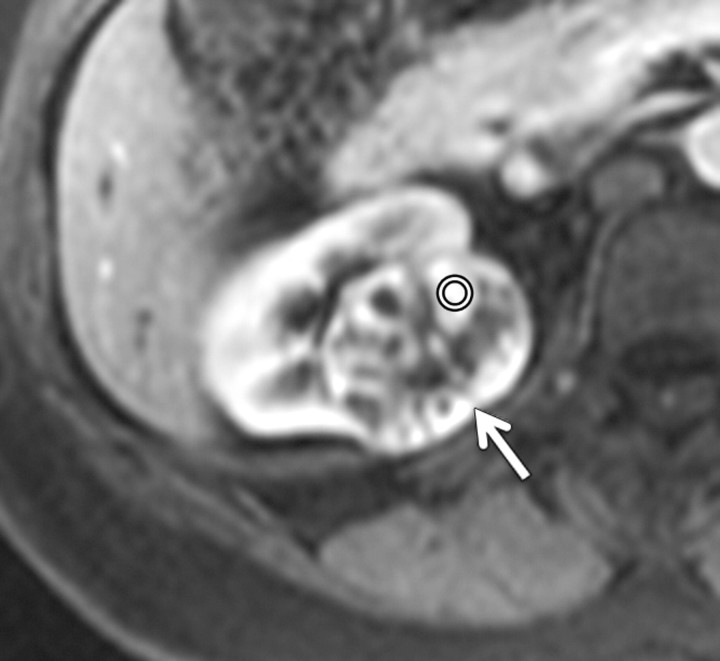
Axial gradient-echo fat-suppressed T1-weighted images (a) before and (b–d) after the administration of gadolinium-based contrast material in the (b) corticomedullary, (c) nephrographic, and (d) excretory phases in a 62-year-old male patient demonstrate a heterogeneously enhanced mass in the upper pole of the right kidney (arrow). The %SI changes from the precontrast to the corticomedullary (455%), nephrographic (510%), and excretory (494%) phases (averaged for all readers) were observed. The final histologic finding was clear cell carcinoma.
Figure 5a:
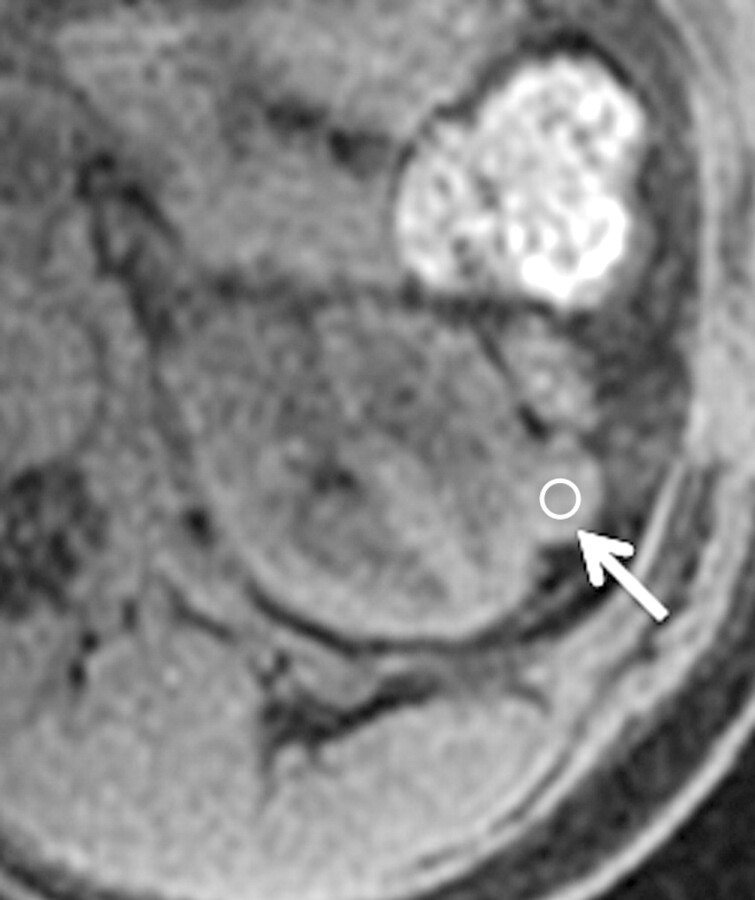
Axial gradient-echo fat-suppressed T1-weighted images (a) before and (b–d) after the administration of gadolinium-based contrast material in the (b) corticomedullary, (c) nephrographic, and (d) excretory phases of enhancement in a 48-year-old female patient demonstrate an enhanced exophytic left renal mass (arrow). The %SI changes from the precontrast to the corticomedullary (%SI change, 1065), nephrographic (%SI change, 804), and excretory (%SI change, 567) phases (averaged for all readers) were observed. The final histologic finding was lipid-poor angiomyolipoma.
Figure 3b:
Axial gradient-echo fat-suppressed T1-weighted images (a) before and (b–d) after the administration of gadolinium-based contrast material in the (b) corticomedullary, (c) nephrographic, and (d) excretory phases in a 62-year-old male patient demonstrate a heterogeneously enhanced mass in the upper pole of the right kidney (arrow). The %SI changes from the precontrast to the corticomedullary (455%), nephrographic (510%), and excretory (494%) phases (averaged for all readers) were observed. The final histologic finding was clear cell carcinoma.
Figure 3c:
Axial gradient-echo fat-suppressed T1-weighted images (a) before and (b–d) after the administration of gadolinium-based contrast material in the (b) corticomedullary, (c) nephrographic, and (d) excretory phases in a 62-year-old male patient demonstrate a heterogeneously enhanced mass in the upper pole of the right kidney (arrow). The %SI changes from the precontrast to the corticomedullary (455%), nephrographic (510%), and excretory (494%) phases (averaged for all readers) were observed. The final histologic finding was clear cell carcinoma.
Figure 3d:
Axial gradient-echo fat-suppressed T1-weighted images (a) before and (b–d) after the administration of gadolinium-based contrast material in the (b) corticomedullary, (c) nephrographic, and (d) excretory phases in a 62-year-old male patient demonstrate a heterogeneously enhanced mass in the upper pole of the right kidney (arrow). The %SI changes from the precontrast to the corticomedullary (455%), nephrographic (510%), and excretory (494%) phases (averaged for all readers) were observed. The final histologic finding was clear cell carcinoma.
Figure 4a:
Axial gradient-echo fat-suppressed T1-weighted images (a) before and (b–d) after the administration of gadolinium-based contrast material in the (b) corticomedullary, (c) nephrographic, and (d) excretory phases of enhancement in a 69-year-old male patient demonstrate a mildly enhanced exophytic right renal mass arrow). The %SI changes from the precontrast to the corticomedullary (69%), nephrographic (118%), and excretory (108%) phases (averaged for all readers) were observed. The final histologic finding was papillary carcinoma.
Figure 4b:
Axial gradient-echo fat-suppressed T1-weighted images (a) before and (b–d) after the administration of gadolinium-based contrast material in the (b) corticomedullary, (c) nephrographic, and (d) excretory phases of enhancement in a 69-year-old male patient demonstrate a mildly enhanced exophytic right renal mass arrow). The %SI changes from the precontrast to the corticomedullary (69%), nephrographic (118%), and excretory (108%) phases (averaged for all readers) were observed. The final histologic finding was papillary carcinoma.
Figure 4c:
Axial gradient-echo fat-suppressed T1-weighted images (a) before and (b–d) after the administration of gadolinium-based contrast material in the (b) corticomedullary, (c) nephrographic, and (d) excretory phases of enhancement in a 69-year-old male patient demonstrate a mildly enhanced exophytic right renal mass arrow). The %SI changes from the precontrast to the corticomedullary (69%), nephrographic (118%), and excretory (108%) phases (averaged for all readers) were observed. The final histologic finding was papillary carcinoma.
Figure 4d:
Axial gradient-echo fat-suppressed T1-weighted images (a) before and (b–d) after the administration of gadolinium-based contrast material in the (b) corticomedullary, (c) nephrographic, and (d) excretory phases of enhancement in a 69-year-old male patient demonstrate a mildly enhanced exophytic right renal mass arrow). The %SI changes from the precontrast to the corticomedullary (69%), nephrographic (118%), and excretory (108%) phases (averaged for all readers) were observed. The final histologic finding was papillary carcinoma.
Figure 5b:
Axial gradient-echo fat-suppressed T1-weighted images (a) before and (b–d) after the administration of gadolinium-based contrast material in the (b) corticomedullary, (c) nephrographic, and (d) excretory phases of enhancement in a 48-year-old female patient demonstrate an enhanced exophytic left renal mass (arrow). The %SI changes from the precontrast to the corticomedullary (%SI change, 1065), nephrographic (%SI change, 804), and excretory (%SI change, 567) phases (averaged for all readers) were observed. The final histologic finding was lipid-poor angiomyolipoma.
Figure 5c:
Axial gradient-echo fat-suppressed T1-weighted images (a) before and (b–d) after the administration of gadolinium-based contrast material in the (b) corticomedullary, (c) nephrographic, and (d) excretory phases of enhancement in a 48-year-old female patient demonstrate an enhanced exophytic left renal mass (arrow). The %SI changes from the precontrast to the corticomedullary (%SI change, 1065), nephrographic (%SI change, 804), and excretory (%SI change, 567) phases (averaged for all readers) were observed. The final histologic finding was lipid-poor angiomyolipoma.
Figure 5d:
Axial gradient-echo fat-suppressed T1-weighted images (a) before and (b–d) after the administration of gadolinium-based contrast material in the (b) corticomedullary, (c) nephrographic, and (d) excretory phases of enhancement in a 48-year-old female patient demonstrate an enhanced exophytic left renal mass (arrow). The %SI changes from the precontrast to the corticomedullary (%SI change, 1065), nephrographic (%SI change, 804), and excretory (%SI change, 567) phases (averaged for all readers) were observed. The final histologic finding was lipid-poor angiomyolipoma.
Discussion
In this study, we investigated the contrast enhancement characteristics of common benign and malignant renal cortical tumors and assessed interobserver agreement in quantitative evaluation of tumor contrast enhancement. We found that ROI analysis of %SI change in the most-enhanced components of renal cortical tumors could provide important diagnostic information. Among malignant renal cortical tumors, chromophobe, papillary, and unclassified carcinomas displayed less enhancement (as indicated by their significantly lower %SI change (P < .0001–.0120) than did clear cell carcinoma at all three postcontrast phases. Among benign renal cortical tumors, angiomyolipoma displayed greater enhancement (higher %SI change) than did clear cell carcinoma only during the corticomedullary phase (P = .0231), while the enhancement of oncocytoma was not significantly different from that of clear cell carcinoma at any postcontrast phase (P = .2081–.6000). Of importance, we also found that ROI analysis of %SI change was a reproducible measurement method. Despite heterogeneity within renal cortical tumors, the readers were able to identify solid enhancing components to place the ROIs and achieved substantial to almost perfect interreader agreement.
The management of renal cortical tumors has undergone a transformation in the past decade. Surgical techniques have been refined with approaches that reduce invasiveness and improve morbidity, and a better understanding of the underlying biology has led to systemic treatment targeted at specific molecular pathways, resulting in major improvements in the control of advanced renal cell carcinoma. In keeping with these changes in clinical management, the role of imaging has also been evolving from detection and staging to better characterization of renal cortical tumors. With the aim of supplementing established imaging criteria based on morphologic features, the vascularity and contrast enhancement features of renal cortical tumors have been investigated for their potential to help identify specific histologic subtypes of these tumors (21–24,26–28). An analysis by Sun et al (28) of MR images from two postcontrast time points (corticomedullary and nephrographic phases) yielded findings similar to ours; specifically, the analysis found that contrast enhancement was greatest in clear cell carcinomas, intermediate in chromophobe carcinomas, and lowest in papillary carcinomas. Our study verified the earlier results and also provided further advances in knowledge. First, whereas our study included three readers, in the study by Sun et al, a single reader performed ROI placement, and thus interreader agreement in the quantitative analysis of tumor enhancement could not be assessed. Second, compared with the study by Sun et al, ours included a wider spectrum of renal cortical tumors and illustrated the contrast enhancement patterns of unclassified carcinomas and the two most common types of benign renal cortical tumors: oncocytomas and angiomyolipomas. Third, taking advantage of a MR imaging protocol that included acquisitions at three postcontrast time points (corticomedullary, nephrographic, and excretory), we were able to depict the delayed enhancement patterns of renal cortical tumors, including the striking finding of marked contrast material washout in angiomyolipomas from the corticomedullary to the excretory phase. However, despite the significant differences in mean enhancement among most histologic subtypes of renal cortical tumors, we must also acknowledge there was also considerable overlap in enhancement features, which precludes the use of specific “cutoffs” or thresholds to definitively establish tumor histologic type.
The potential value of diffusion-weighted (DW) MR imaging for characterizing renal lesions has also been investigated (29–32). A study by Wang et al (31) showed that clear cell carcinomas had significantly higher apparent diffusion coefficients than did papillary or chromophobe carcinomas. Taouli et al (30) reported that in the differentiation of benign and malignant renal lesions, DW MR imaging (area under the receiver operating characteristic curve, 0.85) was less accurate than qualitative assessment of dynamic contrast-enhanced MR imaging (area under the receiver operating characteristic curve, 0.94). Their analysis included benign hemorrhagic cysts and cystic renal cell carcinomas, and all benign and all malignant tumors were grouped and compared, without distinguishing histologic subtypes. We are not aware of any prior studies evaluating the role of DW MR imaging in distinguishing between common benign subtypes (oncocytomas and angiomyolipomas) and malignant subtypes of renal cortical tumors, specifically. Therefore, further studies are needed to compare the diagnostic performances of DW MR imaging and dynamic contrast-enhanced MR imaging in differentiating subtypes of renal cortical tumors. Other imaging techniques, such as monoclonal antibody imaging with positron emission tomography, may also prove useful in this respect (35).
We acknowledge the limitations of our study. First, there was an inherent selection bias, as not all patients with renal cortical tumors at our institution have undergone MR imaging, and of those that have, not all undergo surgery. Also, we did not perform a qualitative assessment of imaging features and therefore we unable to evaluate how this may contribute to differentiating histologic subtypes of renal cortical tumors, particularly if combined with enhancement parameters. Both papillary carcinomas and angiomyolipomas tend to be T2-hypointense compared with the adjacent renal parenchyma, while clear cell carcinomas are iso- to hyperintense (36–38). Furthermore certain features such as the presence of intralesional fat are characteristic of angiomyolipomas. The retrospective nature and the long duration of the study resulted in some heterogeneity in the techniques and parameters used for MR imaging. In addition, to maximize the number of eligible patients, we reviewed all available MR imaging studies, including those submitted from outside institutions. While there was no significant difference in patient demographics and the contrast-enhanced MR sequences used were comparable, we could not determine the effect of different MR imaging techniques on our results. In addition, we were also unable to account for subtle variations in technique over the 5-year study period, and this may be another potential confounding factor affecting the results of our study. To minimize a potential bias from varying dynamic contrast-enhanced MR imaging protocols, we studied the %SI change rather than actual SI values to quantitatively assess tumor enhancement in the three postcontrast phases. Also, given the heterogeneous nature of some renal cortical tumors, quantitative analysis based on the enhancement characteristics of the entire tumor (as opposed the most-enhancing portion only), although more labor-intensive and time-consuming, may provide added value in this respect. Finally, although the clinical multiphase contrast-enhanced MR imaging protocol used in our study provides good spatial resolution that facilitates tumor detection and assessment of anatomy (eg, vessels, lymph nodes, and adjacent organs) for tumor staging, kinetic approaches based on dynamic acquisitions with high temporal resolution could offer better characterization of tumor enhancement. However, kinetic MR imaging techniques are limited by their spatial resolution and anatomic coverage, and they require complex computational modeling and analysis.
In summary, quantitative ROI analysis of tumor enhancement patterns at multiphase MR imaging offers a widely available, easily applicable, and highly reproducible method to characterize several benign and malignant histologic subtypes of renal cortical tumors, although it does not aid differentiation between clear cell carcinomas and oncocytomas. Thus, in addition to morphologic and soft-tissue characterization, analysis of tumor enhancement should be incorporated in the diagnostic evaluation of renal cortical tumors on MR imaging.
Advances in Knowledge.
• Interreader agreement in the quantitative analysis of multiphase contrast-enhanced MR imaging was substantial to almost perfect (overall concordance correlation coefficient, 0.77–0.88).
• In all three postcontrast phases (corticomedullary, nephrographic, and excretory phases), the percentage change in signal intensity (%SI change) relative to the precontrast phase (averaged for all readers) was significantly greater in clear cell carcinoma (230%, 250%, and 227% for corticomedullary, nephrographic, and excretory phases, respectively) than in papillary carcinoma (49%, 92%, and 88% for corticomedullary, nephrographic, and excretory phases, respectively; P < .0001 for all phases) or chromophobe carcinoma (98%, 183%, and 159%; P values of < .0001, .0107, and .0023 for corticomedullary, nephrographic, and excretory phases, respectively).
• Angiomyolipomas (%SI change, 353%) demonstrated significantly greater enhancement than clear cell carcinomas (%SI change, 230%) only in the corticomedullary phase (P = .0231).
• Angiomyolipomas were the only tumor histologic type to demonstrate washout from the corticomedullary phase to the later phases of enhancement.
• No significant difference in %SI change was observed between clear cell carcinoma and oncocytoma in any phase of enhancement (P = .2081–.6000).
Implication for Patient Care.
• In the context of paradigm changes in the natural history of renal cortical tumors, particularly related to the increase in incidental detection at cross-sectional imaging, earlier stage at diagnosis and emphasis on less-invasive approaches that preserve renal tissue and function, multiphasic contrast-enhanced MR imaging aids in the noninvasive characterization of some of the various benign and malignant histologic subtypes of renal cortical tumors and thus facilitates treatment planning and patient counseling.
Acknowledgments
We are grateful to Mrs. Ada Muellner for editing the manuscript.
Received April 12, 2011; revision requested May 16; revision received January 24, 2012; accepted February 17; final version accepted March 30.
Disclosures of Potential Conflicts of Interest: H.A.V. No potential conflicts of interest to disclose. J.C. No potential conflicts of interest to disclose. R.L. No potential conflicts of interest to disclose. Y.L. No potential conflicts of interest to disclose. J.Z. No potential conflicts of interest to disclose. C.M. No potential conflicts of interest to disclose. M.S. No potential conflicts of interest to disclose. L.S. No potential conflicts of interest to disclose. P.R. Financial activities related to the present article: none to disclose. Financial activities not related to the present article: Consultancy to Wilex AG. Other relationships: none to disclose. O.A. No potential conflicts of interest to disclose.
Abbreviations:
- OCC
- overall concordance correlation coefficient
- PACS
- picture archiving and communication system
- %SI change
- percentage change in SI
- ROI
- region of interest
- SI
- signal intensity
References
- 1.Reuter VE, Presti JC. Contemporary approach to the classification of renal epithelial tumors. Semin Oncol 2000;27(2):124–137. [PubMed] [Google Scholar]
- 2.Russo P. Evolving understanding and surgical management of renal cortical tumors. Mayo Clin Proc 2000;75(12):1233–1235. [DOI] [PubMed] [Google Scholar]
- 3.Linehan WM, Walther MM, Zbar B. The genetic basis of cancer of the kidney. J Urol 2003;170(6 Pt 1):2163–2172. [DOI] [PubMed] [Google Scholar]
- 4.Collins S, McKiernan J, Landman J. Update on the epidemiology and biology of renal cortical neoplasms. J Endourol 2006;20(12):975–985. [DOI] [PubMed] [Google Scholar]
- 5.Tickoo SK, Gopalan A. Pathologic features of renal cortical tumors. Urol Clin North Am 2008;35(4):551–561, v. [DOI] [PubMed] [Google Scholar]
- 6.Jayson M, Sanders H. Increased incidence of serendipitously discovered renal cell carcinoma. Urology 1998;51(2):203–205. [DOI] [PubMed] [Google Scholar]
- 7.Chow WH, Devesa SS, Warren JL, Fraumeni JF. Rising incidence of renal cell cancer in the United States. JAMA 1999;281(17):1628–1631. [DOI] [PubMed] [Google Scholar]
- 8.Luciani LG, Cestari R, Tallarigo C. Incidental renal cell carcinoma-age and stage characterization and clinical implications: study of 1092 patients (1982-1997). Urology 2000;56(1):58–62. [DOI] [PubMed] [Google Scholar]
- 9.Tsui KH, Shvarts O, Smith RB, Figlin R, de Kernion JB, Belldegrun A. Renal cell carcinoma: prognostic significance of incidentally detected tumors. J Urol 2000;163(2):426–430. [DOI] [PubMed] [Google Scholar]
- 10.Rendon RA, Stanietzky N, Panzarella T, et al. The natural history of small renal masses. J Urol 2000;164(4):1143–1147. [PubMed] [Google Scholar]
- 11.Pantuck AJ, Zisman A, Belldegrun AS. The changing natural history of renal cell carcinoma. J Urol 2001;166(5):1611–1623. [PubMed] [Google Scholar]
- 12.Hock LM, Lynch J, Balaji KC. Increasing incidence of all stages of kidney cancer in the last 2 decades in the United States: an analysis of surveillance, epidemiology and end results program data. J Urol 2002;167(1):57–60. [PubMed] [Google Scholar]
- 13.Hollingsworth JM, Miller DC, Daignault S, Hollenbeck BK. Rising incidence of small renal masses: a need to reassess treatment effect. J Natl Cancer Inst 2006;98(18):1331–1334. [DOI] [PubMed] [Google Scholar]
- 14.Jewett MA, Zuniga A. Renal tumor natural history: the rationale and role for active surveillance. Urol Clin North Am 2008;35(4):627–634, vii. [DOI] [PubMed] [Google Scholar]
- 15.Russo P. Partial nephrectomy for renal cancer: part I. BJU Int 2010;105(9):1206–1220. [DOI] [PubMed] [Google Scholar]
- 16.Dechet CB, Zincke H, Sebo TJ, et al. Prospective analysis of computerized tomography and needle biopsy with permanent sectioning to determine the nature of solid renal masses in adults. J Urol 2003;169(1):71–74. [DOI] [PubMed] [Google Scholar]
- 17.Lane BR, Samplaski MK, Herts BR, Zhou M, Novick AC, Campbell SC. Renal mass biopsy—a renaissance? J Urol 2008;179(1):20–27. [DOI] [PubMed] [Google Scholar]
- 18.Volpe A, Mattar K, Finelli A, et al. Contemporary results of percutaneous biopsy of 100 small renal masses: a single center experience. J Urol 2008;180(6):2333–2337. [DOI] [PubMed] [Google Scholar]
- 19.Lebret T, Poulain JE, Molinie V, et al. Percutaneous core biopsy for renal masses: indications, accuracy and results. J Urol 2007;178(4 Pt 1):1184–1188; discussion 1188. [DOI] [PubMed] [Google Scholar]
- 20.Silverman SG, Gan YU, Mortele KJ, Tuncali K, Cibas ES. Renal masses in the adult patient: the role of percutaneous biopsy. Radiology 2006;240(1):6–22. [DOI] [PubMed] [Google Scholar]
- 21.Raj GV, Bach AM, Iasonos A, et al. Predicting the histology of renal masses using preoperative Doppler ultrasonography. J Urol 2007;177(1):53–58. [DOI] [PubMed] [Google Scholar]
- 22.Scialpi M, Di Maggio A, Midiri M, Loperfido A, Angelelli G, Rotondo A. Small renal masses: assessment of lesion characterization and vascularity on dynamic contrast-enhanced MR imaging with fat suppression. AJR Am J Roentgenol 2000;175(3):751–757. [DOI] [PubMed] [Google Scholar]
- 23.Kim JK, Kim TK, Ahn HJ, Kim CS, Kim KR, Cho KS. Differentiation of subtypes of renal cell carcinoma on helical CT scans. AJR Am J Roentgenol 2002;178(6):1499–1506. [DOI] [PubMed] [Google Scholar]
- 24.Ruppert-Kohlmayr AJ, Uggowitzer M, Meissnitzer T, Ruppert G. Differentiation of renal clear cell carcinoma and renal papillary carcinoma using quantitative CT enhancement parameters. AJR Am J Roentgenol 2004;183(5):1387–1391. [DOI] [PubMed] [Google Scholar]
- 25.Hecht EM, Israel GM, Krinsky GA, et al. Renal masses: quantitative analysis of enhancement with signal intensity measurements versus qualitative analysis of enhancement with image subtraction for diagnosing malignancy at MR imaging. Radiology 2004;232(2):373–378. [DOI] [PubMed] [Google Scholar]
- 26.Zhang J, Lefkowitz RA, Ishill NM, et al. Solid renal cortical tumors: differentiation with CT. Radiology 2007;244(2):494–504. [DOI] [PubMed] [Google Scholar]
- 27.Pedrosa I, Chou MT, Ngo L, et al. MR classification of renal masses with pathologic correlation. Eur Radiol 2008;18(2):365–375. [DOI] [PubMed] [Google Scholar]
- 28.Sun MR, Ngo L, Genega EM, et al. Renal cell carcinoma: dynamic contrast-enhanced MR imaging for differentiation of tumor subtypes—correlation with pathologic findings. Radiology 2009;250(3):793–802. [DOI] [PubMed] [Google Scholar]
- 29.Zhang J, Tehrani YM, Wang L, Ishill NM, Schwartz LH, Hricak H. Renal masses: characterization with diffusion-weighted MR imaging—a preliminary experience. Radiology 2008;247(2):458–464. [DOI] [PubMed] [Google Scholar]
- 30.Taouli B, Thakur RK, Mannelli L, et al. Renal lesions: characterization with diffusion-weighted imaging versus contrast-enhanced MR imaging. Radiology 2009;251(2):398–407. [DOI] [PubMed] [Google Scholar]
- 31.Wang H, Cheng L, Zhang X, et al. Renal cell carcinoma: diffusion-weighted MR imaging for subtype differentiation at 3.0 T. Radiology 2010;257(1):135–143. [DOI] [PubMed] [Google Scholar]
- 32.Sandrasegaran K, Sundaram CP, Ramaswamy R, et al. Usefulness of diffusion-weighted imaging in the evaluation of renal masses. AJR Am J Roentgenol 2010;194(2):438–445. [DOI] [PubMed] [Google Scholar]
- 33.Barnhart HX, Haber M, Song J. Overall concordance correlation coefficient for evaluating agreement among multiple observers. Biometrics 2002;58(4):1020–1027. [DOI] [PubMed] [Google Scholar]
- 34.Landis JR, Koch GG. The measurement of observer agreement for categorical data. Biometrics 1977;33(1):159–174. [PubMed] [Google Scholar]
- 35.Divgi CR, Pandit-Taskar N, Jungbluth AA, et al. Preoperative characterisation of clear-cell renal carcinoma using iodine-124-labelled antibody chimeric G250 (124I-cG250) and PET in patients with renal masses: a phase I trial. Lancet Oncol 2007;8(4):304–310. [DOI] [PubMed] [Google Scholar]
- 36.Vikram R, Ng CS, Tamboli P, et al. Papillary renal cell carcinoma: radiologic-pathologic correlation and spectrum of disease. RadioGraphics 2009;29(3):741–754; discussion 755–757. [DOI] [PubMed] [Google Scholar]
- 37.Roy C, Sauer B, Lindner V, Lang H, Saussine C, Jacqmin DMR. Imaging of papillary renal neoplasms: potential application for characterization of small renal masses. Eur Radiol 2007;17(1):193–200. [DOI] [PubMed] [Google Scholar]
- 38.Jinzaki M, Tanimoto A, Narimatsu Y, et al. Angiomyolipoma: imaging findings in lesions with minimal fat. Radiology 1997;205(2):497–502. [DOI] [PubMed] [Google Scholar]


