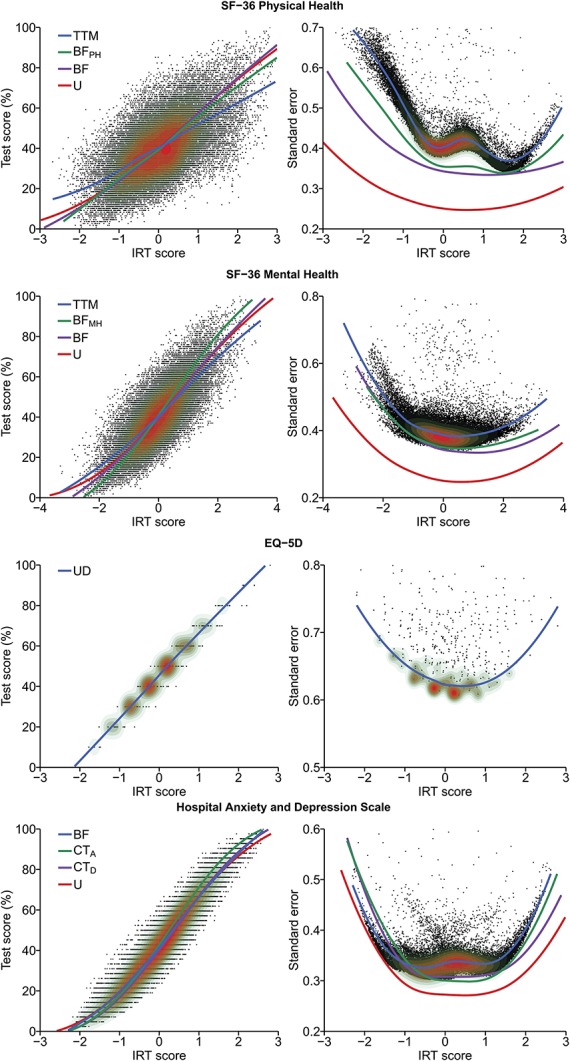
Figure 2.

Relationship between IRT scores and standardized test scores (left), and IRT scores and their standard errors (right). The points with the overlaid contour plots show individual observations and sample density calculated from the final model, with higher density in red areas, whereas LOESS lines depict trends per model. Larger IRT scores indicate better health for SF-36, lower HRQoL for EQ-5D, and higher emotional distress for HADS. BF, bifactor model; CT, correlation traits model; HADS, Hospital Anxiety and Depression Scale; HRQoL, health-related quality of life; IRT, item response theory; TTM, two-tier model; U, unidimensional model.
