Supplemental Digital Content is available in the text
Keywords: incidence, pancreatic cancer
Abstract
Annual pancreatic tumor incidence rates have been increasing. We explored pancreatic tumor incidence trends by treatment and clinicopathologic features.
Data from the Surveillance, Epidemiology and End Results (SEER) was retrieved to evaluate temporal trends and pancreatic cancer rates from 2000 to 2015. Joinpoint regression analyses were carried out to examine trend differences.
Overall, the incidence of pancreatic cancer was on the increase. The initial APC increased at a rate of 2.22% from 2000 to 2012, and increased from 2012 to 2015 at a rate of 9.05%. Joinpoint analyses revealed that trends within different demographics of pancreatic cancer showed different characteristics. The rate of pancreatic cancer also varied with histologic types. In addition, the trends by cancer stage showed significant increase incidences of stage I and II pancreatic cancer from 2000 to 2013 (stage I: APC: 2.71%; stage II: APC: 4.87%). Incidences of patients receiving surgery increased from 2000 to 2008 (APC: 7.55%), 2008 to 2011 (APC: 2.17%) and then there was a significant acceleration from 2011 to 2015 (APC: 10.51%). The incidence of cases in stage II receiving surgery increased significantly from 2004 to 2009 (APC: 9.28%) and 2009 to 2013 (APC: 2.57%). However, for cases in stage I, the incidence of cases with surgery decreased significantly since 2009 (APC: −4.14%). Patients undergoing surgical treatment without chemotherapy and radiotherapy had the higher rates compared with those who received other combined treatments.
Pancreatic cancer has been increasing overall, but patterns differ by demographics and clinicopathologic features. Efforts to identify and treat more eligible candidates for curative therapy could be beneficial.
1. Introduction
Pancreatic cancer is the third leading cause of cancer-related mortality in the United States (US), with a 5-year survival rate of approximately 7% to 8%.[1] In 2017, an estimated 53,670 new cases (female: 25,700; male: 27,970) of pancreatic cancer were diagnosed within the US and 43,090 individuals (female: 20,790; male: 22,300) were expected to die of the tumor.[1] According to the World Health Organization classification,[2] pancreatic tumor is divided into epithelial (including exocrine and neuroendocrine tumors) and non-epithelial neoplasms. Pancreatic ductal adenocarcinoma (PDA) and its variants account for >90% of all pancreatic malignancies.[3] Other less common pathological subtypes include mucinous cystadenocarcinoma, serous cystadenocarcinoma, intraductal papillary mucinous neoplasm (IPMN), and acinar cell carcinoma.[4]
Surgery with curative purpose still remains the best treatment modality for most of the operable pancreatic tumors.[3,5] However, at presentation, more than 80% of patients are not suitable candidates for resection because of the metastatic (50%) or locally advanced (30%) disease.[3] The resectability criteria is mainly based on the absence of peritoneal or hepatic metastases and the extent of venous and arterial involvement by the tumor.[3,6–8]
In the present study, we explored pancreatic cancer incidence trends over the past 16 years and patterns by gender, age, race, tumor pathologic type, tumor size, location, American Joint Committee on Cancer (AJCC) stage and treatment methods using data from the Surveillance, Epidemiology and End Results (SEER) program. To our knowledge, only a few studies have evaluated the time trends in pancreatic cancer rates,[9,10] and none has examined trends within the main clinicopathologic subtypes of pancreatic cancer.
2. Methods
2.1. Data source
A retrospective descriptive study was carried out using data from the SEER database. SEER 18 registry database for 2000 through 2015 was retrieved for the present study (seer.cancer.gov/about/overview.html). The SEER program collects data regarding tumor incidence, patient demographics, patient therapy and survival from 18 population-based cancer registries, which covers approximately 28% of the US population. We identified 24089 patients who had known pathological diagnosis. Pathological diagnosis of pancreatic tumors was based on the International Classification of Diseases for Oncology, 3rd Edition (ICD-O-3).
We selected all pancreatic cancers using SEER∗Stat recode ICD-0–3/WHO 2008: Pancreas (ICD-O-3 site C25). The following mutually exclusive pathological groups were included: ductal adenocarcinoma excluding cystic or mucinous (8255, 8490, 8500, 8507, 8510, 8514, 8521, 8523, 8560, 8570), ductal specified as cystic adenocarcinoma (8440, 8470, 8504), ductal specified as mucinous adenocarcinoma (8480, 8481), intraductal papillary mucinous neoplasm (IPMN) (8144, 8450, 8453, 8471, 8503), non-secretory endocrine tumors (8150, 8246), secretory endocrine tumors (8151, 8152, 8153, 8155, 8156), acinar cell adenocarcinoma (8550, 8551), carcinoid endocrine tumors (8240, 8241, 8243, 8244, 8245), and solid pseudopapillary (8452).[9] Only tumors defined as malignant (behavior = 3) were included in the analysis. All included patients are anonymous and this study was approved by the institutional review board of Lanzhou University Second Hospital. All clinicopathologic data from SEER is public available.
2.2. Statistical analysis
We used SEER∗Stat version 8.3.5 software to calculate incidence counts and age-adjusted rates. Rates were defined as the number of new patients per 100,000 persons and were adjusted by age to the US standard million population for the year 2000. The temporal trend annual percentage changes (APCs) and 95% confidence intervals (CIs) were calculated using annual rates. In addition, incidence rate ratios (IRRs) were calculated by surgical treatment group.
To determine the time point at which the incidence trends changed, joinpoint regression models were performed by Joinpoint software 4.5.0.0 (http://srab/cancer.giv/joinpoint/). As described before, this calculative method uses a statistical algorithm to define a best-fitting regression line through incidence data across the time period, determining how many joinpoints should be used to determine where statistically significant changes take place. The maximum number of joinpoints were limited to five. The simplest model was chosen based on significance tests using a Monte Carlo permutation method.[11] By Joinpoint analyses, APC was also calculated to analyze these trends for statistical significance.
3. Results
3.1. Trends by patient demographics (age, sex and race)
Table 1 showed the APCs calculated by SEER Stat and Figure 1 showed the results of Joinpoint regression analyses. Overall, the incidence of pancreatic cancer was on the increase. The initial APC increased at a rate of 2.22% from 2000 to 2012 (P < .05), and increased from 2012 to 2015 at a rate of 9.05% (P < .05). Joinpoint analyses revealed that the absolute incidence of pancreatic cancer in patients aged 0 to 45 years increased at an annual rate of 2.94% until 2012 (P < .05). It increased rapidly between 2012 and 2015 at an annual percentage change rate of 30.31% (P < .05). The incidence of patients aged 45 to 60 years has increased at a statistically significant annual rate of 2.94% until 2011 (P < .05), while it increased rapidly form 2011 (APC: 10.37%, P < .05). For individuals aged 60 to 70 years, a joinpoint was also observed in 2013 and the incidence increased rapidly after 2013 (APC: 15.53%, P < .05). In contrast, no joinpoints were found for patients aged 70 to 80 years and > 80 years (Fig. 1A).
Table 1.
Incidence trends of pancreatic tumor from 2000 to 2015.
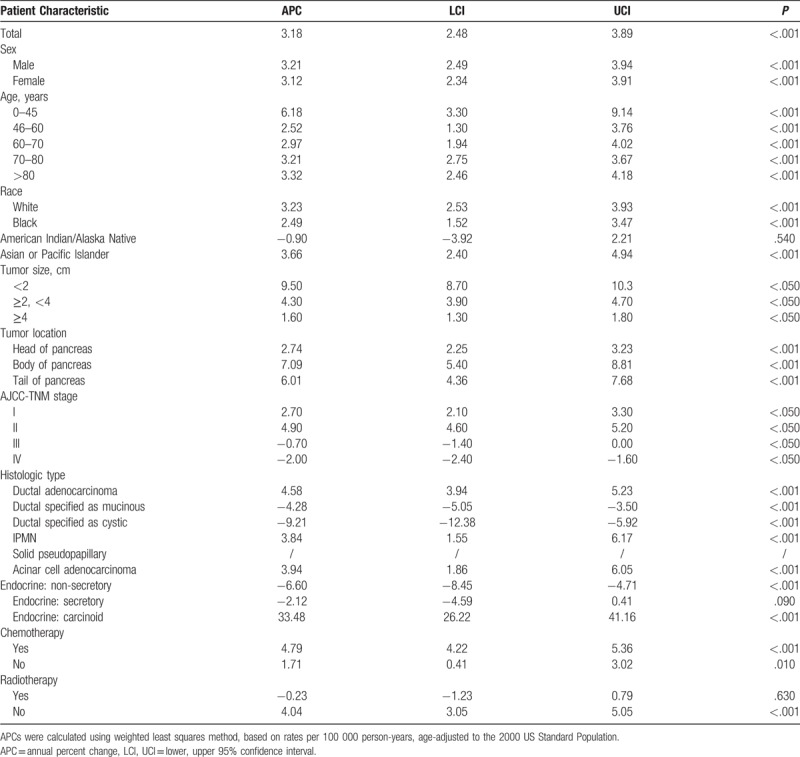
Figure 1.
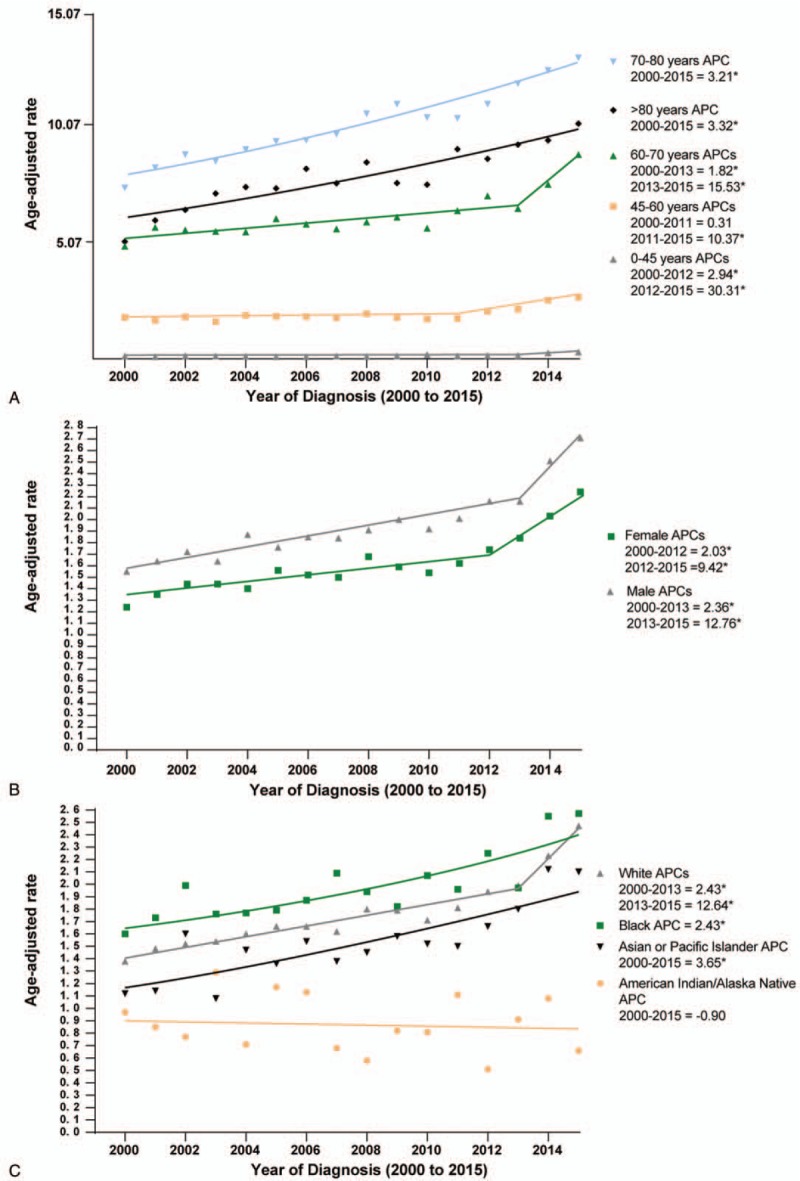
Pancreatic cancer incidence trends by age, sex, and race.
The detailed incidences grouped by sex and race were shown in Figure 1B and C.
3.2. Trends by clinicopathologic parameters
As shown in Table 1 and Figure 2A, incidence rose among patients with <2 cm, 2to 4 cm and > 4 cm tumors (APC = 9.49%, 4.30%, and 1.58%, respectively). Figure 2B revealed that the incidence of pancreatic head cancer increased at an annual rate of 3.57% until 2005 (P < .05). It increased modestly between 2005 and 2012 at an annual percentage change rate of 1.39% (P < .05). Since then, the incidence of pancreatic head cancer has increased rapidly at a statistically significant annual rate of 6.88% (P < .05). The incidence of pancreatic tail cancer increased between 2000 and 2011 at an APC of 2.34% (P < .05), and then increased at an APC of 17.36% from 2011 to 2015 (P < .05). The incidence of pancreatic body cancer increased at a rate of 6.70% from 2000 to 2015 (P < .05).
Figure 2.
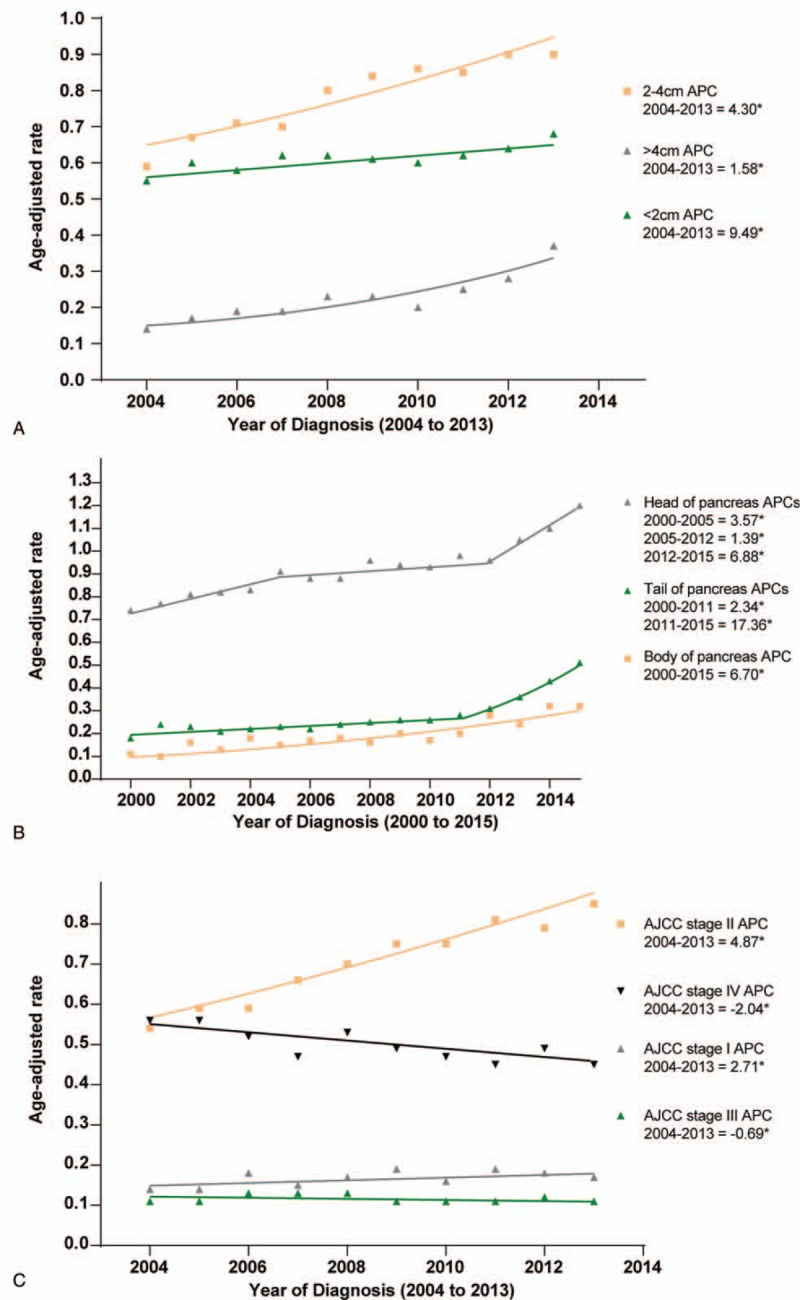
Pancreatic cancer incidence trends by tumor size, location, and AJCC stage.
The trends by cancer stage showed increase incidences of stage I and II pancreatic cancer from 2000 to 2013 (stage I: APC: 2.71%, P < .05; stage II: APC: 4.87%, P < .05). However, for stage III and IV pancreatic cancer, the APCs decreased at a rate of −0.69% and −2.04% from 2000 to 2013, respectively (Both P < .05) (Fig. 2C).
As shown in Figure 3A–C, the rate of pancreatic cancer varied with histologic types. The incidence of PDA increased during 2000 to 2008 (APC: 6.26%, P < .05), and 2008 to 2015 (APC: 3.14%, P < .05). In contrast, the rates of mucinous and cystic adenocarcinoma decreased across the study period (mucinous: APC: −4.24%, P < .05; cystic: APC: −3.40%, P < .05). The rate of endocrine: carcinoid rose from 2001 to 2010 (APC: 8.22%, P < .05), 2010 to 2013 (APC: 90.71%, P < .05) and 2013 to 2015 (APC: 30.94%, P < .05). There was an initial decrease in the incidence of endocrine: non-secretory at a rate of −2.58% per year (P < .05) from 2000 to 2008, followed by an acceleration from 2008 to 2013 at an annual rate of −15.77%. Interestingly, after 2013, there was no significant increase in endocrine: non-secretory incidence (APC, 12.95%; P > .05; Fig. 3B). Finally, there were increases in the incidence of IPMN (APC: 3.22%, P < .05) and acinar cell carcinoma (APC: 2.59%, P < .05) from 2000 to 2015.
Figure 3.
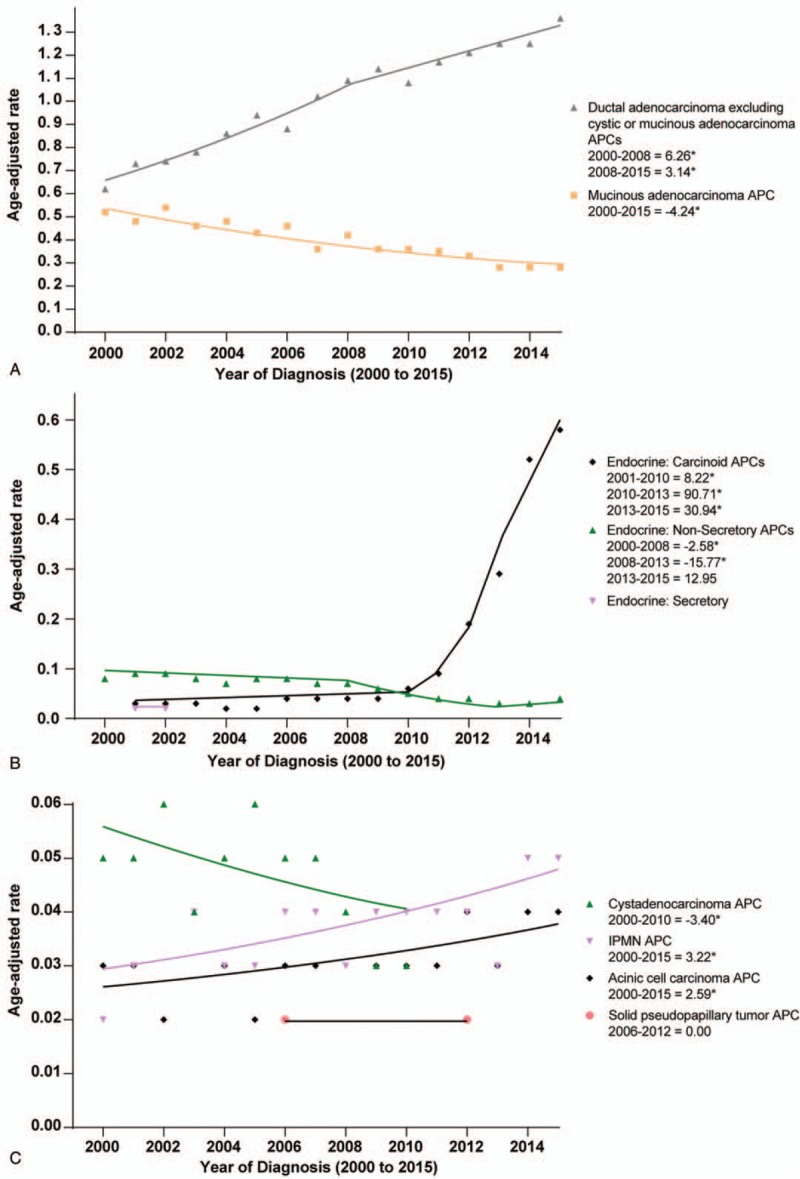
Pancreatic cancer incidence trends by histologic type.
3.3. Trends by treatment
Table 2 showed the characteristics of patients with pancreatic cancer (with known pathological types) as identified in the SEER data set from 2000to 2015. Despite the large number of cases without surgery (n = 11769), rates were higher among cases with surgical treatment (surgery/non-surgery IRR: 1.035, 95% CI 1.009–1.062). In Figure 4A, we found that incidences of patients receiving surgery increased from 2000 to 2008 (APC: 7.55%, P < .05), 2008 to 2011 (APC: 2.17%, P > .05) and then there was an acceleration from 2011 to 2015 (APC: 10.51%, P < .05). The incidence of patients who had Whipple procedures rose with an APC of 6.05% (P < .05). The incidence of total pancreatectomy also increased from 2000 to 2005 (APC: 29.76%, P < .05) and 2005 to 2015 (APC: 1.98%, P < .05) (Fig. 4B). Rates of patients without surgical treatment were increased during 2000 to 2002 (APC: 7.64%, P < .05), then decreased during 2002 to 2010 (APC: −2.83%, P < .05), and increased from 2010 to 2015 (APC: 4.23%, P < .05).
Table 2.
Pancreatic cancer counts, rates, and surgery/non-surgery incidence rate ratios based on different clinicopathologic variables in SEER 18 (2000–2015).
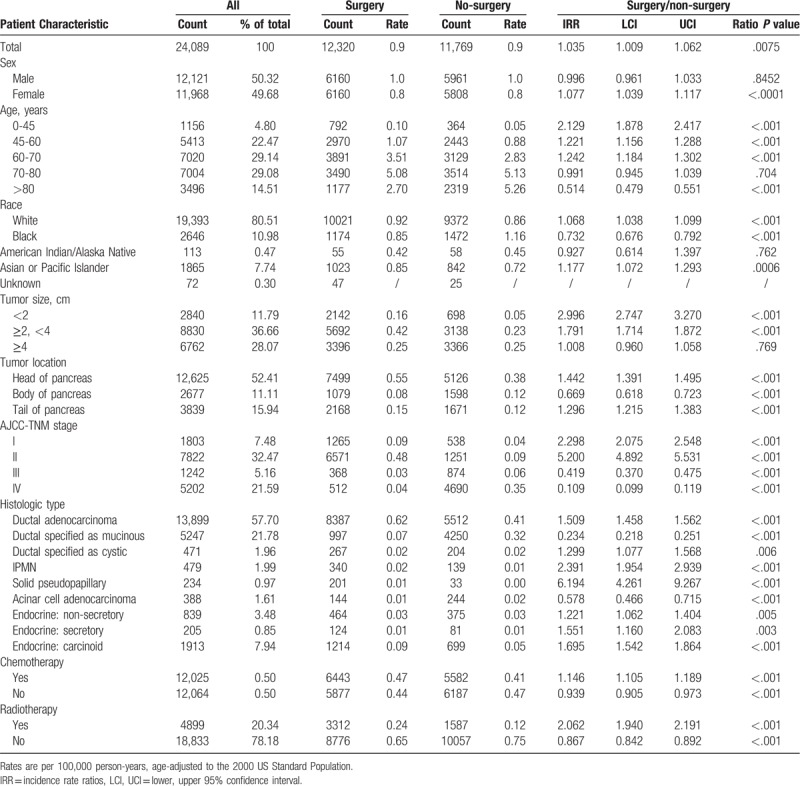
Figure 4.
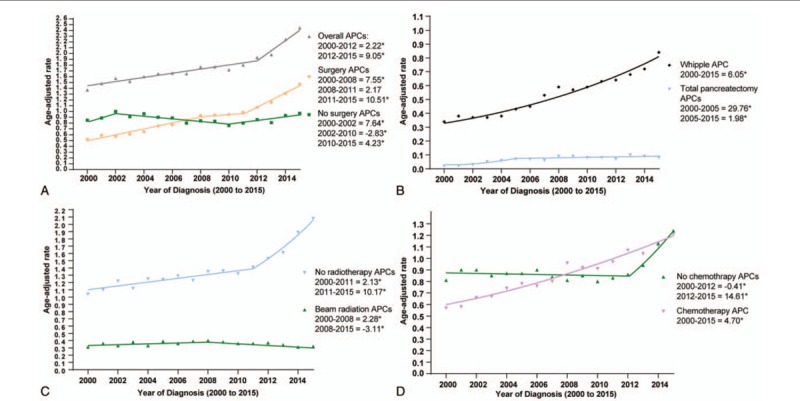
Pancreatic cancer incidence trends by treatment methods.
The incidence of cases receiving radiotherapy increased from 2000 to 2008 (APC: 2.28%, P < .05), but decreased since then (APC: −3.11%, P < .05). The incidence of patients without radiotherapy increased during 2000–2011 (APC: 2.13%, P < .05) and 2011 to 2015 (APC: 10.17%, P < .05) (Fig. 4C). The incidence of cases receiving chemotherapy increased over time (APC: 4.70%, P < .05). However, the rate of patients without chemotherapy increased rapidly since 2012 and finally exceeded the rate of cases with chemotherapy in 2015 (Fig. 4D). In supplementary Figure 1, we showed the trends of combined treatments for patients with pancreatic cancer. We found that patients undergoing surgical treatment without chemotherapy and radiotherapy had the higher rates compared with those who received other combined treatments.
3.4. Trends by treatment and clinicopathologic parameters
In Supplementary Table 1, we showed the overall incidence trends (non-joinpoint analyses) of pancreatic cancer stratified by treatment and clinicopathologic parameters. In Figure 5, the joinpoint analyses revealed that rates (during the most recently time periods in joinpoint analyses) of patients undergoing surgery increased more rapidly than cases without surgery among patients aged 0 to 45 years, 60 to 70 years and >80 years. The detailed joinpoints observed by joinpoint analyses were shown in Figure 5. The total age-adjusted rates (2000–2015) among patients with surgery compared with cases without surgery were higher among patients aged 0 to 45, 45 to 60 and 60 to 70 years (all IRRs > 1.00). In contrast, it was similar among cases aged 70 to 80 years and lower among cases aged >80 years (Table 2).
Figure 5.
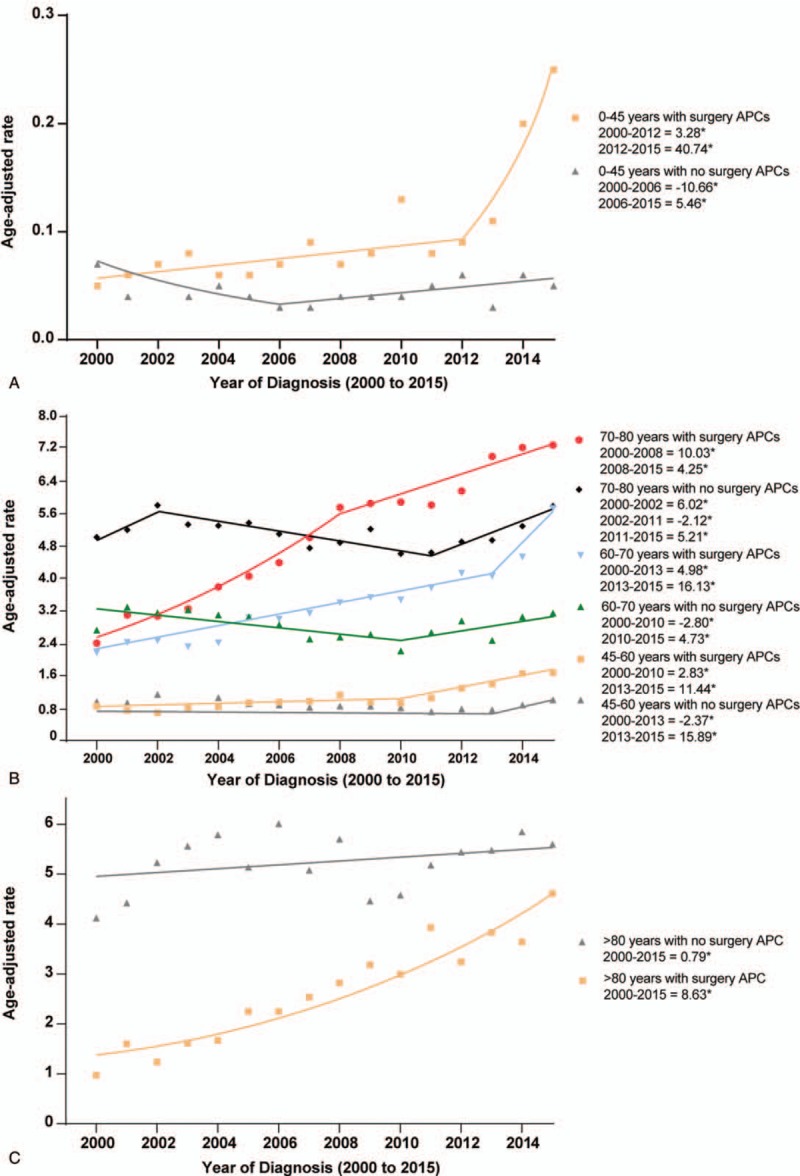
Pancreatic cancer incidence trends by age and surgical treatment.
In Supplementary Figure 2, after stratified by treatment and sex (Supplementary Fig. 2A), or treatment and race (Supplementary Fig. 2B), the joinpoint analyses demonstrated that rates of patients undergoing surgery increased more rapidly than patients without surgery among all subgroups. However, the total rate of cases with surgery was lower than the rate of cases with non-surgery among the Blacks (IRR: 0.732; 95%CI: 0.676–0.792) (Table 2).
When stratified by tumor stage and treatment, the IRRs (surgery/non-surgery) were 2.298 and 5.200 (Both P < .001) for stage I and II, respectively. However, the IRRs were 0.419 and 0.109 for stage III and IV, respectively (Both P < .001). In joinpoint analyses (Supplementary Fig. 3B), the incidence of cases in stage II receiving surgery increased from 2004 to 2009 (APC: 9.28%, P < .05) and 2009 to 2013 (APC: 2.57%, P < .05). However, for cases in stage I, the incidence of cases with surgery decreased since 2009 (APC: −4.14%, P < .05). Finally, after stratified by tumor location, we found that the incidences of patients undergoing surgery increased more rapidly than patients without surgery among all subgroups during the most recently time periods in joinpoint analyses. The joinpoints for all trends were shown in detail in Supplementary Figure 3A–C.
Specially, we found that rates among cases with surgery compared with non-surgery were higher among those with PDA, cystic adenocarcinoma, IPMN, solid pseudopapillary tumor, endocrine: non-secretory, endocrine: secretory and endocrine: carcinoid (All IRRs >1) (Table 2). However, the IRRs (surgery/non-surgery) were 0.234 and 0.578 for mucinous adenocarcinoma and acinar cell adenocarcinoma, respectively.
4. Discussion
Our study showed increases in pancreatic cancer rates from 2000 to 2015 and the incidence increased more rapidly between 2012 and 2015 at an annual percentage change rate of 9.05%. We explored the trends of pancreatic cancer by clinicopathologic characteristics and found important differences. The overall increases in cancer incidence were primarily due to PDA (which represents most of the cases). Cigarette smoking is an established risk factor for PDA.[12–16] However, whether it is related to the acceleration of increase of pancreatic cancer incidence needs further investigations. Consistent with previous studies,[9,17] the mucinous and cystic adenocarcinoma were declined over time, which may be caused by the improved diagnosis and treatment for precursor lesions prior to malignant transformation. In addition, rates of some rare pancreatic tumor types including IPMN, acinic cell carcinoma and carcinoid endocrine tumors increased across the study period. However, little is known about the epidemiology and etiology of these extremely rare pancreatic tumors.[3]
This increasing incidence trend is most pronounced in cases with age < 70 years (Fig. 1). In a recent study, Sung et al examined age-specific incidence trends in the USA for 30 common cancers (including 12 obesity-related cancers).[18] Consistently, they observed that the incidence of pancreatic cancer increased significantly in a stepwise manner in young adults. Although incidences for pancreatic cancer also rose in older adults, the magnitudes of annual percent increase were smaller than in young adults. The prevalence of overweight and obesity have been increasing in the USA since the 1970s.[19] The incidence of diabetes has also been increasing rapidly in children and young adults since the 1980s.[20] In addition, other risk factors including the quality of diet and cigarette smoking also increased the incidence of pancreatic cancer in the younger patients.[9,16,21]
Specially, we observed that an increasing diagnosis of smaller (< 2 cm and 2–4 cm) and earlier (stage I and II) pancreatic cancer between 2000 and 2015, which may be due to the mixed progress that has been made in the early diagnosis and treatment of pancreatic tumors in the United States.[22–25] In addition, the increasing rate of pancreatic tumors were predominately located in the head and tail of the pancreas. Given that the majority of tumors were located in the head of the pancreas and the incidence of pancreatic head tumors increased rapidly over time (2012–2015 APC: 6.88%), the Whipple procedures remained the most commonly used treatment modality.
To render the locally advanced tumors resectable, multidisciplinary treatment including systemic chemotherapy and local radiotherapy remains the current standard of care for locally advanced pancreatic tumors,[3] but with limited success. Though adjuvant chemotherapy alone has shown improved OS for pancreatic tumor, the role of radiation therapy remains controversial.[26] In the present study, we found that the incidence of patients undergoing surgery without chemotherapy and radiotherapy increased more rapidly than other combined treatments. By joinpoint analyses, we found that the incidence of patients undergoing radiotherapy decreased during 2008 to 2015 (APC: −3.11%).
With the increasing incidence of pancreatic tumors among younger cases, the rate of patients in the young receiving surgical treatment increased rapidly in recent years (Fig. 5). However, owing to the highest prevalence of pancreatic cancer in the elderly patients, the surgical treatment rate was the highest among patients aged 70 to 80 years (Table 2). For patients older than 80 years, due to the poorer performance status and more comorbidities, more patients received non-surgical management, while the incidence of these patients undergoing pancreatectomy rose rapidly in recent years. It may be related to the improved surgical techniques and perioperative management. In addition to age, race also influenced the management of pancreatic tumors, we found that the total surgical treatment rates were lower among the Blacks from 2000 to 2015. In 2013, the incidence of surgery for the Blacks exceeded cases without surgery (Supplementary Fig. 2). Tumor burden is also a critical factor determining the treatment modalities. Patients in stage I and II remained the major component for receiving surgical treatment. The number of patients receiving Whipple procedures exceeded those without surgery for pancreatic head tumors since 2004, and the incidence of cases receiving pancreaticoduodenectomy increased rapidly from 2000 to 2015 (Supplementary Fig. 2).
The strengths of the present study lie in the use of large population-based datasets (SEER 18), which allowed the analysis of recent pancreatic cancer rates by clinicopathologic parameters. To our knowledge, this is the first study demonstrating the rise of pancreatic cancer by clinicopathologic features. However, this study had limitations. First, we only included cases with known histologic types, which limited the patient count and it may lead to the instability of the conclusions. Second, we cannot acquire some parameters of tumors from SEER, which may influence the accuracy of the trends stratified by tumor characteristics. Despite these limitations, our study demonstrated that the increasing incidence trend is most pronounced in the White and the prevalence of the pancreatic tumors tends to be younger. In addition, our study reveals differing patterns by clinicopathologic features, which presents a comprehensive analyses of the trends for demographics, early detection, and disease treatment of pancreatic cancers.
Author contributions
Conceptualization: Xiaxia Pei, Feixue Song.
Data curation: Xiaxia Pei.
Formal analysis: Xiaxia Pei, Feixue Song.
Funding acquisition: Xiaxia Pei.
Investigation: Xiaxia Pei, Feixue Song.
Methodology: Xiaxia Pei, Zhiping Wang.
Project administration: Xiaxia Pei, Zhiping Wang.
Resources: Xiaxia Pei, Zhiping Wang.
Software: Xiaxia Pei.
Supervision: Xiaxia Pei.
Validation: Xiaxia Pei.
Visualization: Xiaxia Pei.
Writing – original draft: Xiaxia Pei.
Writing – review & editing: Xiaxia Pei.
Supplementary Material
Supplementary Material
Supplementary Material
Supplementary Material
Footnotes
Abbreviations: AJCC = American Joint Committee on Cancer, CIs = confidence intervals, IPMN = intraductal papillary mucinous neoplasm, IRRs = incidence rate ratios, PDA = Pancreatic ductal adenocarcinoma, SEER = surveillance, epidemiology and end results.
How to cite this article: Pei X, Song F, Wang Z. Emerging incidence trends and application of curative treatments of pancreatic cancer in the USA. Medicine. 2019;98:51(e17175).
The authors have no funding and conflicts of interest to disclose.
Supplemental Digital Content is available for this article.
References
- [1].Siegel RL, Miller KD, Jemal A. Cancer Statistics, 2017. CA Cancer J Clin 2017;67:7–30. [DOI] [PubMed] [Google Scholar]
- [2].Flejou JF. WHO Classification of digestive tumors: the fourth edition. Annal Patholog 2011;31:S27–31. [DOI] [PubMed] [Google Scholar]
- [3].Tempero MA, Malafa MP, Al-Hawary M, et al. Pancreatic adenocarcinoma, Version 2.2017, NCCN clinical practice guidelines in oncology. J Natl Compr Canc Netw 2017;15:1028–61. [DOI] [PubMed] [Google Scholar]
- [4].Esposito I, Segler A, Steiger K, et al. Pathology, genetics and precursors of human and experimental pancreatic neoplasms: an update. Pancreatology 2015;15:598–610. [DOI] [PubMed] [Google Scholar]
- [5].Tempero MA, Malafa MP, Behrman SW, et al. Pancreatic adenocarcinoma, version 2.2014: featured updates to the NCCN guidelines. J Natl Compr Canc Netw 2014;12:1083–93. [DOI] [PubMed] [Google Scholar]
- [6].Sabater L, Munoz E, Rosello S, et al. Borderline resectable pancreatic cancer. Challenges and controversies. Cancer Treat Rev 2018;68:124–35. [DOI] [PubMed] [Google Scholar]
- [7].Neoptolemos JP, Kleeff J, Michl P, et al. Therapeutic developments in pancreatic cancer: current and future perspectives. Nat Rev Gastroenterol Hepatol 2018;15:333–48. [DOI] [PubMed] [Google Scholar]
- [8].Toesca DAS, Koong AJ, Poultsides GA, et al. Management of borderline resectable pancreatic cancer. Int J Radiat Oncol Biol Phys 2018;100:1155–74. [DOI] [PubMed] [Google Scholar]
- [9].Gordon-Dseagu VL, Devesa SS, Goggins M, et al. Pancreatic cancer incidence trends: evidence from the Surveillance, Epidemiology and End Results (SEER) population-based data. Int J Epidemiol 2018;47:427–39. [DOI] [PMC free article] [PubMed] [Google Scholar]
- [10].Zhou J, Enewold L, Stojadinovic A, et al. Incidence rates of exocrine and endocrine pancreatic cancers in the United States. Cancer Causes Control 2010;21:853–61. [DOI] [PubMed] [Google Scholar]
- [11].Kim HJ, Fay MP, Feuer EJ, et al. Permutation tests for joinpoint regression with applications to cancer rates. Stat Med 2000;19:335–51. [DOI] [PubMed] [Google Scholar]
- [12].Antwi SO, Oberg AL, Shivappa N, et al. Pancreatic cancer: associations of inflammatory potential of diet, cigarette smoking and long-standing diabetes. Carcinogenesis 2016;37:481–90. [DOI] [PMC free article] [PubMed] [Google Scholar]
- [13].Barone E, Corrado A, Gemignani F, et al. Environmental risk factors for pancreatic cancer: an update. Arch Toxicol 2016;90:2617–42. [DOI] [PubMed] [Google Scholar]
- [14].Glauert HP, Elliott RS, Han SG, et al. Effect of cigarette smoke exposure and mutant Kras overexpression on pancreatic cell proliferation. Oncol Lett 2017;13:1939–43. [DOI] [PMC free article] [PubMed] [Google Scholar]
- [15].Lea CS, Holly EA, Bracci PM. Cigarette smoking and risk of pancreatic cancer: a clinic-based case-control study in the San Francisco Bay Area. Ann Epidemiol 2015;25:816–23. [DOI] [PubMed] [Google Scholar]
- [16].Yuan C, Morales-Oyarvide V, Babic A, et al. Cigarette smoking and pancreatic cancer survival. J Clin Oncol 2017;35:1822–8. [DOI] [PMC free article] [PubMed] [Google Scholar]
- [17].Miura F, Takada T, Amano H, et al. Diagnosis of pancreatic cancer. HPB 2006;8:337–42. [DOI] [PMC free article] [PubMed] [Google Scholar]
- [18].Sung H, Siegel RL, Rosenberg PS, et al. Emerging cancer trends among young adults in the USA: analysis of a population-based cancer registry. Lancet Public Health 2019;4:e137–47. [DOI] [PubMed] [Google Scholar]
- [19].Stolzenberg-Solomon RZ, Amundadottir LT. Epidemiology and inherited predisposition for sporadic pancreatic adenocarcinoma. Hematol Oncol Clin North Am 2015;29:619–40. [DOI] [PMC free article] [PubMed] [Google Scholar]
- [20].Mayer-Davis EJ, Lawrence JM, Dabelea D, et al. Incidence Trends of Type 1 and Type 2 Diabetes among Youths, 2002-2012. N Engl J Med 2017;376:1419–29. [DOI] [PMC free article] [PubMed] [Google Scholar]
- [21].Zheng J, Guinter MA, Merchant AT, et al. Dietary patterns and risk of pancreatic cancer: a systematic review. Nutr Rev 2017;75:883–908. [DOI] [PMC free article] [PubMed] [Google Scholar]
- [22].Du L, Wang-Gillam A. Trends in neoadjuvant approaches in pancreatic cancer. J Natl Compr Canc Netw 2017;15:1070–7. [DOI] [PubMed] [Google Scholar]
- [23].Moutinho-Ribeiro P, Coelho R, Giovannini M, et al. Pancreatic cancer screening: still a delusion? Pancreatology 2017;17:754–65. [DOI] [PubMed] [Google Scholar]
- [24].Cooperman AM, Iskandar ME, Wayne MG, et al. Prevention and early detection of pancreatic cancer. Surg Clin North Am 2018;98:1–2. [DOI] [PubMed] [Google Scholar]
- [25].Mohammed S, Van Buren G, 2nd, Fisher WE. Pancreatic cancer: advances in treatment. World J Gastroenterol 2014;20:9354–60. [DOI] [PMC free article] [PubMed] [Google Scholar]
- [26].Kommalapati A, Tella SH, Goyal G. Contemporary Management of Localized Resectable Pancreatic Cancer. Cancers 2018;10:24. [DOI] [PMC free article] [PubMed] [Google Scholar]
Associated Data
This section collects any data citations, data availability statements, or supplementary materials included in this article.


