

Abstract
To investigate the difference in messenger ribonucleic acid (mRNA) and protein expression of growth arrest DNA damage-inducible gene 45α (GADD45α), mouse double minute 2 homolog (MDM2), and P73 in cancer and cancer-adjacent tissues in patients with non-small-cell lung carcinoma (NSCLC).
We compared the mRNA expression of GADD45α and MDM2 and the protein expression of GADD45α, MDM2, and P73 in lung cancer and cancer-adjacent tissues in NSCLC patients by quantitative real-time PCR, immunohistochemistry (IHC), and Western Blot (WB). We analyzed GADD45α, MDM2, and P73 expression in patients with different pathological types of NSCLC, and the correlation of these genes with gender, smoking history, and TNM/T stages.
IHC results suggested that MDM2 protein expression significantly increased in cancer tissues in female patients (P = .01), but not in male patients. In addition, WB results indicated that P73 protein expression significantly decreased in cancer tissues in patients with adenocarcinoma (P = .03), but not squamous carcinoma.
MDM2 and P73 protein levels were differentially regulated in cancer and cancer-adjacient tissues in patients with sub types of NSCLC. There was no significant difference in GADD45α expression between cancer and cancer-adjacent tissues in NSCLC patients.
Keywords: adenocarcinoma, GADD45α, MDM2, non-small-cell lung carcinoma (NSCLC), P73, squamous carcinoma
1. Introduction
Lung cancer is a malignant tumor with the highest morbidity and mortality, and is a serious threat to human health. Despite improvements in diagnostic techniques and potential therapies, prognosis for patients with lung cancer has not improved substantially.[1] Therefore, it is critical to have a better understanding of the molecular mechanisms of lung cancer, to make an effective assessment of the occurrence and prognosis of lung cancer, and to find the best therapeutic target and individualized treatment plans.
Growth arrest DNA damage-inducible gene 45α (GADD45α), a target for P53, belongs to a classic tumor suppressor gene family.[2] GADD45α is located on chromosome lp31.1 - lp31.2, and is expressed mainly in the nucleus. GADD45α is often upregulated in response to various environmental stress condtions, such as ultraviolet radiation and ionizing radiation.[3] In addition, GADD45α is a multifunctional protein and participates in a variety of stress reactions.[4,5] Studies show that GADD45α plays an important role in cell development, DNA damage repair, signal transduction,[6] maintenance of genome stability and S-phase checkpoint control.[7] GADD45α maintains genomic stability through DNA methylation and DNA repair,[8,9] and regulates apoptosis induced by various damages in vivo.[10]
GADD45α is the first-discovered downstream target gene of p53.[3] Activation of p53 can promote GADD45α transcription, while GADD45α can also regulate p53 activation. Studies show that GADD45α mediates the activation of a mitogen activated protein kinase, promotes p38 activation, enhances the stabilization and activity of p53, and participates in a wider range of tumor suppression.[11] In addition, GADD45α has an important role in tumor formation. Downregulation of GADD45α can cause tumor cells to escape from apoptosis.[12] The inhibition of GADD45α decreases the activation of nuclear factor-kappa B and c-jun amino terminal kinase in prostate cancer and breast cancer.[13] Importantly, Higashi et al found that GADD45α messenger ribonucleic acid (mRNA) expression was about 10 times lower in non-small cell lung cancer tissues.[14] The lower mRNA expression is correlated with a higher degree of malignancy of tumor cells. However, GADD45α expression is unchanged in other tumors, suggesting the different functions of GADD45α in different tumors or microenvironment.
As a homologous family factor, P73 has similar biological functions as P53,[15] and may also interact with GADD45α. P73 is located on chromosome 1p36, a region that has frequent mutations, and is associate with a variety of human tumors, such as breast cancer and neuroblastoma.[16,17] P73 plays an important role in tumor formation. Heterozygous deletions of P73 have been found in some tumors, such as skin cancer, liver cancer, breast cancer, nervous system tumors, and colorectal tumors.[16] Studies show that P73 and GADD45α have synergistic effects in the absence of P53. P73 can independently induce the expression of its downstream protein GADD45α under certain conditions. However, the specific molecular mechanisms need to be further explored.[18]
We speculate that mouse double minute 2 homolog (MDM2) might play an important role in this process. MDM2 has the transcription factor binding site of P53, which controls the function, activation and stability of P53,[19] and further inhibits P53-mediated transcription, leading to tumor formation.[20] However, it is still unclear whether there is a correlation between P73 and MDM2 in lung cancer. In our previous study we demonstrated that MDM2 protein level is higher in squamous carcinoma and adenocarcinoma tissues compared to cancer-adjacent tissues in female lung cancer patients.[21] Previous studies have reported that MDM2 overexpression and P73 deletion can cause genomic instability and inhibit apoptosis.[22,23] MDM2 can bind to P73 both in vivo and in vitro, and will compete with P73 for the binding with the N terminal of p300/CBP, thus block the interactions of P73 and p300/CBP.[24] P73 can bind to the promotor of MDM2 and activate its transcription, while MDM2 negatively regulates the transcription/activation of P73 in P53-deletion cells.[24] Thus, MDM2, P73, and P53 form a negative feedback loop.[25] GADD45α is an E3 ubiquitin ligase, and undergoes a dynamic process of ubiquitination and degradation in vivo. Whitley et al have reported that MDM2 can promote GADD45α degradation.[26] Based on the rationale mentioned above, in this study we analyzed the correlation between MDM2 and P73 expression.
MDM2 can suppress P73 expression, while the reduction in P73 can affect GADD45α expression. Moreover, P73 can reversely promote MDM2 transcription, while MDM2 can directly control GADD45α function. In this study we investigated the MDM2-P73-GADD45α pathway, which will provide a better understanding of the molecular mechanisms of lung cancer.
2. Materials and methods
2.1. Patients
Sample size was estimated based on our preliminary data and statistical power analysis.[26] Sixty-two patients with lung cancer were selected in our hospital from June 2016 to January 2017. The inclusion criteria included:
-
(1)
The patients were diagnosed with non-small-cell lung carcinoma (NSCLC);
-
(2)
The patients did not receive chemotherapy, radiotherapy (RT), biological drug treatment;
-
(3)
The patients did not have other tumors;
-
(4)
The patients did not have other noncancer diseases according to http://geneontology.org/ (such as aquaphobia).
NSCLC cancer and cancer-adjacent tissues were isolated from patients during surgery. The tissues were immediately rinsed with 4°C normal saline, labeled, coded and stored at −80°C. We collected cancer and cancer-adjacent tissues from all 62 patients.
The lung cancer tissues were further divided into different subgroups according to the histopathology, including 14 cases of squamous carcinoma, 36 cases of adenocarcinoma, and 12 cases of other cancer types. Meanwhile, we collected the basic and important information of all patients, including age, gender, tissue location, tissue size, smoking history, and TNM tumor stages, which provided the information for subgroups analysis.
This study was approved by the Hainan branch of Chinese PLA general hospital ethics committee, and all patients signed the informed consent.
2.2. Reverse transcription quantitative real-time PCR (RT-qPCR)
The mRNA expressions of MDM2 and GADD45α in cancer and cancer-adjacent tissues were detected by RT-qPCR. The primers were: MDM2 (119 bp) forward: 5′-GGGGACAAGTTTGTACAAAAAAGCAGGCTTCGAAGGAGATAGAACCAT GTGCAATACCAACATGTCTGTACCTACT-3′, reverse: 5′-GGGGACCACTTTGTACAAGAAAGCTGGGTCCTAGGGGAAATAAGTTAGCACAATCAT-3′; GADD45α (109 bp) forward: 5′-TTGGTAGTTTGTGGTAGGGGTATT-3′, reverse: 5′-TCAAAACTTTACTAAACACTTCCTCC-3′; The internal control was h-actin beta, (127 bp) forward: 5′-AGCACAATGAAGATCAAGATCAT-3′, reverse: 5′-ACTCGTCATACTCCTGCTTGC-3′.
50 mg tissue samples were homogenized in liquid nitrogen, and transferred into centrifugal tubes. The tissues were homogenized in 1 mL Trizol, and incubated at room temperature for 5 minutes. 0.2 mL trichloromethane was added and vortexed for 10 seconds, then incubated at room temperature for 5 minutes. The samples were centrifuged at 12,000 rpm for 15 minutes at 4°C, and the supernatants were collected. The same volume of isopropanol was added, incubated at −20°C for 20 minutes, and centrifuged at 12,000 rpm for 15 minutes at 4°C. The RNA pellet was washed with 1 mL 75% ethyl alcohol and centrifuged at 12,000 rpm for 15 minutes at 4°C. The supernatant was removed and the RNA samples were air dry for 5 minutes. RNA was dissolved in 30 μL RNase-free water. The quality and concentration of each RNA sample was determined.
RNA was reverse-transcripted into complementary DNA (cDNA) using HiFiScript kits (Kangwei, CW2582, Beijing, China). 10-μL reaction system included 1 μL RNA Template, 0.5 μL genomic deoxyribo nucleic acid Eraser and 1 μL 10×g DNA Eraser Buffer. Samples were heated to 42°C for 2 minutes and cooled on ice. 1 μL HiFiScript (200 U/μL), 1 μL Primer Mix, 4 μL 5× RT buffer and 4 μL RNase-free double distilled H2O (ddH2O) were added. The thermal cycles were 42°C for 50 minutes, 85°C for 5 minutes, and 4°C forever.
qPCR was carried out with KAPA SYBR FAST qPCR Kit Master Mix (2×) (KAPA Biosystems, KK4601, Wilmington, Massachusetts). The 10 μL reaction system included 5 μL PCR Master Mix (2×), 0.2 μL mRNA forward primers (10 μM), 0.2 μL mRNA reverse primers (10 μM), 1 μL cDNA, 0.2 μL Dye (50×), and 3.4 μL ddH2O. The PCR cycles were 95°C for 3 minutes, 95°C for 3 seconds, 60°C for 20 seconds and 40 cycles, 95°C for 15 seconds, 60°C for 15 seconds, 95°C for 15 seconds. The original data were exported, and the amplification curve and melting curve were analyzed. We detected the specificity of the products from the melting curve and obtained the relative expression of sample genes. Finally, data were analyzed with quantification software using 2−ΔΔ Ct method.
2.3. Immunohistochemistry (IHC)
The frozen tissues were dehydrated at room temperature and fixed with 4% paraformaldehyde for 15 minutes. Tissues were paraffin-embedded and sectioned. The sections were incubated in 5% H2O2 at room temperature for 15 minutes, then incubated in ethylenediaminetetraacetic acid for 3 minutes at 140°C, washed 3 times in phosphate buffer saline (PBS), 5 minutes each. The sections were blocked with 5% goat serum for 20 minutes at 37°C and incubated with the primary antibody (1:100) (mouse-anti-MDM2 antibody [SMP 14] [ab3110, Abcam, Cambridge, United Kingdom]; rabbit-anti-P73 antibody [EP436Y]_[ab40658, Abcam, Cambridge, United Kingdom]; rabbit-anti -GADD45α antibody [ab76664, Abcam, Cambridge, United Kingdom]) overnight at 4°C. The samples were incubated with biotinylated secondary antibody for 30 minutes at room temperature. Sections were washed 4 times in PBS and dehydrated with sequential ethanol gradients (75%, 80%, and 100%). Images were acquired by optical microscopy. IHC images were analyzed by Image-pro plus 6.0 (IPP) software. The ratio of region of interest (ROI) to overall area was defined as the expression level, and the difference between cancer and cancer-adjacent tissues was compared. The details were as follows: images were randomly acquired from 5 different fields on each tissue, and the density of the background was adjusted to distinguish the background and the area of interest. The ROI (the brown staining area) on each image was defined and the total area was measured. The values from the 5 images were exported and the mean value was calculated. The accumulated integrated optical density (IOD) of the brown background in a selected field was measured, and the mean IOD was calculated by the formula: Mean IOD = IOD/(total area of the selected field).
2.4. Western Blot (WB)
Radio immunoprecipitation assay lysis buffer was used to extract the proteins from the cancer and cancer-adjacent tissues. 32 μL sample was loaded onto 10% sodium dodecyl sulfate-polyacrylamide gel electrophoresis, run at 90 V for 20 minutes, and 120 V for 50 minutes. Protein samples were transferred onto polyvinylidene fluoride membranes (0.45 μm) after electrophoresis. The membranes were incubated in ponceau and the protein bands were observed. The membranes were blocked in 5% BSA-tris-buffered saline tween-20 (TBST) for 1 hour, and then incubated with primary antibodies (1:500) (mouse-anti-MDM2 antibody [SMP 14] [ab3110, Abcam]; rabbit-anti-P73 antibody [EP436Y] [ab40658, Abcam]; rabbit-anti-GADD45α antibody [ab76664, Abcam]). Mouse-beta-actin was the internal control (TA-09, Zhongshanjinqiao, China) overnight at 4°C. Next day, the membranes were washed 3 times with TBST, 10 minutes each. The membranes were incubated with secondary antibodies (1:10,000) for 40 minutes at room temperature. After wash, the membranes were developed using enhanced chemiluminescence and exposed to X-ray. Gel Image system ver.4.00 (Tanon, China) software was used to analyze the WB outcomes and Gel-Pro analyzer was used to analyze the Greyscale for protein quantification. Beta-actin was used as the internal control. The formula for the calculation of mean grey value was as follows: Mean gray value = object value/internal control value. The experiments were repeated 3 times and the values were calculated and averaged.
2.5. Statistical analysis
SPSS 19.0 software was used for data analysis. Mean value and standard error (mean + standard deviation) were used to present mRNA and protein expression. Student t test was used to analyze the difference between cancer and cancer-adjacent tissues. Pearson test was used to analyze the correlation of the expression of these 3 genes. P < .05 indicated a statistical significance.
3. Results
3.1. Basic information of patients
The age of the patients were from 50 to 72 years old. All patients were from the Han ethnic group. The cancer types were divided into adenocarcinoma (59.7%), squamous carcinoma (22.6%), and others (17.7%). No tumor metastasis was found in all patients. No female patients had a history of smoking. The summary of the patients’ information is shown in Table 1.
Table 1.
The summary of patients’ information.

3.2. GADD45α and MDM2 mRNA expression
GADD45α and MDM2 mRNA levels were compared in all patients with lung cancer. There was no significant difference in GADD45α and MDM2 mRNA expression between cancer and cancer-adjacent tissues in all of the patients (data not shown). Next, we compared the mRNA expression of GADD45α and MDM2 in patients with squamous carcinoma or adenocarcinoma, respectively. No significant difference was discovered (data not shown). We further analyzed the correlation of GADD45α and MDM2 mRNA expression with gender, smoking history and tumor stages. There was no significant correlation of GADD45α and MDM2 mRNA expression in regards to gender, smoking history, and tumor stages. Therefore, we speculated that there was no significant diffrence in gene expression at transcriptional levels between normal and cancer tissues.
3.3. GADD45α, MDM2, and P73 protein expressions in IHC
We compared GADD45α, MDM2, and P73 protein expression between cancer and cancer-adjacent tissues using IPP software. We found that the density of cells in cancer tissues is higher than cancer-adjacent tissues, but the expression of GADD45α (P > .05), MDM2 (P > .05), and P73 (P > .05) was similar between cancer and cancer-adjacent tissues (Figs. 1 and 2A). We also compared the GADD45α, MDM2, and P73 protein expressions in cancer and cancer-adjacent tissues in patients with squamous carcinoma or adenocarcinoma, respectively. However, we did not find any significant difference (data not shown). Next, we analyzed the GADD45α, MDM2, and P73 protein expressions based on gender, smoking history, and tumor stages. We found that MDM2 expression significantly increased in cancer tissues only in the female patients (P = .01 < .05; Fig. 2B and C), but not in the male patients, which indicates that the MDM2 protein expression might be regulated by gender, and a higher level of MDM2 protein expression could be a risk factor for female patients with lung cancer. There was no significant difference in GADD45α and P73 expression in male and female patients. In addition, we compared GADD45α, MDM2, and P73 expression in squamous carcinoma and adenocarcinoma in female patients or male patients, but no significant difference was found. Moreover, no difference was discovered in smoking history and tumor stages.
Figure 1.

The images of GADD45α, MDM2, and P73 expression between cancer and cancer-adjacent tissues measured by IHC. Blue dot indicated nucleus, yellow area indicated the region of interest. GADD45α = growth arrest DNA damage-inducible gene 45α; IHCα = immunohistochemistry, MDM2α = mouse double minute 2 homolog.
Figure 2.
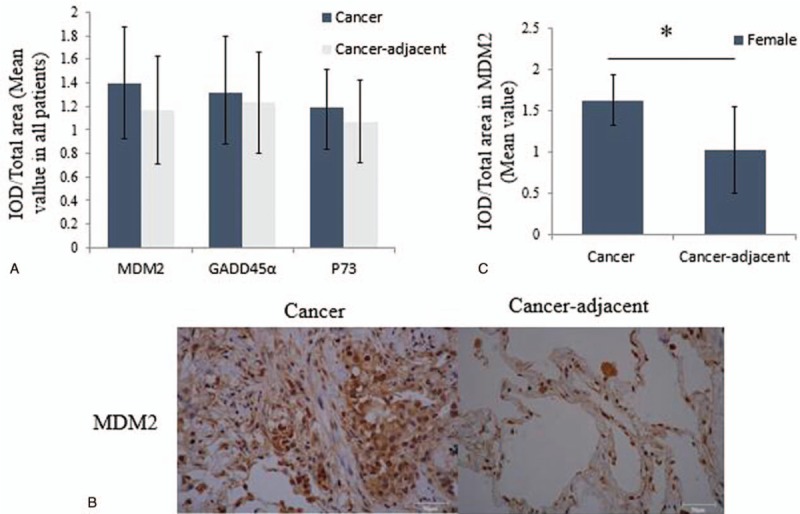
GADD45α, MDM2, and P73 protein expression measured by IHC in all patients. (A) The IOD/total area value of MDM2, GADD45α, and P73 between cancer and cancer-adjacent tissues in all patients analyzed by IPP software; (B) the IHC images of MDM2 between cancer and cancer-adjacent tissues in female patients; (C) the IOD/total area value of MDM2 between cancer and cancer-adjacent tissues in female patients; ∗P < .05, indicating a significant difference. GADD45αα = growth arrest DNA damage-inducible gene 45α, IHCα = immunohistochemistry, IODα = integrated optical density, IPPα = image-pro plus, MDM2α = mouse double minute 2 homolog.
3.4. GADD45α, MDM2, and P73 protein expressions in WB
WB was used to analyze the GADD45α, MDM2, and P73 protein expression. The representative images are shown in Figure 3A. The quantitative analysis indicates that there was no significant difference in the MDM2, GADD45α, and P73 protein levels expressions between cancer and cancer-adjacent tissues in all patients (P > .05; Fig. 3B). We also analyzed their protein expressions in patients with adenocarcinoma or squamous carcinoma, respectively. Interestingly, P73 expression significantly decreased in cancer tissues in patients with adenocarcinoma (P = .03 < .05; Fig. 3C). No other statistical difference was found
Figure 3.

WB results and quantitative analysis. (A) Image of Western blot showed the protein expression of GADD45α, MDM2, and P73. Cancer and cancer-adjacent tissue samples were from 8 patients. (B) The quantitative analysis (Gray value) of MDM2, GADD45α, and P73 in all patients; (C) the quantitative analysis (Gray value) of P73 between cancer and cancer-adjacent tissues in patients with SCC and ACC. T: tumor tissues; N: nontumor tissues. ∗P < .05, indicating a significant difference. ACCα = adenocarcinoma, GADD45αα = growth arrest DNA damage-inducible gene 45α; MDM2α = mouse double minute 2 homolog, SCCα = squamous carcinoma.
Next, we analyzed MDM2, P73, and GADD45α protein expressions based on gender, smoking history, and tumor stages. However, no significant difference in MDM2, GADD45α, and P73 was found in male, female, smoking, nonsmoking, T1-T2 or T3-T4 groups between cancer and cancer-adjacent tissues.
4. Discussion
In this study we compared GADD45α and MDM2 mRNA expression, and GADD45α, MDM2, and P73 protein expression between the cancer and cancer-adjacent tissues in patients with NSCLC. We found that there was no significant difference in GADD45α and MDM2 mRNA expression between cancer and cancer-adjacent tissues, based on gender, smoking history, and types of pathology.
For protein expression, we found that MDM2 protein expression was increased in cancer tissues only in female patients when analyzed by IHC, but not in male patients, or by WB. Moreover, P73 protein expression was lower in cancer tissues than cancer-adjacent tissues in patients with adenocarcinoma when analyzed by WB, but not squamous carcinoma or by IHC. Studies have shown that MDM2 expression is higher in cancer tissues compared to cancer-adjacent tissues.[27] The overexpression of MDM2 can lead to tumor formation, and MDM2 polymorphism is associated with an increased risk of cancer occurrence.[28,29] Hence, the high expression of MDM2 in female patients might be due to the MDM2 polymorphism.
Although MDM2 can mediate the activation of P53 and GADD45α,[30] it is still unclear whether MDM2 can also mediate P73 activation. P73 can act as an oncogene or a tumor suppressor gene under different conditions,[31] suggesting a complex regulatory mechanism of P73 in tumor formation. Previous studies have shown that P73 can regulate GADD45α expression in the absence of P53.[18] In our study MDM2 protein expression increased in cancer tissues, while P73 and GADD45α protein expression significantly decreased in cancer tissues, which are consistent with their reported function in lung cancer.
Interestingly, we also found that the mRNA and protein expression of GADD45α and MDM2 were not consistent. For example, a higher mRNA expression is not correlated with a higher protein expression. The inconsistent mRNA and protein expression may be due to
-
(1)
fast degradation of protein;
-
(2)
the protein expression is controled by post-transcriptional and translational factors;
-
(3)
we had to divide the tissues for q-PCR, WB, and IHC; therefore, each portion of the tissue may not be identical.
Studies have shown that mRNA expression may not be consistent with protein expression.[32] Moreover, the protein expression measured by IHC and WB are also different. Higashiyama et al[33] showed that MDM2 protein expression detected by IHC can be used as a marker for the diagnosis of NSCLC. Moreover, IHC can reveal more details about the expression of MDM2 in cancer and caner-adjacent tissues than WB. Therefore, our study is the first that discovered the gender difference in MDM2 protein expression in patients with lung cancer. Our results indicate that MDM2 protein level is higher in female patients with NSCLC, which can be used as a biomarker for the screening and treatment of NSCLC.
This study has some limitations. First, our samples were mainly from patients with adenocarcinoma or squamous carcinoma, and did not include many other types of NSCLC. Therefore, we did not analyzed the MDM2, P73, and GADD45α expressions in other types of NSCLC. Second, we did not measure P73 mRNA expression, so we could not analyze the relationship between the mRNA and protein expressions of P73. Third, we did not have enough samples for T3 and T4 stages of NSCLC, so we did not have more in depth analysis of TNM stages.
5. Conclusion
In conclusion, we compared the GADD45α, MDM2, and P73 mRNA and protein expression between cancer and cancer-adjacent tissues in all patients, as well as the patients with adenocarcinoma or squamous carcinoma, male or female, smoking or non-smoking, T1-T2 or T3-T4, respectively. We found that there is no significant difference in mRNA expression of GADD45α and MDM2. MDM2 protein expression significantly increased in cancer tissues only in female patients with NSCLC when it was analyzed by IHC, but not WB. P73 protein expression significantly decreased in cancer tissues in all patients with adenocarcinoma when analyzed by WB, but not IHC. There was no significant difference in GADD45α protein expression between cancer and cancer adjacent tissues. No correlation was discovered between GADD45α, MDM2 and P73.
Author contributions
Conceptualization: Bo Wang, Xiaodong Tian.
Data curation: Bo Wang, Huifeng Liu, Jixing Lin, Zhipeng Ren, Bin Wang, Kang Qi.
Formal analysis: Bo Wang, Jixing Lin, Kaijie Fan.
Funding acquisition: Xiaodong Tian.
Investigation: Chaoyang Liang, Huifeng Liu, Bailin Wang, Kaijie Fan, Zhipeng Ren.
Methodology: Bo Wang, Bin Wang, Xiaodong Tian.
Project administration: Xiaodong Tian.
Resources: Xiaodong Tian.
Software: Zhipeng Ren, Bin Wang, Kang Qi.
Visualization: Tong Li.
Writing – original draft: Bo Wang, Chaoyang Liang, Huifeng Liu, Jixing Lin, Kaijie Fan.
Writing – review and editing: Xiaodong Tian.
Footnotes
Abbreviations: GADD45α = growth arrest DNA damage-inducible gene 45α, IHC = immunohistochemistry, IOD = integrated optical density, MDM2 = mouse double minute 2 homolog, mRNA = messenger ribonucleic acid, NSCLC = non-small-cell lung carcinoma, q-PCR = quantitative real-time PCR, ROI = region of interest, RT-qPCR = reverse transcription quantitative real-time PCR, WB = western blot.
How to cite this article: Wang B, Liang C, Liu H, Lin J, Wang B, Fan K, Ren Z, Wang B, Li T, Qi K, Tian X. The expression of mouse double minute 2 homolog and P73 had no correlation with growth arrest DNA damage-inducible gene 45α in patients with non-small-cell lung carcinoma: A STROBE-compliant study. Medicine. 2019;98:51(e17944).
BW, CL, and HL contributed equally to this study.
BW, CL, and HL are the co-first authors.
The study was supported by the Natural Science Funding of Hainan Province (No. 817358).
The authors have no conflicts of interest to disclose.
References
- [1].Siegel RL, Miller KD, Jemal A. Cancer statistics, 2016. CA Cancer J Clin 2016;66:10–29. [DOI] [PubMed] [Google Scholar]
- [2].Murrayzmijewski F, Lane DP, Bourdon JC. p53/p63/p73 isoforms: an orchestra of isoforms to harmonise cell differentiation and response to stress. Cell Death Differ 2006;13:962–72. [DOI] [PubMed] [Google Scholar]
- [3].Han MH. Advance in research on relation of gadd45α and tumours. J Mod Oncol 2010;6:1358–9. [Google Scholar]
- [4].Moskalev AA, Smitmcbride Z, Shaposhnikov MV, et al. Gadd45 proteins: relevance to aging, longevity and age-related pathologies. Ageing Res Rev 2012;11:51–66. [DOI] [PMC free article] [PubMed] [Google Scholar]
- [5].Gao M, Guo N, Huang C, et al. Diverse roles of GADD45alpha in stress signaling. Curr Protein Pept Sci 2009;10:388–94. [DOI] [PubMed] [Google Scholar]
- [6].Hollander MC, Fornace AJ., Jr Genomic instability, centrosome amplification, cell cycle checkpoints and Gadd45a. Oncogene 2002;21:6228–33. [DOI] [PubMed] [Google Scholar]
- [7].Andrew D, Patterson JH, Albert J, et al. Neural tube development requires the cooperation of p53- and Gadd45a-associated pathways. Birth Defects Res Part A Clin Mol Teratol 2006;76:129–32. [DOI] [PubMed] [Google Scholar]
- [8].Barreto G, Schäfer A, Marhold J, et al. Gadd45a promotes epigenetic gene activation by repair-mediated DNA demethylation. Nature 2007;445:671–5. [DOI] [PubMed] [Google Scholar]
- [9].Rai K, Huggins IJ, James SR, et al. DNA demethylation in zebrafish involves the coupling of a deaminase, a glycosylase, and gadd45. Cell 2008;135:1201–12. [DOI] [PMC free article] [PubMed] [Google Scholar]
- [10].Takekawa M, Saito H. A family of stress-inducible GADD45-like proteins mediate activation of the stress-responsive MTK1/MEKK4 MAPKKK. Cell 1998;95:521–30. [DOI] [PubMed] [Google Scholar]
- [11].Hoffman B, Liebermann DA. Gadd45 modulation of intrinsic and extrinsic stress responses in myeloid cells. J Cell Physiol 2009;218:26–31. [DOI] [PubMed] [Google Scholar]
- [12].Tong T, Ji J, Jin S, et al. Gadd45a expression induces bim dissociation from the cytoskeleton and translocation to mitochondria. Mol Cell Biol 2005;25:4488–500. [DOI] [PMC free article] [PubMed] [Google Scholar]
- [13].Zerbini LF, Wang Y, Czibere A, et al. NF-kappa B-mediated repression of growth arrest- and DNA-damage-inducible proteins 45alpha and gamma is essential for cancer cell survival. Proc Natl Acad Sci U S A 2004;101:13618–23. [DOI] [PMC free article] [PubMed] [Google Scholar]
- [14].Higashi H, Vallböhmer D, Warnecke-Eberz U, et al. Down-regulation of Gadd45 expression is associated with tumor differentiation in non-small cell lung cancer. Anticancer Res 2006;26:2143–7. [PubMed] [Google Scholar]
- [15].Khoury MP, Bourdon JC. The isoforms of the p53 protein. Cold Spring Harbor Perspect Biol 2010;2:a000927. [DOI] [PMC free article] [PubMed] [Google Scholar]
- [16].Kaghad M, Bonnet H, Yang A, et al. Monoallelically expressed gene related to p53 at 1p36, a region frequently deleted in neuroblastoma and other human cancers. Cell 1997;90:809–19. [DOI] [PubMed] [Google Scholar]
- [17].Ikawa S, Nakagawara A. Ikawa Y. p53 family genes: structural comparison, expression and mutation. Cell Death Differ 1999;6:1154–61. [DOI] [PubMed] [Google Scholar]
- [18].Yang GT, Wang J, Wang JS. Effects of p73 and GADD45α protein on cell cycle arrest in Di(2-ethylhexyl)phthalate-treated L02 and Hep3B cells. J Environ Health 2011;8:663–6. [Google Scholar]
- [19].Zhu W, Pan X, Yang Z, et al. Expression and prognostic significance of TAp73 and (Np73 in FIGO stage I-II cervical squamous cell carcinoma. Oncol Lett 2015;9:2090–4. [DOI] [PMC free article] [PubMed] [Google Scholar]
- [20].Lam KY, Lo CY, Wat NMS, et al. The clinicopathological features and importance of p53, Rb, and mdm2 expression in phaeochromocytomas and paragangliomas. J Clin Pathol 2001;54:443–8. [DOI] [PMC free article] [PubMed] [Google Scholar]
- [21].Wang B, Liu X, Liu H, et al. Differential expressions of MDM2 and TAP73 in cancer and cancer-adjacent tissues in patients with non-small-cell lung carcinoma. Pulmonol 2018;3:155–63. [DOI] [PubMed] [Google Scholar]
- [22].Riley MF, You MJ, Multani AS, et al. Mdm2 overexpression and p73 loss exacerbate genomic instability and dampen apoptosis, resulting in B-cell lymphoma. Oncogene 2015;35:358–65. [DOI] [PMC free article] [PubMed] [Google Scholar]
- [23].Ongkeko WM, Wang XQ, Siu WY, et al. MDM2 and MDMX bind and stabilize the p53-related protein p73. Curr Biol 1999;9:829–32. [DOI] [PubMed] [Google Scholar]
- [24].Wang XQ, Ongkeko WM, Lau AW, et al. A possible role of p73 on the modulation of p53 level through MDM2. Cancer Res 2001;61:1598–603. [PubMed] [Google Scholar]
- [25].Zdzalik M, Pustelny K, Kedrackakrok S, et al. Interaction of regulators Mdm2 and Mdmx with transcription factors p53, p63 and p73. Cell Cycle 2010;9:4584–91. [DOI] [PubMed] [Google Scholar]
- [26].Whitley E, Ball J. Statistics review 4: sample size calculations. Crit Care 2002;6:335–41. [DOI] [PMC free article] [PubMed] [Google Scholar]
- [27].Ge H, Wang Q, Li C, et al. The relationship of MDM2 with microvascular density in non- small cell lung cancer and its significance. J Mod Oncol 2015. [Google Scholar]
- [28].Li W, Wang SS, Deng J, et al. Association of p73 gene G4C14-A4T14 polymorphism and MDM2 gene SNP309 with non-small cell lung cancer risk in a Chinese population. Oncol Lett 2017;14:1817–22. [DOI] [PMC free article] [PubMed] [Google Scholar]
- [29].Ortiz GJ, Li Y, Post SM, et al. Contrasting effects of an Mdm2 functional polymorphism on tumor phenotypes. Oncogene 2017;37:332–40. [DOI] [PMC free article] [PubMed] [Google Scholar]
- [30].Gao M LX, Dong W, Jin R, et al. Ribosomal protein S7 regulates arsenite-induced GADD45α expression by attenuating MDM2-mediated GADD45α ubiquitination and degradation. Nucleic Acids Res 2013;41:5210–22. [DOI] [PMC free article] [PubMed] [Google Scholar]
- [31].Müller M, Schilling T, Sayan AE, et al. TAp73/Delta Np73 influences apoptotic response, chemosensitivity and prognosis in hepatocellular carcinoma. Cell Death Differ 2005;12:1564–77. [DOI] [PubMed] [Google Scholar]
- [32].Kendrick N. A Gene's mRNA Level Does Not Usually Predict its Protein Level. Kendrick Laboratories, Inc: Madison, WD; 2014. [Google Scholar]
- [33].Doi O, Kodama K, Yokouchi H. MDM2 gene amplification and expression in non-small-cell lung cancer: immunohistochemical expression of its protein is a favourable prognostic marker in patients without p53 protein accumulation. Br J Cancer 1997;9:1302–8. [DOI] [PMC free article] [PubMed] [Google Scholar]