Supplemental Digital Content is available in the text
Keywords: Artificial intelligence, Pancreatic cancer, Diagnosis, Faster region-based Convolutional neural network
Abstract
Background:
Early diagnosis and accurate staging are important to improve the cure rate and prognosis for pancreatic cancer. This study was performed to develop an automatic and accurate imaging processing technique system, allowing this system to read computed tomography (CT) images correctly and make diagnosis of pancreatic cancer faster.
Methods:
The establishment of the artificial intelligence (AI) system for pancreatic cancer diagnosis based on sequential contrast-enhanced CT images were composed of two processes: training and verification. During training process, our study used all 4385 CT images from 238 pancreatic cancer patients in the database as the training data set. Additionally, we used VGG16, which was pre-trained in ImageNet and contained 13 convolutional layers and three fully connected layers, to initialize the feature extraction network. In the verification experiment, we used sequential clinical CT images from 238 pancreatic cancer patients as our experimental data and input these data into the faster region-based convolution network (Faster R-CNN) model that had completed training. Totally, 1699 images from 100 pancreatic cancer patients were included for clinical verification.
Results:
A total of 338 patients with pancreatic cancer were included in the study. The clinical characteristics (sex, age, tumor location, differentiation grade, and tumor-node-metastasis stage) between the two training and verification groups were insignificant. The mean average precision was 0.7664, indicating a good training effect of the Faster R-CNN. Sequential contrast-enhanced CT images of 100 pancreatic cancer patients were used for clinical verification. The area under the receiver operating characteristic curve calculated according to the trapezoidal rule was 0.9632. It took approximately 0.2 s for the Faster R-CNN AI to automatically process one CT image, which is much faster than the time required for diagnosis by an imaging specialist.
Conclusions:
Faster R-CNN AI is an effective and objective method with high accuracy for the diagnosis of pancreatic cancer.
Trial Registration:
ChiCTR1800017542; http://www.chictr.org.cn.
Introduction
Pancreatic cancer is one of the most common malignant tumors of the digestive system. Because of its fast progression, early metastasis, high mortality, and poor prognosis, pancreatic cancer has been regarded as the “king of cancer.”[1,2] Recently, the incidence of pancreatic cancer has begun to increase, and surgery is the main therapeutic strategy for these patients. However, due to the lack of specific clinical manifestations and serological markers, some patients have progressed to late-stage pancreatic cancer at the time of diagnosis and; therefore, miss the optimal time for radical surgery. Therefore, early diagnosis and accurate staging before surgery are key to improving the cure rate and prognosis.[3]
Pancreatic cancer diagnosis is difficult because the pancreas is a retroperitoneal organ that has a deep anatomical position with complicated surrounding structures. Due to its rapid development in recent years, imaging technology plays an important role in the diagnosis, staging, and prognosis of pancreatic cancer. Specifically, computed tomography (CT) avoids overlapping anatomical structures in obtained images due to high spatial and density resolutions. Therefore, CT has become the most commonly used method for imaging pancreatic cancer. The use of intravenous contrast agents during contrast-enhanced helical CT has become widely accepted for the diagnosis and staging of pancreatic cancer, with a bolus injection of contrast agent for dual-phase or triple-phase helical CT scanning being the most widely applied.[4] Relying on multiplanar reformatting and triple-phase dynamic contrast-enhanced scanning, imaging specialists can make careful and accurate judgments on the locations of tumor lesions, staging of lymph nodes, invasion of major blood vessels, and adjacent organs and presence of distant metastasis. During conventional diagnosis, specialists comparatively analyze a series of images of the patient by observing a video and extract and label pancreatic masses relying on their experience. This method requires specialists to perform tedious manual operations on a large amount of data. Furthermore, the accuracy and reliability of a diagnosis resulting from this method are largely dependent on the physicians’ experience and professional qualities, which limits the accuracy of the diagnostic results.[5] Therefore, the development of an automatic and accurate imaging processing technique that requires less manual intervention is of utmost importance.
Recently, the rapid development of computer technology and the maturation of image processing have driven the application of computer technology to the medical field, creating a new era of digital medicine.[6] With the help of computer technology, medical personnel can avoid tedious medical image analysis and inconsistency in diagnosis due to varying levels of expertise and clinical experience. The use of computer technology to process CT images and track and identify diseased tissue could substantially reduce manual operations, significantly increase the processing speed and produce consistent and highly accurate results that are convenient for integration and large-scale applications. Currently, automatic artificial intelligence (AI) identification of medical images is focused on lesion identification and labeling as well as automatic sketching and three-dimensional (3D) reconstruction of the target region. These processes all use deep learning to learn knowledge and build networks from a large number of medical images. Consequently, AI can diagnose specific lesions and has greater accuracy than highly experienced physicians in diagnosing lung, skin, prostate, breast, and esophageal cancers based on image recognition.[7–11]
Current AI identification methods are divided mainly into one-stage and two-stage methods. The one-stage method directly divides images into grids and obtains bounding boxes through regression and target categories of nodules at multiple locations of images. The two-stage method first produces several candidate regions and then sends them into the classification and regression network for training. Comparatively speaking, the two-stage object detection method adds the process of screening candidate regions where the one-stage method does not. Although its network training time is increased, the final detection and classification results are more accurate due to the balance of positive and negative sample proportions. The two-stage object detection methods include region-based convolution network (R-CNN), Fast R-CNN, and Faster R-CNN, in which feature extraction, proposal extraction, bounding box regression, and classification are integrated into one network, greatly improving the comprehensive performance and detection speed. Therefore, we chose advanced Faster R-CNN to build our AI diagnosis system with the aim to read CT images correctly and make diagnosis of pancreatic cancer faster.
Methods
Ethical approval
The protocols used in the study were approved by the Ethics Committee of the Affiliated Hospital of Qingdao University and conducted in full accordance with ethical principles. Specifically written informed consent was obtained from the patients that we could use their data without revealing their privacy. The study has been registered in the Clinical Trial Management Public Platform, which is organized by the Chinese Clinical Trial Registry. The registration number is ChiCTR1800017542.
Establishment of a sequential contrast-enhanced CT image database for patients diagnosed with pancreatic cancer
Patients with pathologically confirmed pancreatic ductal adenocarcinoma were recruited from the Affiliated Hospital of Qingdao University between January 2010 and January 2017. Inclusion criteria included the following: (1) Patients signed an informed consent form to participate in this study. We obtained specifically written informed consent from the included patients whose data we could use without revealing their privacy. (2) Patients received 64-slice contrast-enhanced helical CT examination before surgery. (3) All patients underwent surgical treatment and were diagnosed with pancreatic ductal adenocarcinoma by post-operative pathological examination, and the pathological tumor-node-metastasis (TNM) stage was determined. (4) Patients had detailed records of clinical and pathological features and treatment plans. The clinical and pathological features included age, sex, number of metastatic lymph nodes (via CT), number of metastatic lymph nodes (via pathology), tumor markers (carcinoembryonic antigen; carbohydrate antigen 199; carbohydrate antigen 125; carbohydrate antigen 153, and alpha-fetoprotein), N stage (via pathology), degree of tumor differentiation, presence or absence of intravascular tumor thrombus, and presence or absence of nerve infiltration. The exclusion criteria included the following: (1) patients who had malignancies in parts of the body other than the pancreas; (2) patients who were pancreatic cancer-free, as indicated by pathology examination; (3) patients who were allergic to the contrast agent; and (4) patients with heart, liver, or kidney deficiencies.
Establishment of a contrast-enhanced CT image database for pancreatic cancer
All patients underwent a dynamic scan of the upper abdomen using a 64-slice CT scanner (Toshiba, Japan). Toshiba Vitrea workstation (Toshiba) and Medican image management system (Toshiba) are used for image post-processing. CT scans were performed with the following acquisition parameters: 200-mA tube current, 120-kV tube voltage, and 0.625-mm slice thickness. A three-phase dynamic contrast-enhanced CT scan was performed. Scanning ranged from the top of the diaphragm to the bottom of the horizontal part of the duodenum. Eighty milliliters of non-ionic ioversol was injected as the contrast agent. Images at the arterial phase were acquired 35 s after contrast agent injection. Images at the venous phase were acquired 65 s post-injection. After scanning, images were uploaded to a 3D image workstation. Images were subjected to transverse reconstruction (slice spacing: 2 mm) and coronal and sagittal multiplanar reconstruction (slice thickness: 2 mm) using Vitrea software (Toshiba). All pancreatic cancer patients were staged using the TNM staging system according to the third version of the National Comprehensive Cancer Network guidelines published in 2017.[12] An image database was established so that AI could learn and train according to the images acquired using the enhanced CT scans. We acquired enhanced CT horizontal images from the abdomen of 338 pancreatic cancer patients. The number of images from each patient varied due to the differences in each patient's disease region, with an average of 15 to 20 images from each scan. A total of 6084 images were acquired from all patients. The images were divided into two groups: one group including 4385 images from 238 pancreatic cancer patients was used for training the AI system, and the other group including 1699 images from 100 pancreatic cancer patients was used for clinical verification. To train the AI system, the tumor location was marked in each image by senior experienced radiologists with more than 5 years of working experience. By comparing the images of pancreatic tumors with images of normal pancreatic tissue, chronic pancreatitis or other benign pancreatic tumors from the same level or other levels, the AI system could differentially memorize the cancer images. All images were entered into the AI system for leaning and training.
Automatic identification of pancreatic cancer based on deep learning
This study adopted the standard Faster R-CNN architecture, which consists of three parts: (1) a feature extraction network, a region proposal network (RPN), and a proposal classification and regression network. First, the feature extraction network used the VGG16 network to generate a convolutional feature map of the pancreatic cancer image. Then, the feature map was input into the RPN to generate candidates (also called regions of interest [ROIs]).[13] We added a small network for sliding scanning to the convolutional feature map. This network was fully connected to a 3 × 3 sliding window. Then, the sliding window was mapped to a 256-dimensional feature vector. We put this 256-dimensional feature vector into two sliding 1 × 1 fully connected layers, one for the bounding box regression to obtain the coordinates of the proposals and the other for the proposal classification to predict the probability score. At each sliding window, multiple region proposals were simultaneously predicted. The proposals were parameterized to some reference boxes, which we called anchors. If the number of anchors for each sliding position is denoted as k, the regression layer has 4k outputs encoding the coordinates of k bounding boxes, and the classification layer outputs 2k probability scores that predict the probability of each proposal being an object or not. An anchor is at the center of the indicated sliding window and is related to the scale and aspect ratio. In our experiment, we used three scales and three aspect ratios, which generated nine anchors (k = 9) at each sliding position. To acquire the candidate region proposals, a binary class label (being an object or not) was assigned to each anchor. A positive label was assigned to two types of anchors: (1) an anchor that has the highest intersection-over union (IoU) overlap with a ground truth bounding box or (2) an anchor that has an IoU overlap higher than 0.7. If the IoU of an anchor was less than 0.3 with all the ground truth boxes, then a negative label was assigned to the anchor. Using this method, the candidate regions, which are potential sites for pancreatic malignancies, were generated on a convolutional feature map. Then, non-maximum suppression was adopted to merge neighboring regions to reduce the number of region proposals for training, which substantially reduced the redundant calculations for proposal regression and classification.[14] The convolution map shared by the RPN and feature extraction network can acquire the coordinates and class probability scores of the predicted bounding box using the ROI pooling layer and the two succeeding sibling fully connected layers.[15] In this study, a two-step alternating training was performed by calculating the regression loss of the predicted bounding boxes compared to the ground truth boxes and the classification loss of the proposals. We trained the network through back propagation and stochastic gradient descent (SGD), and the network weight and parameters can be continuously updated and optimized. Finally, we obtained the final model as the AI diagnosis system.
Parameters and training of faster R-CNN
The establishment of the AI system for pancreatic cancer diagnosis based on sequential contrast-enhanced CT images was composed of two processes: training and identification. The four-step iterative Faster R-CNN training included the following: (1) The sequential contrast-enhanced CT images of an already labeled pancreatic cancer case, including the arterial phase, the venous phase, and the delayed phase, were input into the Faster R-CNN network. The images were converted into convolutional feature maps through the initial convolutional feature extraction layer. The RPN parameters were adjusted according to the feature maps, and information concerning metastatic lymph nodes was labeled to complete one RPN training and to create the ROI feature vector. (2) Then, the proposals generated by the previous RPN were put into the convolutional layer for regression and classification initialized by the ImageNet-pre-trained model. At this point, the layer parameters of the two networks were not shared at all. (3) The parameters in the classification and regression layer of the second step were used to initialize a new RPN, but the learning rates of those convolutional layers shared by the RPN and classification and regression layers were set to 0, which means that only those network layers unique to the RPN were updated in the training process. (4) The shared convolutional layers were unchanged, and the proposals obtained in the RPN of the third step were used to fine tune the unique convolutional layers in the classification and regression layers. During the training process, our study used all 4385 CT images in the database as the training data set. Additionally, we used VGG16, which was pre-trained in ImageNet and contained 13 convolutional layers and three fully connected layers, to initialize the feature extraction network.[16,17] We assigned all the weights in the ROI pooling layer and classification and regression layers a random number to have a zero-mean Gaussian distribution with a standard deviation of 100. The training process was composed of two steps. The first step included 80,000 training sessions of the RPN candidate region with a learning rate of 0.0001 for the first 60,000 sessions and 0.00001 for the next 20,000 sessions. The second step included 40,000 training sessions based on the classification and regression of the feature vector of the candidate region with a learning rate of 0.0001 for the first 30,000 sessions and 0.00001 for the next 10,000 sessions. Then, we repeated this training process. We used a momentum of 0.9 and a weight decay of 0.0005.[16] The scales of the RPN anchor were set to 1282, 2562, and 5122. The aspect ratios of the anchor were set to 0.5, 1, and 2. During the training process, we adjusted the deep learning network parameters, such as the weight, according to end-to-end backward-propagation data generated through the SGD method to reduce the value of the loss function and enable network convergence.[18] The loss curve of the Faster R-CNN is shown in Figure 1. According to Figure 1, the Faster R-CNN network obtained good decay after 240,000 training iterations for the identification and diagnosis of pancreatic cancer.
Figure 1.
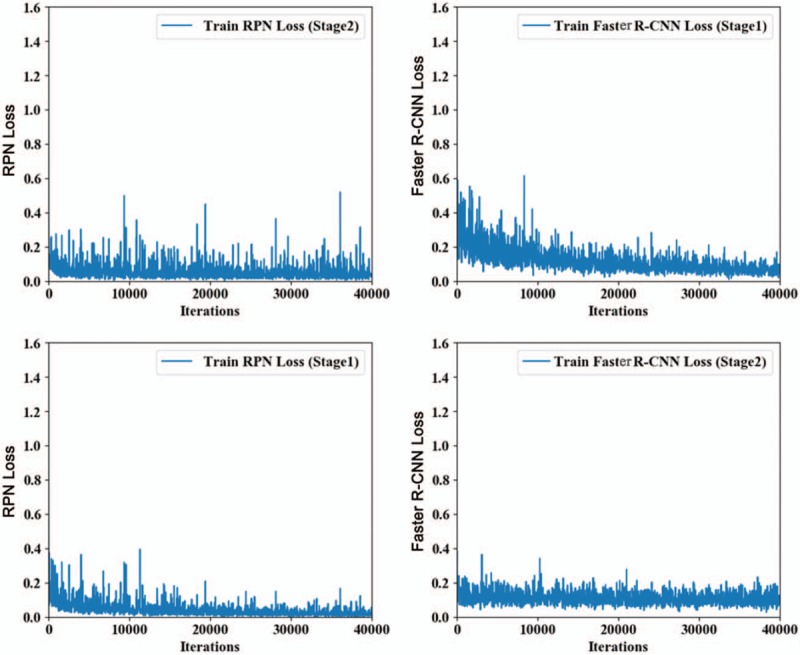
Faster R-CNN loss curve during training with 4385 computed tomography images in the database as the training data set. R-CNN: Region-based convolutional neural network; RPN: Region proposal network.
Test experiments of the faster R-CNN database
In the identification experiment, we used sequential clinical CT images from 238 cases of pancreatic cancer as our experimental data and input these data into the Faster R-CNN model that had completed training. First, we generated the convolutional feature map using the feature extraction network. Then, we screened the feature map using the RPN and generated a potential pancreatic cancer region proposal to acquire a fixed-length feature vector.[19] Finally, the feature vector were input into two fully connected layers, one for the region classification to determine whether the region is a node and compute the probability score, and the other for the fine regression of the bounding box to improve coordinate accuracy. The identification results are shown in Figure 2 (the left column is results labeled by the Faster R-CNN AI system, and the right column is ground truth results labeled by the imaging specialists). In the end, 230 images contained node regions with identification probabilities higher than 0.7, and 210 images showed an overlap rate greater than 0.7 with the ground truth labeled by imaging specialists.
Figure 2.
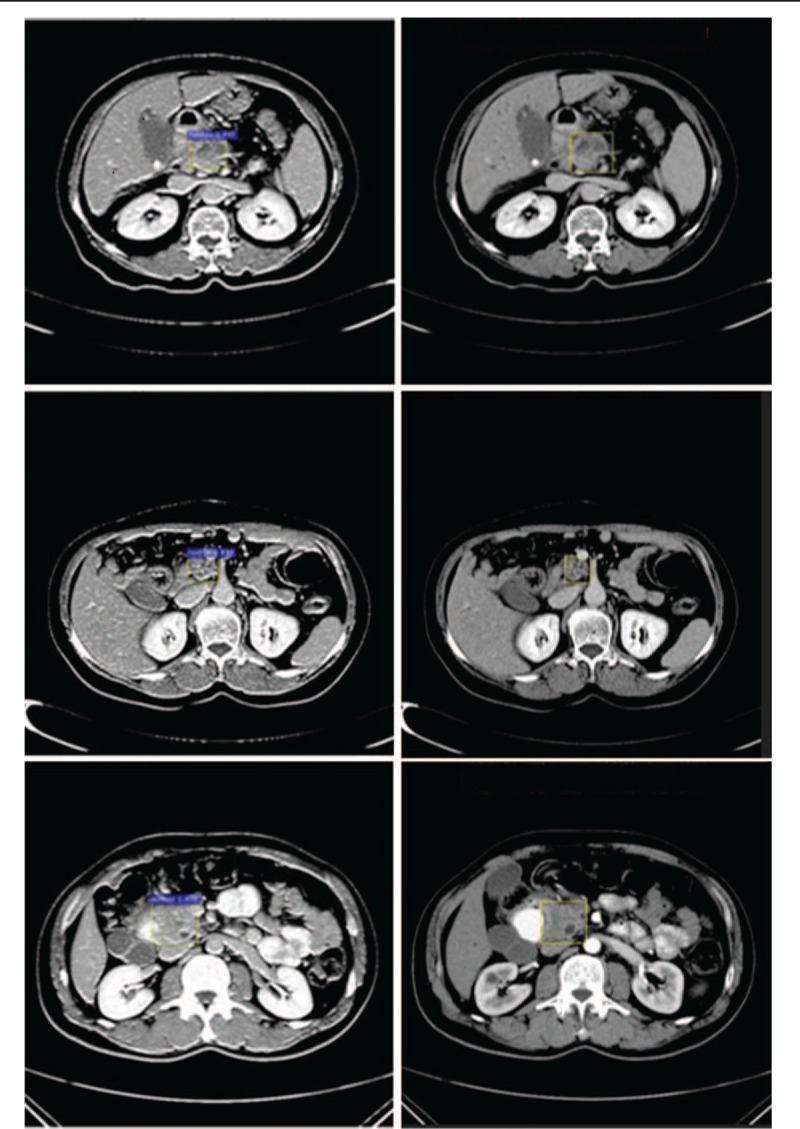
Annotated pancreatic cancer samples by computer and physicians. The left panels show labeling by the computer (purple), and the right panels show labeling by physicians (yellow rectangle).
Statistical analysis
In our issue, we consider the pancreatic tumor as the positive sample, normal region as the negative sample. Faster R-CNN solves a dichotomous problem, which has four types of classification results as follows: (1) If an instance is a positive sample and is predicted to be positive, it is true positive (TP). (2) If an instance is a positive sample but is predicted to be negative, it is false negative (FN). (3) If an instance is a negative sample but is predicted to be positive, it is false positive (FP). (4) If an instance is a negative sample but is predicted to be negative, it is true negative (TN). We quantitatively evaluate the performance of the results with the following four metrics: true positive rate (TPR), false positive rate (FPR), precision (P) and recall (R), which is defined as:
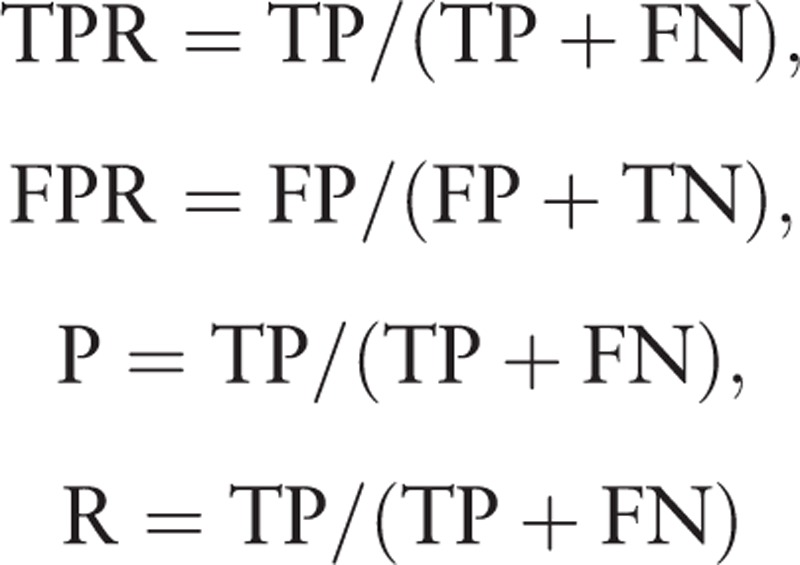 |
Next, we take the probability of each test sample belonging to the positive class as the threshold. When the probability of the test samples belonging to the positive class is greater than or equal to this threshold, we consider it as a positive sample, otherwise, it is a negative sample. Thus, we get a set of precision (P) and recall (R) rate at each threshold which is used as the abscissa and ordinate of the points on the precision-recall (P-R) curve, and a set of FPR and TPR at each threshold used as the abscissa and ordinate of the points on the receiver operating characteristic (ROC) curve. Area under the ROC curve (AUC) is between 0.1 and 1. The average precision (AP) of every class is also calculated, and mean average precision (mAP) is the average of the APs from all classes. When the mAP value is closer to 100%, Faster R-CNN identification is more precise. Results are presented as the mean ± standard deviation. Statistical analyses of differences between two groups were compared by the Chi-square test, the independent t test or paired t test. All statistical analyses were performed with SPSS version 19.0 (SPSS Inc., Chicago, IL, USA). Values of P < 0.05 were considered statistically significantly.
Results
General clinical features of the subjects
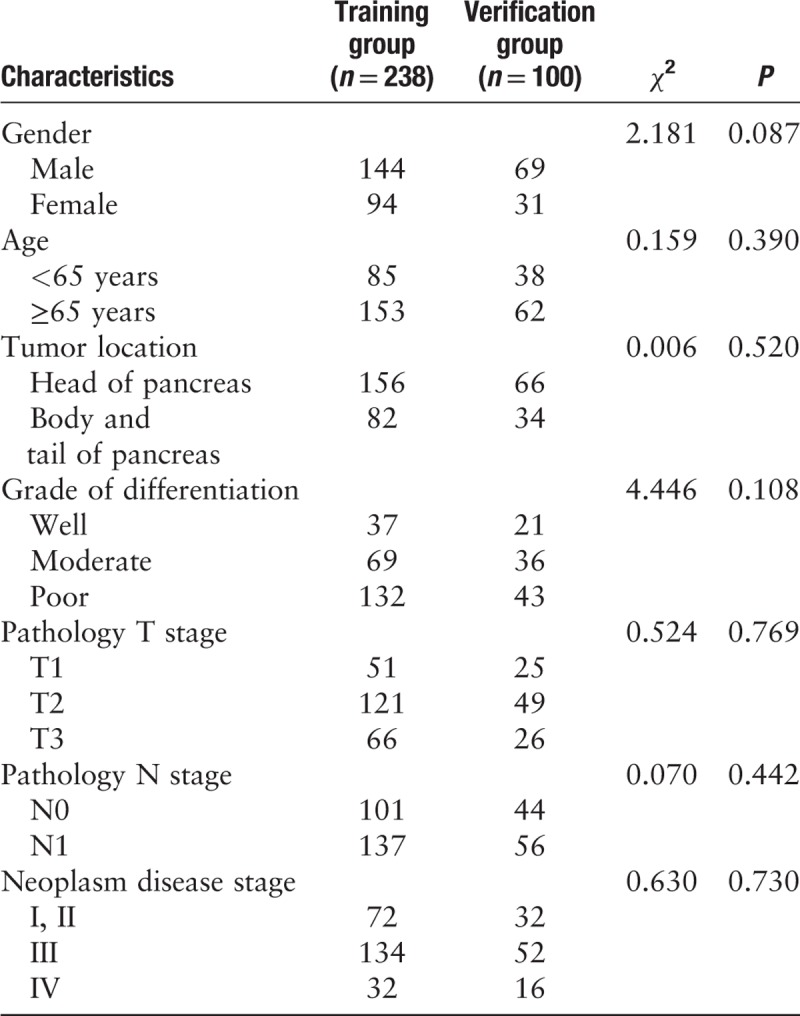
Among the 338 patients with pancreatic cancer, 213 were male, and 125 were female. The male-to-female ratio was 1.7:1. Tumors were localized to the head of the pancreas in 222 cases and to the body or tail in 116 cases. The numbers of cases with low differentiation, moderate differentiation, and high differentiation were 175, 105, and 58, respectively. According to the TNM staging system, 104 cases were at stage I and II, 186 cases were at stage III, and 48 cases were at stage IV. R0 resection was performed in 303 cases, and R1 was performed in 35 cases. The clinical characteristics (sex, age, tumor location, differentiation grade, and TNM stage) between the two training and verification groups were insignificant [Table 1]. In the training group, the CA19-9 values ranged from 9.3 to 3814.8 U/mL, with mean value of 691.4 ± 177.93 U/mL. In the verification group, the CA19-9 values ranged from 17.1 to 4181.3 U/mL, with mean value of 754.4 ± 112.8 U/mL. The numbers of cases of intravascular tumor thrombus were 11 and six in the training and verification groups, respectively. The number of cases with tumor nerve infiltration was 15 and nine in the training and verification groups, respectively. There were no significant differences in tumor markers, intravascular tumor thrombus, and tumor nerve infiltration between the training and verification groups.
Table 1.
Clinical characteristics of patients between training group and testing group, n.
Analysis of pancreatic cancer enhanced CT sequence database
Sequential contrast-enhanced CT images of the upper abdomen of patients and images processed using multiple techniques were analyzed blindly by two highly experienced imaging specialists and one pancreatic surgery specialist. These specialists evaluated and labeled tumors together and recorded consistent diagnosis and evaluation results. Consensus was reached after a discussion if disagreement occurred. Pancreatic imaging showed that the masses might be circular, oval or irregularly lobulated low-density lesions. There were no clear boundaries between the masses and their surrounding normal pancreatic tissues. Some patients had pancreatic duct dilation. Because our current training program does not support 3D identifications, we labeled the horizontal images of each patient for training. Additionally, we referred to the coronal and sagittal planes to determine pancreatic malignancies. We established a sequential CT imaging database of 6084 images for pancreatic cancer. According to the final diagnostic results from the imaging specialists, this database encompassed patients with early, middle, and late-stage pancreatic cancer.
Evaluation of the training effect of the AI platform
We input the 4385 sequential CT images for pancreatic cancer to the Faster R-CNN deep neural network and subjected Faster R-CNN to four-step iterative training sessions. The training parameters are shown in Supplementary Table 1. We obtained the trained Faster R-CNN detection model and output the loss function values of the whole network. The results are shown in Figure 1. To evaluate the learning effect of the Faster R-CNN deep neural network, we performed a preliminary test by inputting 1699 sequential CT images selected randomly from the established training database into the trained detection model. To reflect the machine learning of the training process in detail, we recorded the precision and recall rates of the nodule class during training and plotted the PR curve. The area under the curve was 0.7664, that is, the AP was 0.7664. Because this experiment included only one class, the nodule class, the mAP was 0.7664, indicating a good training effect of Faster R-CNN. Therefore, Faster R-CNN went through effective training of the sequential pancreatic cancer CT images.
We compared the identification of the training data using Faster R-CNN with image labels in the database and calculated the identification precision (mAP) during Faster R-CNN training. The mAP of the main collection is the average of the mAPs from all classes. When the mAP value was closer to 100%, the identification by Faster R-CNN was more precise. The result is shown in Figure 3.
Figure 3.
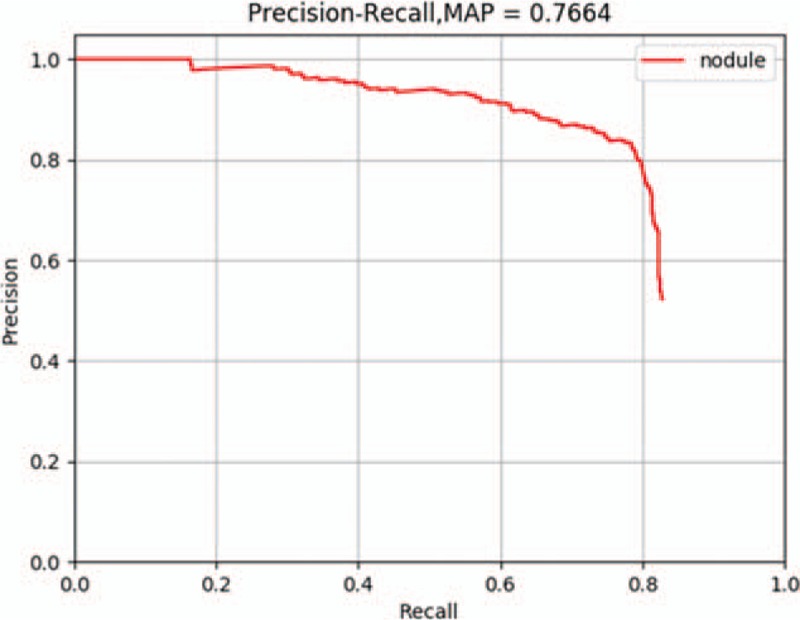
The precision-recall curve of the Faster R-CNN training process. The mAP of the main collection is the average of the average precisions from all classes. When the mAP value is closer to 100%, Faster R-CNN identification is more precise. mAP: Mean average precision; R-CNN: Region-based convolutional neural network.
Clinical validation of the CT image diagnosis of pancreatic cancer using the AI system
We collected information from 100 pancreatic cancer patients and subjected the AI platform for pancreatic cancer diagnosis to sequential contrast-enhanced CT images for clinical testing and verification. The final diagnosis was made by three imaging specialists through a rigorous analysis of the CT images together with pathological evidence. After processing, the images were input to the Faster R-CNN model that had completed training. Diagnosis results were generated by the AI system, including pancreatic cancer diagnosis and tumor location. The results were compared with the ground truth results labeled by the specialists. The sensitivity, specificity, and accuracy of the AI pancreatic cancer diagnostic system were analyzed. Next, to observe and analyze the detection and classification results of the AI system more straightforwardly, we classified all the labeled regions of the test collection into TP and FP outcomes and obtained the TPR and FPR at different probability thresholds. The ROC curve of the Faster R-CNN-based AI-assisted diagnosis system is shown in Figure 4. As the AUC approaches 1, a better diagnostic effect is revealed. AUC has low accuracy when it is between 0.5 and 0.7, a certain degree of accuracy when it is between 0.7 and 0.9, and a high accuracy when above 0.9. The AUC calculated according to the trapezoidal rule was 0.9632, which reflects the accuracy of the results in the testing process.[20,21] This value indicates that the diagnostic capability of the trained Faster R-CNN AI system is quite high. Moreover, the AI-assisted diagnosis was very effective. In our test, it took approximately 0.2 s for the Faster R-CNN AI system to automatically process one CT image. The average number of enhanced CT images from one patient is 15, so the time required for automatic diagnosis using the AI system is 3 s, which is much faster than the time required for diagnosis by an imaging specialist (8 min).
Figure 4.
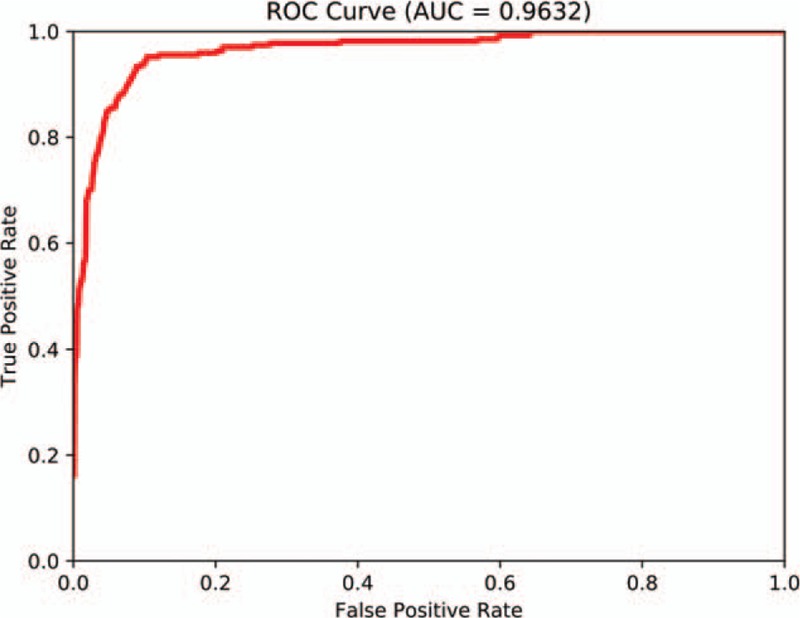
Receiver operating characteristic curve of Faster R-CNN in diagnosing pancreatic cancer. AUC: Area under the receiver operating characteristic curve; R-CNN: Region-based convolutional neural network; ROC: Receiver operating characteristic.
Discussion
In this study, using the Faster R-CNN deep neural network, we established an AI system for the diagnosis of pancreatic cancer based on sequential contrast-enhanced CT images. This system assists imaging specialists in more precise diagnosis and has important clinical significance for pre-operative pancreatic cancer diagnosis and for determining treatment plans. We first collected 3000 sequential pancreatic cancer contrast-enhanced CT images and established a pancreatic cancer CT image database based on the diagnosis of imaging specialists and pathological results. Based on this database, we established an AI system for the automatic detection of pancreatic cancer that was validated in a test experiment. Next, we collected pancreatic cancer enhanced CT image data from multiple centers for clinical validation. Our results show that the AUC of the AI platform of the CT image-assisted diagnosis was 0.9632. The duration of the assisted diagnosis was 20 s/person, which is significantly shorter than the time required for diagnosis by imaging specialists. Our study indicates that AI has decent clinical feasibility. Therefore, the AI diagnosis system was more effective and objective than the conventional diagnostic method.
Because of the introduction of the selectable search concept, R-CNN has become predominant in the field of AI automatic identification. Faster R-CNN integrates the ROI pooling layer in the R-CNN and makes the number of targets identifiable by Faster R-CNN more flexible. Additionally, Faster R-CNN integrates the RPN, which effectively reduces the number of repeated calculations. Faster R-CNN has achieved rapid real-time target identification and has become the best technique in the field of AI automatic identification. Therefore, we used Faster R-CNN for automatic identification. In this study, we used a deep learning transfer learning technique so that we could use a small number of sequential CT images and location labels as the training data set. In this manner, we could achieve highly precise feature extraction using a small amount of new data and eventually achieve highly precise identification. Faster R-CNN designs an RPN for efficient and accurate region proposal generation. By sharing convolutional features with Faster R-CNN, the RPN cost is nearly negligible, which helps our system identify pancreatic lesions in real-time. It is worth noting that the speed of our AI technology system to obtain test results is approximately 200 ms per image, which is significantly shorter than the time required for diagnosis by imaging specialists. In addition, we also evaluated the performance of our AI system on 100 cases of pancreatic cancer. The mAP was 0.7664, which means our model has good performance for every class. Faster R-CNN enables a unified, deep learning-based object detection system that could improve object detection accuracy. To evaluate the diagnostic effort of Faster R-CNN, we drew a ROC curve. The AUC calculated according to the trapezoidal rule was 0.9632, which demonstrates the superior efficiency of pancreatic lesion detection.
However, there are still limitations to our research. This is a retrospective analysis of patients from a single center. To further validate the clinical application value of Faster R-CNN in the AI diagnosis of pancreatic cancer, our next step is to perform a prospective study based on multicenter clinical data. Moreover, as we have previously reported in other literature, although the results of the study indicate that the diagnostic accuracy of deep learning platforms is better than that of radiologists, this research aims to develop an assistive tool to aid radiologists in making effective and accurate diagnoses, not to be a substitute for doctors.[22] Finally, the testing group includes only patients with pancreatic cancer, and patients with other pancreatic lesions and normal patients were excluded, which may limit the value of Faster-R-CNN for pancreatic cancer diagnosis to some extent. To further validate the clinical application value of the system in AI diagnosis, our next step is to perform a prospective study based on multicenter clinical data. Moreover, the training group and testing group will be reorganized. The inclusion criteria will include not only patients with pancreatic cancer but also patients with benign pancreatic lesions and normal patients.
In this study, to solve the problems of subjective judgment, lack of objectivity and repeatability, and poor diagnostic accuracy of the pre-operative image diagnosis of pancreatic cancer, we established an AI system to assist in pancreatic cancer diagnosis based on sequential contrast-enhanced CT images using the Faster R-CNN deep neural network. This platform might assist imaging specialists in providing more accurate pancreatic cancer diagnoses and thus has tremendous clinical significance for pre-operative pancreatic cancer staging and selecting patient treatment plans.
Funding
This work was supported by grants from the National Natural Science Foundation of China (No. 81802888) and the Key Research and Development Project of Shandong Province (No. 2018GSF118206 and No. 2018GSF118088).
Conflicts of interest
None.
Supplementary Material
Footnotes
How to cite this article: Liu SL, Li S, Guo YT, Zhou YP, Zhang ZD, Li S, Lu Y. Establishment and application of an artificial intelligence diagnosis system for pancreatic cancer with a faster region-based convolutional neural network. Chin Med J 2019;132:2795–2803. doi: 10.1097/CM9.0000000000000544
References
- 1.Siegel RL, Miller KD, Jemal A. Cancer statistics, 2018. CA Cancer J Clin 2018; 68:7–30. doi: 10.3322/caac.21442. [DOI] [PubMed] [Google Scholar]
- 2.Aslan M, Shahbazi R, Ulubayram K, Ozpolat B. Targeted therapies for pancreatic cancer and hurdles ahead. Anticancer Res 2018; 38:6591–6606. doi: 10.21873/anticanres.13026. [DOI] [PubMed] [Google Scholar]
- 3.McGuigan A, Kelly P, Turkington RC, Jones C, Coleman HG, McCain RS. Pancreatic cancer: a review of clinical diagnosis, epidemiology, treatment and outcomes. World J Gastroenterol 2018; 24:4846–4861. doi: 10.3748/wjg.v24.i43.4846. [DOI] [PMC free article] [PubMed] [Google Scholar]
- 4.Zhu L, Dai MH, Wang ST, Jin ZY, Wang Q, Denecke T, et al. Multiple solid pancreatic lesions: prevalence and features of non-malignancies on dynamic enhanced CT. Eur J Radiol 2018; 105:8–14. doi: 10.1016/j.ejrad.2018.05.016. [DOI] [PubMed] [Google Scholar]
- 5.Du T, Bill KA, Ford J, Barawi M, Hayward RD, Alame A, et al. The diagnosis and staging of pancreatic cancer: a comparison of endoscopic ultrasound and computed tomography with pancreas protocol. Am J Surg 2018; 215:472–475. doi: 10.1016/j.amjsurg.2017.11.021. [DOI] [PubMed] [Google Scholar]
- 6.Walczak S, Velanovich V. An evaluation of artificial neural networks in predicting pancreatic cancer survival. J Gastrointest Surg 2017; 21:1606–1612. doi: 10.1007/s11605-017-3518-7. [DOI] [PubMed] [Google Scholar]
- 7.Esteva A, Kuprel B, Novoa RA, Ko J, Swetter SM, Blau HM, et al. Dermatologist-level classification of skin cancer with deep neural networks. Nature 2017; 542:115–118. doi: 10.1038/nature21056. [DOI] [PMC free article] [PubMed] [Google Scholar]
- 8.Nakamura K, Yoshida H, Engelmann R, MacMahon H, Katsuragawa S, Ishida T, et al. Computerized analysis of the likelihood of malignancy in solitary pulmonary nodules with use of artificial neural networks. Radiology 2000; 214:823–830. doi: 0.1148/radiology.214.3.r00mr22823. [DOI] [PubMed] [Google Scholar]
- 9.Chen CM, Chou YH, Han KC, Hung GS, Tiu CM, Chiou HJ, et al. Breast lesions on sonograms: computer-aided diagnosis with nearly setting-independent features and artificial neural networks. Radiology 2003; 226:504–514. doi: 0.1148/radiol.2262011843. [DOI] [PubMed] [Google Scholar]
- 10.Hou Q, Bing ZT, Hu C, Li MY, Yang KH, Mo Z, et al. RankProd combined with genetic algorithm optimized artificial neural network establishes a diagnostic and prognostic prediction model that revealed C1QTNF3 as a biomarker for prostate cancer. EBioMedicine 2018; 32:234–244. doi: 10.1016/j.ebiom.2018.05.010. [DOI] [PMC free article] [PubMed] [Google Scholar]
- 11.Horie Y, Yoshio T, Aoyama K, Yoshimizu S, Horiuchi Y, Ishiyama A, et al. Diagnostic outcomes of esophageal cancer by artificial intelligence using convolutional neural networks. Gastrointest Endosc 2018; 89:25–32. doi: 10.1016/j.gie.2018.07.037. [DOI] [PubMed] [Google Scholar]
- 12. [[Accessed October 20, 2019]]. National Comprehensive Cancer Network (NCCN) Clinical Practice Guidelines in Oncology, 2017. Available from: https://www.nccn.org/professionals/physician_gls/f_guidelines.asp. [Google Scholar]
- 13.Shin HC, Roth HR, Gao M, Lu L, Xu Z, Nogues I, et al. Deep convolutional neural networks for computer-aided detection: CNN architectures, dataset characteristics and transfer learning. IEEE Trans Med Imaging 2016; 35:1285–1298. doi: 10.1109/TMI.2016.2528162. [DOI] [PMC free article] [PubMed] [Google Scholar]
- 14.He K, Zhang X, Ren S, Sun J. Spatial pyramid pooling in deep convolutional networks for visual recognition. IEEE Trans Pattern Anal Mach Intell 2015; 37:1904–1906. doi: 10.1109/TPAMI.2015.2389824. [DOI] [PubMed] [Google Scholar]
- 15.Ren S, He K, Girshick R, Sun J. Faster R-CNN: towards real-time object detection with region proposal networks. IEEE Trans Pattern Anal Mach Intell 2017; 39:1137–1149. doi: 10.1109/TPAMI.2016.2577031. [DOI] [PubMed] [Google Scholar]
- 16.Suzuki K, Li F, Sone S, Doi K. Computer-aided diagnostic scheme for distinction between benign and malignant nodules in thoracic low-dose CT by use of massive training artificial neural network. IEEE Trans Med Imaging 2005; 24:1138–1150. doi: 10.1109/TMI.2005.852048. [DOI] [PubMed] [Google Scholar]
- 17.Sarikaya D, Corso JJ, Guru KA. Detection and localization of robotic tools in robot-assisted surgery videos using deep neural networks for region proposal and detection. IEEE Trans Med Imaging 2017; 36:1542–1549. doi: 10.1109/TMI.2017.2665671. [DOI] [PubMed] [Google Scholar]
- 18. [[Accessed October 20, 2019]]. Rich Feature Hierarchies for Accurate Object Detection and Semantic Seg-mentation: IEEE Conference on Computer Vision and Pattern Recognition (CVPR), 2014. Available from: https://arxiv.org/pdf/1311.2524.pdf. [Google Scholar]
- 19. [[Accessed October 20, 2019]]. Caffe: Convolutional Architecture for Fast Feature Embedding: MM 2014-Proceedings of the 22nd ACM International Conference on Multimedia. 2014. Available from: https://arxiv.org/pdf/1408.5093.pdf. [Google Scholar]
- 20.Hajian-Tilaki K. Receiver operating characteristic (ROC) curve analysis for medical diagnostic test evaluation. Caspian J Intern Med 2013; 4:627–635. [PMC free article] [PubMed] [Google Scholar]
- 21.Park SH, Goo JM, Jo CH. Receiver operating characteristic (ROC) curve: practical review for radiologists. Korean J Radiol 2004; 5:11–18. doi: 0.3348/kjr.2004.5.1.11. [DOI] [PMC free article] [PubMed] [Google Scholar]
- 22.Lu Y, Yu Q, Gao Y, Zhou Y, Liu G, Dong Q, et al. Identification of metastatic lymph nodes in MR imaging with faster region-based convolutional neural networks. Cancer Res 2018; 78:5135–5143. doi: 10.1158/0008-5472.CAN-18-0494. [DOI] [PubMed] [Google Scholar]
Associated Data
This section collects any data citations, data availability statements, or supplementary materials included in this article.


