

Abstract
Background:
Obstructive sleep apnea hypopnea syndrome (OSAHS) is a contributing factor for non-alcoholic fatty liver disease (NAFLD). Non-invasive algorithms including fatty liver index (FLI) and hepatic steatosis index (HSI) have been used as a screening test for NAFLD in epidemiologic studies. The aim of this study is to compare the diagnostic accuracy of FLI and HSI for NAFLD detection in adults with OSAHS.
Methods:
We enrolled consecutive adult subjects who were newly diagnosed with OSAHS from March 2016 to January 2018. NAFLD was diagnosed by ultrasonography. The accuracy and cut-off point of the FLI and HSI to detect NAFLD were assessed by analyzing the area under the receiver operating characteristic (AUROC) curve and the maximum Youden index analysis, respectively.
Results:
The 326 subjects were diagnosed as NAFLD according to ultrasound findings, while 105 subjects who had normal abdominal ultrasonography were grouped as controls. Both FLI and HSI values were significantly higher in patients with NAFLD compared with controls. The AUROC of FLI and HSI for predicting NAFLD was 0.802 (95% confidence interval [CI] 0.762–0.839) and 0.753 (95% CI 0.710–0.793), respectively. The AUROC of FLI was significantly higher than that of HSI (P = 0.0383). The optimal cut-off value of FLI and HSI was 60 (sensitivity 66% and specificity 80%) and 35 (sensitivity 81% and specificity 60%), respectively.
Conclusions:
Both FLI and HSI can serve as screening tools for NAFLD in OSAHS adults. The FLI shows better performance in diagnosing NAFLD than HSI.
Trial registration:
Chinese Clinical Trial Registry (No. ChiCTR-OOB-15007253), http://www.chictr.org.cn/showproj.aspx?proj=11606.
Keywords: Obstructive sleep apnea hypopnea syndrome, Fatty liver index, Hepatic steatosis index, Non-alcoholic fatty liver disease
Introduction
Obstructive sleep apnea hypopnea syndrome (OSAHS) is characterized by repeated episodes of upper airways obstruction during sleep that result in episodes of hypoxia and has an estimated prevalence ranging from 2% to 4% in general population and 35% to 45% in obese individuals.[1,2] OSAHS is associated with various components of metabolic syndrome, including visceral obesity, hypertension, dyslipidemia, and insulin resistance.[3–5] Thus it is unsurprising that OSAHS is also associated with another manifestation of metabolic dysfunction, non-alcoholic fatty liver disease (NAFLD).[6–8]
NAFLD, characterized by an abnormal accumulation of fat in hepatocytes, is increasingly recognized as a major public health concern for being highly prevalent in the general population worldwide. Due to the increasing prevalence of obesity and metabolic syndrome, NAFLD now ranks the leading cause of chronic liver disease and abnormal liver function tests in China.[9] The prevalence of NAFLD in most Asian countries, including China, is estimated to be above 25%.[10] The frequency of biochemical and histological diagnosis of NAFLD was found to be higher in patients with OSAHS compared with control subjects, and even greater in severe OSAHS patients.[7,11,12] In light of the high prevalence of NAFLD in OSAHS patients, screening patients with OSAHS for the presence of NAFLD is warranted and should be part of the health-related risk evaluation of these patients.
The gold standard in the diagnosis of NAFLD is liver biopsy. However, it is not routinely performed because it is an invasive and expensive tool that has some health risks and economic costs. Various non-invasive algorithms, based on metabolic and anthropometric variables, such as fatty liver index (FLI)[13] and hepatic steatosis index (HSI),[14] have been used as a screening test for NAFLD in epidemiologic studies or identify potential patients for further clinical investigation.[15–18] The evaluation of both FLI and HSI diagnostic performance has been reported in various populations.[13,14,17,18] However, external validation of them in OSAHS patients, a population with a high prevalence of NAFLD, is rare. Considering OSAHS patients are more obese and have worse clinical and laboratory parameters than that of the general population, it is worthy to explore and validate FLI and HSI for screening of NAFLD in adults with OSAHS.
The aim of this study is to compare the diagnostic accuracy of FLI and HSI for NAFLD detection in adults with OSAHS (mild to moderate vs. severe). The secondary aim is to determine the optimal cut-off point of the FLI and HSI for predicting NAFLD in OSAHS adults.
Methods
Ethical approval
The study protocol conforms to the ethical guidelines of the 1975 Declaration of Helsinki. The study was approved by the Institutional Review Boards of Zhangzhou Affiliated Hospital of Fujian Medical University and the First Affiliated Hospital of Fujian Medical University and all subjects signed written informed consent. The study was registered with the Chinese Clinical Trial Registry (No. ChiCTR-OOB-15007253).
Study subjects
The study was conducted from March 2016 to January 2018 at two sleep laboratories: the Sleep Laboratory of Zhangzhou Affiliated Hospital of Fujian Medical University and the Sleep Laboratory of the First Affiliated Hospital of Fujian Medical University. Consecutive adult patients (age >18 years) who were newly diagnosed with OSAHS (apnea hypopnea index [AHI] ≥5 events/h) by polysomnography (PSG) were recruited. A standard questionnaire about sleep symptoms, alcohol consumption, medical history, and medications was completed by every patient. Exclusion criteria were as follows: (1) patients who had been previously diagnosed with OSAHS and treated with continuous positive airway pressure (CPAP) or other medical therapies; (2) patients with excessive alcohol use (defined as >20 g/d for males and 10 g/d for females); (3) patients with hepatitis virus B and/or C (systematic history and blood tests); (4) patients with autoimmune hepatitis, drug-induced liver damage or other liver diseases; (5) patients who had other medical conditions that may affect FLI and HSI levels.
Anthropometric and biochemical measurements
Body weight and height were measured in bare feet and light indoor clothing in the morning. Body mass index (BMI) was defined as weight (kg)/height2 (m2). Waist circumference (WC) was measured midway between the lower costal margin and the iliac crest and neck circumference (NC) at the level of the laryngeal prominence. Fasting blood was taken in the morning after a whole-night PSG for the measurement of serum glucose, alanine aminotransferase (ALT), aspartate aminotransferase (AST), gamma-glutamyltransferase (GGT), and lipid profile comprising total cholesterol (TC), high density lipoprotein-cholesterol (HDL-C), low density lipoprotein-cholesterol (LDL-C), and triglycerides (TG).
Polysomnographical evaluation
Diagnostic PSG was performed on all subjects using standard techniques, as previously described by our group.[19] Polysomnographical parameters including AHI, oxygen desaturation index (ODI), lowest O2 saturation (LaSO2), mean nocturnal oxygen saturation (average SpO2), and the percentage of sleep time with SpO2 <90% (T90%) were recorded. The severity of OSAHS was determined by the AHI and the included OSAHS patients were sub-divided into two groups: mild to moderate OSAHS (5≤ AHI <30) and severe OSAHS (AHI ≥30).
Evaluation of NAFLD
Ultrasonography
Abdominal ultrasound examination was performed in all cases. Images hepatic steatosis was determined as diffusely increased echogenicity of the hepatic parenchyma compared to the kidneys, vascular blurring, and deep-echo attenuation as previously described.[19] NAFLD was defined as subjects with fatty liver disease by ultrasonography in the absence of excessive alcohol consumption.
FLI
The FLI, calculated in each participant, is a non-invasive method of assessing hepatic steatosis and is calculated by the following formula. The FLI was calculated based on laboratory and anthropometric measures, including TG, GGT, BMI, and WC, by the following formula: FLI = (e0.953 × loge (TG/0.0113)+0.139 × BMI + 0.718 × loge (GGT) + 0.053 × WC − 15.745)/(1 + e0.953 × loge (TG/0.0113)+0.139 × BMI +0.718 × loge (GGT) + 0.053 × WC − 15.745) × 100.
HSI
The HSI was calculated based on laboratory and anthropometric measures, including ALT, AST, and BMI, by the following formula: HSI = 8 × ALT/AST ratio + BMI (+2, if diabetes mellitus; +2, if female). The presence of diabetes mellitus was defined as a fasting glucose of ≥126 mg/dL or treatment with anti-diabetic medication.
Statistical analysis
Data were tested for normal distribution before analysis. Data were expressed as mean ± standard deviation, median (interquartile range), number (percentage) for normally distributed, skewed and categorical data, respectively. Differences in normally distributed continuous variables between groups were determined by using Student's t test whereas differences in non-normally distributed continuous variables were compared by using Mann-Whitney U-test. Chi-square test or Fisher exact test was performed for categorical variables. We used receiver operating characteristic (ROC) curve analyses with area under curve (95% confidence interval [CI]) to determine FLI and HSI in NAFLD detection in each group separately. Comparison between ROC curves was performed using the method described by De Long et al[20] Effective cut-off values were determined using ROC curves. A value of P < 0.05 was considered statistically significant. All statistical analyses were conducted using MedCalc 18.10 (MedCalc Software bvba, Ostend, Belgium) and SPSS17.0 (SPSS, Inc, Chicago, IL, USA).
Results
A total of 431 subjects were included in the study. The 326 subjects were diagnosed as NAFLD according to ultrasound findings, while the remaining 105 subjects who had normal abdominal ultrasonography were grouped as controls.
Table 1 reports clinical, biochemical and anthropometric characteristics of all subjects with and without NALFD. No significant differences in LDL-C and sex ratio were detected between NAFLD group and controls. Patients with NAFLD tended to be younger. Compared to control subjects, those with NAFLD had significantly larger NC, WC, BMI, higher levels of fasting glucose, TC, TG, ALT, AST, ALT/AST ratio, GGT, higher AHI, ODI, T90%, but lower LaSO2, average SpO2, HDL-C. Both FLI and HSI values were also significantly higher in patients with NAFLD.
Table 1.
Comparisons of clinical, biochemical, and anthropometric characteristics of subjects with and without NAFLD.

Table 2 summarizes the validity of FLI and HSI in detecting NAFLD in all OSAHS patients, mild to moderate and severe OSAHS patients. In the total population, both FLI and HSI were able to discriminate between patients with and without NAFLD. The area under the receiver operating characteristic (AUROC) of FLI and HSI for predicting NAFLD was 0.802 (95% CI 0.762–0.839) and 0.753 (95% CI 0.710–0.793), respectively [Figure 1]. The AUROC of FLI was significantly higher than that of HSI (difference between areas 0.049, standard error 0.024, 95% CI 0.003–0.096, Z statistic 2.072, P = 0.038). In mild to moderate OSAHS patients, the AUROC of FLI and HSI for predicting NAFLD was 0.770 (95% CI 0.698–0.832) and 0.732 (95% CI 0.658–0.798), respectively [Figure 2]. In severe OSAHS patients, The AUROC of FLI and HSI for predicting NAFLD was 0.802 (95% CI 0.749–0.848) and 0.748 (95% CI 0.692–0.799), respectively [Figure 3]. There were no significant differences in the discriminant abilities between FLI and HSI in mild to moderate subjects or severe OSAHS patients.
Table 2.
Diagnostic performance of FLI and HSI in OSA patients (mild to moderate vs. severe).
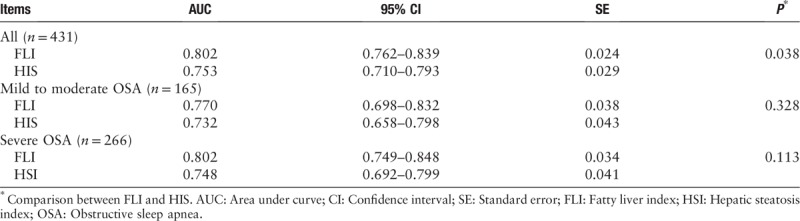
Figure 1.
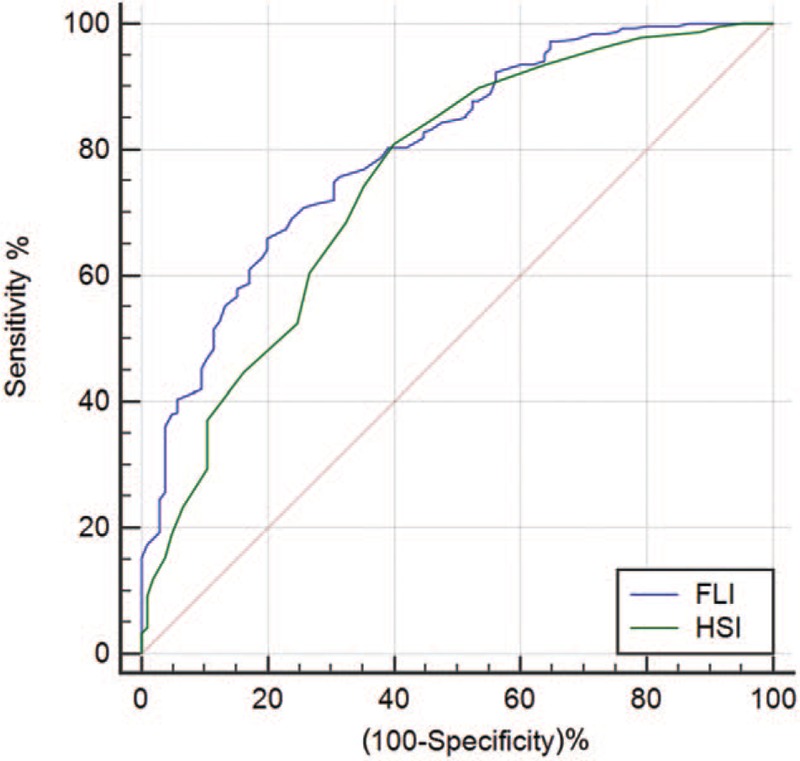
ROC curve comparisons between FLI and HSI in detecting NAFLD in OSAHS patients. FLI: Fatty liver index; HSI: Hepatic steatosis index; NAFLD: Non-alcoholic fatty liver disease; OSAHS: Obstructive sleep apnea hypopnea syndrome; ROC: Receiver operating characteristic.
Figure 2.
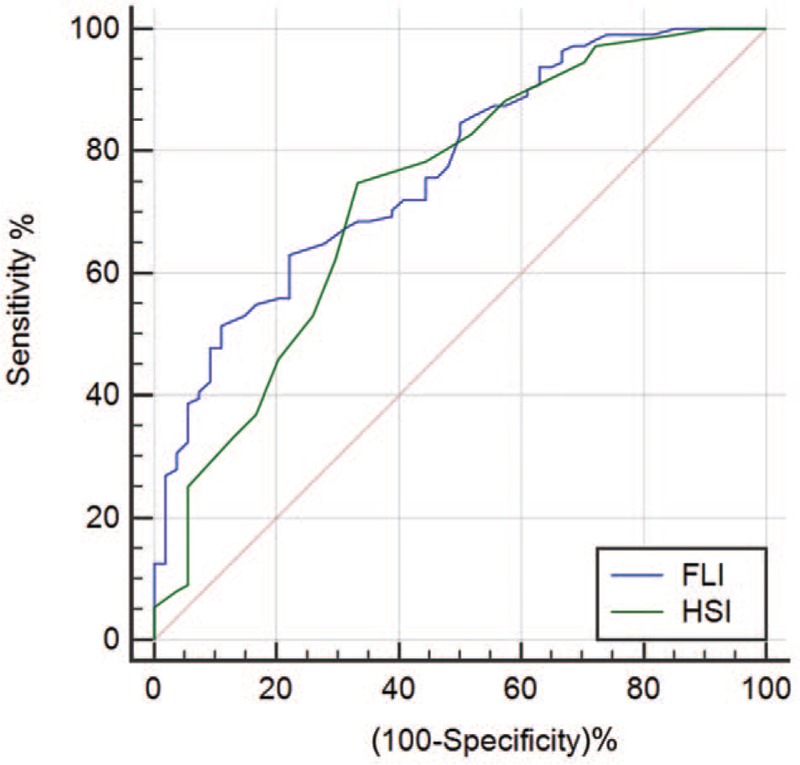
ROC curve comparisons between FLI and HSI in detecting NAFLD in mild to moderate OSAHS patients. FLI: Fatty liver index; HSI: Hepatic steatosis index; NAFLD: Non-alcoholic fatty liver disease; OSAHS: Obstructive sleep apnea hypopnea syndrome; ROC: Receiver operating characteristic.
Figure 3.

ROC curve comparisons between FLI and HSI in detecting NAFLD in severe OSAHS. FLI: Fatty liver index; HSI: Hepatic steatosis index; NAFLD: Non-alcoholic fatty liver disease; OSAHS: Obstructive sleep apnea hypopnea syndrome; ROC: Receiver operating characteristic.
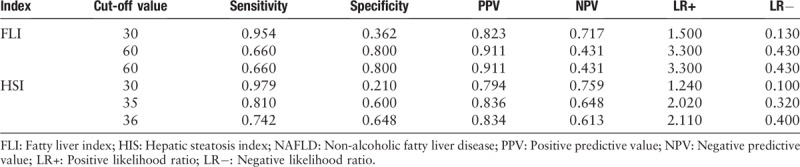
Table 3 shows the optimal cut-off value of FLI and HSI in identifying NAFLD in OSAHS patients. The best cut-off value of FLI and HSI was 60 (sensitivity 66% and specificity 80%) and 35 (sensitivity 81% and specificity 60%), respectively. According to the cut-off values proposed by Bedogni et al,[13] sensitivity and specificity of FLI <30 for predicting absence of NAFLD were 95% and 36%, respectively. When the cut-off value came to ≥60 for predicting presence of NAFLD, sensitivity and specificity were 66% and 80%, respectively. According to the cut-off values proposed by Lee et al,[14] sensitivity and specificity of HSI <30 for predicting absence of NAFLD were 98% and 21%, respectively. When the cut-off value came to >36 for predicting presence of NAFLD, sensitivity and specificity were 74% and 65%, respectively.
Table 3.
The optimal cut-off value of FLI and HSI in detecting NAFLD.
Discussion
In this study, we aimed to evaluate the ability of FLI and HSI, based on simple clinical parameters, to detect NAFLD in a group of OSAHS patients. The major finding was that both FLI and HSI could be valuably screened NAFLD in OSAHS patients. The FLI showed better performance in terms of higher AUROC in diagnosing NAFLD than HSI. The respective optimal cut-off value of FLI and HSI to discriminate NAFLD in OSAHS patients was 60 and 35, with acceptable sensitivity and specificity.
Several studies evaluating diagnostic performance of FLI and HSI have been conducted in Europe and Asia. A study including 228 subjects with ultrasound diagnosis of fatty liver and 268 subjects without fatty liver showed that an FLI <30 can be used to rule out (sensitivity 87%; negative likelihood ratio 0.2) and an FLI ≥60 to rule in hepatic steatosis (specificity 86%; positive likelihood ratio 4.3).[13] Yang et al[21] enrolled 29,797 consecutive subjects who received health check-up services and showed that FLI had the best discriminative ability to identify patients with ultrasonographic fatty liver with an AUROC of 0.827. A retrospective cross-sectional study performed in western China found that AUROC of FLI for predicting NAFLD was 0.880 (95% CI 0.874–0.886).[22] The ROC analysis showed that the optimal cut-off value for FLI in diagnosing NAFLD was 30.420 with sensitivity 83% and specificity 77%.[22] With respect to HSI, a cross-sectional study with 10,724 health check-up subjects reported that HSI had an AUROC of 0.812 (95% CI 0.801–0.824). At values of <30.0 or >36.0, HSI ruled out NAFLD with a sensitivity of 93%, or detected NAFLD with a specificity of 92%, respectively.[14] Zhu et al[22] found that AUROC of FLI was significantly higher than that of HSI. Another study focusing on patients with type 1 diabetes also found that the diagnostic performance of FLI (AUROC 0.860) was better than HSI (AUROC 0.750).[17]
Accumulating evidence has shown that OSAHS is an independent risk factor of NAFLD. Our previous studies demonstrated that OSAHS was independently associated with liver steatosis and elevation of serum aminotransferases. Serum ALT declined significantly after 3 months of CPAP treatment.[23] Aron-Wisnewsky et al[24] studied 101 subjects getting bariatric surgery and found that hypoxic burden was independently predictive of liver fibrosis and NAFLD activity score. A recent study including 124 patients suspected OSAHS suggested a dose-response relationship between OSAHS severity and liver stiffness. Severe OSAHS was independently associated with significant fibrosis.[25] High prevalence of OSAHS was also found in OSAHS patients.[11,12] A study found that the prevalence of ultrasound diagnosis of NAFLD was up to 83% in 137 subjects who underwent PSG for suspected OSAHS.[12] While another study showed that prevalence of liver steatosis was 66% and 83% in mild to moderate and severe OSAHS patients, respectively.[11]
Based on the close relationship between OSAHS and NAFLD and the evidence of high prevalence of NAFLD in OSAHS patients, our study focused on OSAHS patients and showed that the AUROC of FLI and HSI for predicting NAFLD was 0.802 and 0.753, respectively. The performance of FLI and HSI in our pilot study was weaker as compared to that described by other studies.[13,14,21] However, another study indicated that the AUROC for FLI and HSI in detecting liver steatosis were found to be low (FLI 0.647 and HSI 0.637) in 220 patients with type 2 diabetes.[26] Factors such as ethnicity, morbidities, method for diagnosis of liver steatosis, sample size, and different prevalence of NAFLD could be responsible for different diagnostic efficacy of the indices. Consistent with other studies,[17,22] we demonstrated that performance of FLI tended to be better than HSI in identifying NAFLD. In the present study, the best cut-off value of FLI and HSI was 60 (sensitivity 66% and specificity 80%) and 35 (sensitivity 81% and specificity 60%), respectively. Consistent with the results of the present study, our previous study with a group population with OSAHS showed that the best cut-off value of FLI was 60 in diagnosing NAFLD.[27]
An FLI <30 was suggested to be used to rule out NAFLD with sensitivity 87% and specificity 64% by Bedogni et al[13] At a value of <30.0, HSI could rule out NAFLD with a sensitivity 91% and specificity 40%.[14] Our study showed that sensitivity and specificity of FLI <30 for predicting absence of NAFLD were 95% and 36%, respectively. Sensitivity and specificity of HSI <30 for predicting absence of NAFLD were 98% and 21%, respectively. Both indices showed high sensitivity, while the specificity was relatively low. If they are to be used to screen the NAFLD, it should be further evaluated carefully combining with other factors.
Even though the gold standard in the diagnosis of NAFLD is liver biopsy, it is not routinely performed because it is an invasive and expensive tool. Currently, the diagnosis of NAFLD is usually made by ultrasonography in a clinical setting. Compared with ultrasonography, the indices have several advantages. First, FLI is a feasible marker that involves four clinical available parameters, and it is easily calculated in an office setting. It is easier to access in comparing with ultrasonography. Second, it is more cost-effective; it is reported to cost only 20 Yuan per capita to obtain the results of all parameters.[22] The application of these indices may help the selection of a potential population before imaging tests, which lowers the cost. Third, it is a quantitative method for the evaluation of fatty liver disease, while ultrasonography is a semi-quantitative method. Lastly, FLI could be applied not only for screening fatty liver disease, but also has been increasingly used to be a maker to predict atherosclerotic lesions, cardiovascular and non-cardiovascular mortality as well as all-cause mortality.[15,16,28,29]
This study has several limitations that are worth noting. First, a selection bias is possible because subjects were recruited from among individuals who were presented to our sleep laboratories due to symptoms of sleep apnea and were diagnosed as OSAHS by PSG. Second, ultrasonography was used as a diagnostic tool for NAFLD, lacking data of the liver biopsy in our study. Previous studies reported that its sensitivity decreased while hepatic steatosis was less than 20% to 30%.[30,31] Third, the severity of hepatic steatosis was not accessed, which restrained us to find specific cut-offs for steatosis quantification in OSAHS patients with NAFLD. Fourth, compared with the sample size of other studies which focused on general population, the sample size of the present study was relatively small. However, we only focused on the OSAHS population diagnosed based on PSG and included the patients at two sleep laboratories. Lastly, ultrasonography was not performed by a single ultrasound technician. There may have been intra-operator and inter-operator variability in interpreting fatty liver on ultrasonography despite the same criteria.
In conclusion, both FLI and HSI can serve as screening tools for NAFLD in OSAHS patients. The FLI shows better performance in diagnosing NAFLD than HSI. The respective optimal FLI and HSI cut-off value to discriminate NAFLD in OSAHS patients is 60 and 35, with an acceptable sensitivity and specificity.
Funding
This work was supported by the grants from the Youth Research Fund from Fujian Provincial Health Bureau (No. 2015-1-98) and Startup Fund for Scientific Research from Fujian Medical University (No. 2017XQ1117).
Conflicts of interest
None.
Footnotes
How to cite this article: Chen LD, Huang JF, Chen QS, Lin GF, Zeng HX, Lin XF, Lin XJ, Lin L, Lin QC. Validation of fatty liver index and hepatic steatosis index for screening of non-alcoholic fatty liver disease in adults with obstructive sleep apnea hypopnea syndrome. Chin Med J 2019;00:00–00. doi: 10.1097/CM9.0000000000000503
References
- 1.Young T, Palta M, Dempsey J, Skatrud J, Weber S, Badr S. The occurrence of sleep-disordered breathing among middle-aged adults. N Engl J Med 1993; 328:1230–1235. doi: 10.1056/NEJM199304293281704. [DOI] [PubMed] [Google Scholar]
- 2.Lindberg E, Gislason T. Epidemiology of sleep-related obstructive breathing. Sleep Med Rev 2000; 4:411–433. doi: 10.1053/smrv.2000.0118. [DOI] [PubMed] [Google Scholar]
- 3.Drager LF, Togeiro SM, Polotsky VY, Lorenzi-Filho G. Obstructive sleep apnea: a cardiometabolic risk in obesity and the metabolic syndrome. J Am Coll Cardiol 2013; 62:569–576. doi: 10.1016/j.jacc.2013.05.045. [DOI] [PMC free article] [PubMed] [Google Scholar]
- 4.Lam JC, Lam B, Lam CL, Fong D, Wang JK, Tse HF, et al. Obstructive sleep apnea and the metabolic syndrome in community-based Chinese adults in Hong Kong. Respir Med 2006; 100:980–987. doi: 10.1016/j.rmed.2005.10.003. [DOI] [PubMed] [Google Scholar]
- 5.Ip MS, Lam B, Ng MM, Lam WK, Tsang KW, Lam KS. Obstructive sleep apnea is independently associated with insulin resistance. Am J Respir Crit Care Med 2002; 165:670–676. doi: 10.1164/ajrccm.165.5.2103001. [DOI] [PubMed] [Google Scholar]
- 6.Mesarwi OA, Loomba R, Malhotra A. Obstructive sleep apnea, hypoxia, and nonalcoholic fatty liver disease. Am J Respir Crit Care Med 2019; 199:830–841. doi: 10.1164/rccm.201806-1109TR. [DOI] [PMC free article] [PubMed] [Google Scholar]
- 7.Musso G, Cassader M, Olivetti C, Rosina F, Carbone G, Gambino R. Association of obstructive sleep apnoea with the presence and severity of non-alcoholic fatty liver disease. A systematic review and meta-analysis. Obes Rev 2013; 14:417–431. doi: 10.1111/obr.12020. [DOI] [PubMed] [Google Scholar]
- 8.Musso G, Olivetti C, Cassader M, Gambino R. Obstructive sleep apnea-hypopnea syndrome and nonalcoholic fatty liver disease: emerging evidence and mechanisms. Semin Liver Dis 2012; 32:49–64. [DOI] [PubMed] [Google Scholar]
- 9.Fan JG, Wei L, Zhuang H. Guideline of prevention and treatment of nonalcoholic fatty liver disease (2018, China). J Dig Dis 2018; 20:163–173. doi: 10.1111/1751-2980.12685. [DOI] [PubMed] [Google Scholar]
- 10.Younossi ZM, Koenig AB, Abdelatif D, Fazel Y, Henry L, Wymer M. Global epidemiology of nonalcoholic fatty liver disease-meta-analytic assessment of prevalence, incidence, and outcomes. Hepatology 2016; 64:73–84. doi: 10.1002/hep.28431. [DOI] [PubMed] [Google Scholar]
- 11.Trzepizur W, Boursier J, Mansour Y, Le Vaillant M, Chollet S, Pigeanne T, et al. Association between severity of obstructive sleep apnea and blood markers of liver injury. Clin Gastroenterol Hepatol 2016; 14:1657–1661. doi: 10.1016/j.cgh.2016.04.037. [DOI] [PubMed] [Google Scholar]
- 12.Cakmak E, Duksal F, Altinkaya E, Acibucu F, Dogan OT, Yonem O, et al. Association between the severity of nocturnal hypoxia in obstructive sleep apnea and non-alcoholic fatty liver damage. Hepat Mon 2015; 15:e32655.doi: 10.5812/hepatmon.32655. [DOI] [PMC free article] [PubMed] [Google Scholar]
- 13.Bedogni G, Bellentani S, Miglioli L, Masutti F, Passalacqua M, Castiglione A, et al. The fatty liver index: a simple and accurate predictor of hepatic steatosis in the general population. BMC Gastroenterol 2006; 6:33.doi: 10.1186/1471-230X-6-33. [DOI] [PMC free article] [PubMed] [Google Scholar]
- 14.Lee JH, Kim D, Kim HJ, Lee CH, Yang JI, Kim W, et al. Hepatic steatosis index: a simple screening tool reflecting nonalcoholic fatty liver disease. Dig Liver Dis 2010; 42:503–508. doi: 10.1016/j.dld.2009.08.002. [DOI] [PubMed] [Google Scholar]
- 15.Kozakova M, Palombo C, Eng MP, Dekker J, Flyvbjerg A, Mitrakou A, et al. Fatty liver index, gamma-glutamyltransferase, and early carotid plaques. Hepatology 2012; 55:1406–1415. doi: 10.1002/hep.25555. [DOI] [PubMed] [Google Scholar]
- 16.Calori G, Lattuada G, Ragogna F, Garancini MP, Crosignani P, Villa M, et al. Fatty liver index and mortality: the Cremona study in the 15th year of follow-up. Hepatology 2011; 54:145–152. doi: 10.1002/hep.24356. [DOI] [PubMed] [Google Scholar]
- 17.Sviklane L, Olmane E, Dzerve Z, Kupcs K, Pirags V, Sokolovska J. Fatty liver index and hepatic steatosis index for prediction of non-alcoholic fatty liver disease in type 1 diabetes. J Gastroenterol Hepatol 2018; 33:270–276. doi: 10.1111/jgh.13814. [DOI] [PubMed] [Google Scholar]
- 18.Kahl S, Strassburger K, Nowotny B, Livingstone R, Kluppelholz B, Kessel K, et al. Comparison of liver fat indices for the diagnosis of hepatic steatosis and insulin resistance. PLoS One 2014; 9:e94059.doi: 10.1371/journal.pone.0094059. [DOI] [PMC free article] [PubMed] [Google Scholar]
- 19.Lin QC, Chen LD, Chen GP, Zhao JM, Chen X, Huang JF, et al. Association between nocturnal hypoxia and liver injury in the setting of nonalcoholic fatty liver disease. Sleep Breath 2015; 19:273–280. doi: 10.1007/s11325-014-1008-7. [DOI] [PMC free article] [PubMed] [Google Scholar]
- 20.DeLong ER, DeLong DM, Clarke-Pearson DL. Comparing the areas under two or more correlated receiver operating characteristic curves: a nonparametric approach. Biometrics 1988; 44:837–845. doi: 10.2307/2531595. [PubMed] [Google Scholar]
- 21.Yang BL, Wu WC, Fang KC, Wang YC, Huo TI, Huang YH, et al. External validation of fatty liver index for identifying ultrasonographic fatty liver in a large-scale cross-sectional study in Taiwan. PLoS One 2015; 10:e0120443.doi: 10.1371/journal.pone.0120443. [DOI] [PMC free article] [PubMed] [Google Scholar]
- 22.Zhu J, He M, Zhang Y, Li T, Liu Y, Xu Z, et al. Validation of simple indexes for nonalcoholic fatty liver disease in western China: a retrospective cross-sectional study. Endocr J 2018; 65:373–381. doi: 10.1507/endocrj.EJ17-0466. [DOI] [PubMed] [Google Scholar]
- 23.Chen LD, Zhang LJ, Lin XJ, Qi JC, Li H, Wu Z, et al. Association between continuous positive airway pressure and serum aminotransferases in patients with obstructive sleep apnea. Eur Arch Otorhinolaryngol 2018; 275:587–594. doi: 10.1007/s00405-017-4840-0. [DOI] [PubMed] [Google Scholar]
- 24.Aron-Wisnewsky J, Minville C, Tordjman J, Levy P, Bouillot JL, Basdevant A, et al. Chronic intermittent hypoxia is a major trigger for non-alcoholic fatty liver disease in morbid obese. J Hepatol 2012; 56:225–233. doi: 10.1016/j.jhep.2011.04.022. [DOI] [PubMed] [Google Scholar]
- 25.Trzepizur W, Boursier J, Le Vaillant M, Ducluzeau PH, Dubois S, Henni S, et al. Increased liver stiffness in patients with severe sleep apnoea and metabolic comorbidities. Eur Respir J 2018; 51:1800601.doi: 10.1183/13993003.00601-2018. [DOI] [PubMed] [Google Scholar]
- 26.Guiu B, Crevisy-Girod E, Binquet C, Duvillard L, Masson D, Lepage C, et al. Prediction for steatosis in type-2 diabetes: clinico-biological markers versus 1H-MR spectroscopy. Eur Radiol 2012; 22:855–863. doi: 10.1007/s00330-011-2326-9. [DOI] [PubMed] [Google Scholar]
- 27.Chen X, Lin X, Chen LD, Lin QC, Chen GP, Yu YH, et al. Obstructive sleep apnea is associated with fatty liver index, the index of nonalcoholic fatty liver disease. Eur J Gastroenterol Hepatol 2016; 28:650–655. doi: 10.1097/MEG.0000000000000598. [DOI] [PubMed] [Google Scholar]
- 28.Barre T, Protopopescu C, Bani-Sadr F, Piroth L, Rojas Rojas T, Salmon-Ceron D, et al. Elevated fatty liver index as a risk factor for all-cause mortality in HIV-HCV co-infected patients (ANRS CO13 HEPAVIH cohort study). Hepatology 2019; doi: 10.1002/hep.30914. [DOI] [PubMed] [Google Scholar]
- 29.Olubamwo OO, Virtanen JK, Voutilainen A, Kauhanen J, Pihlajamaki J, Tuomainen TP. Association of fatty liver index with the risk of incident cardiovascular disease and acute myocardial infarction. Eur J Gastroenterol Hepatol 2018; 30:1047–1054. doi: 10.1097/MEG.0000000000001183. [DOI] [PubMed] [Google Scholar]
- 30.Dasarathy S, Dasarathy J, Khiyami A, Joseph R, Lopez R, McCullough AJ. Validity of real time ultrasound in the diagnosis of hepatic steatosis: a prospective study. J Hepatol 2009; 51:1061–1067. doi: 10.1016/j.jhep.2009.09.001. [DOI] [PMC free article] [PubMed] [Google Scholar]
- 31.Hernaez R, Lazo M, Bonekamp S, Kamel I, Brancati FL, Guallar E, et al. Diagnostic accuracy and reliability of ultrasonography for the detection of fatty liver: a meta-analysis. Hepatology 2011; 54:1082–1090. doi: 10.1002/hep.24452. [DOI] [PMC free article] [PubMed] [Google Scholar]