Abstract
Upon severe or chronic liver injury, adult ductal cells (cholangiocytes) contribute to regeneration by restoring both hepatocytes and cholangiocytes. Recently, we showed that ductal cells clonally expand as self-renewing liver organoids that retain their differentiation capacity into both hepatocytes and ductal cells. However, the molecular mechanisms by which adult ductal-committed cells acquire cellular plasticity, initiate organoids and regenerate the damaged tissue remain largely unknown.
Here, we describe that, during organoid initiation and in vivo following tissue damage, ductal cells undergo a transient, genome-wide, remodelling of their transcriptome and epigenome. TET1-mediated hydroxymethylation licences differentiated ductal cells to initiate organoids and activate the regenerative programme through the transcriptional regulation of stem-cell genes and regenerative pathways including the YAP/Hippo.
Our results argue in favour of the remodelling of genomic methylome/hydroxymethylome landscapes as a general mechanism by which differentiated cells exit a committed state in response to tissue damage.
The adult liver exhibits low physiological turnover, however it has an efficient regenerative ability following damage. Upon tissue injury, if hepatocyte proliferation is compromised, resident, lineage-restricted ductal cells (cholangiocytes) acquire cellular plasticity to regenerate both, cholangiocytes and hepatocytes1–9. Similarly, in vitro, ductal cells grown as clonal organoids become bi-potential, express stem/progenitor markers, including Lgr54,10,11, Foxl17 and Trop212, and differentiate into both ductal and hepatocyte-like cells in vitro and mature hepatocytes in vivo, upon transplantation4,13,14. However, the molecular mechanisms by which adult committed cells exit their lineage-restricted state, initiate proliferating organoids and respond to damage by generating both ductal cells and hepatocytes remain largely unknown.
During development, epigenetic mechanisms are imposed to ensure that differentiated cells remain lineage-restricted15. In mammals, 5-methylcytosine (5mC) is the most common DNA modification and is associated to gene repression at promoter and enhancer level16–20. DNA demethylation might occur passively, due to loss of DNA methylation maintenance during replication or via the conversion of 5mC to 5hmC by the Ten-eleven translocation (TET) family of methylcytosine dioxygenase enzymes21,22, which results in dilution of 5hmC through DNA replication23. Moreover, cytosine demethylation can be achieved by a replication-independent mechanism mediated by TETs, whereby 5mC is converted to 5hmC, which can be further oxidized and replaced with an unmodified cytosine24,25.
Erasure of 5mC and TET1 activity are essential for resetting the genome for pluripotency, germ-cell specification, imprinting and somatic cell reprogramming26–30. During development and postnatal life, Tet1 is essential to maintain the intestinal stem cell pool31, while Tet2 and Tet3 are required to induce postnatal demethylation in hepatocytes32. However, whether epigenetic mechanisms and/or DNA-methylation/hydroxymethylation play a role in the acquisition of cellular plasticity in adult differentiated cells during the regenerative response has not been investigated yet.
Here, we report that in the liver, during the response to tissue damage, adult resident ductal cells undergo a genome-wide remodelling of their transcriptional and methylome/hydroxymethylome landscapes in the absence of ectopic genetic manipulation. We identify TET1-mediated hydroxymethylation and its downstream regulation of ErbB/MAPK and YAP/Hippo signalling pathways as one of the epigenetic mechanisms required for lineage-restricted ductal cells to acquire cellular plasticity, establish liver organoids and elicit a full regenerative response.
Results
Adult non-proliferative ductal cells undergo genome-wide changes in their transcriptional landscape during organoid initiation and as a response to tissue damage
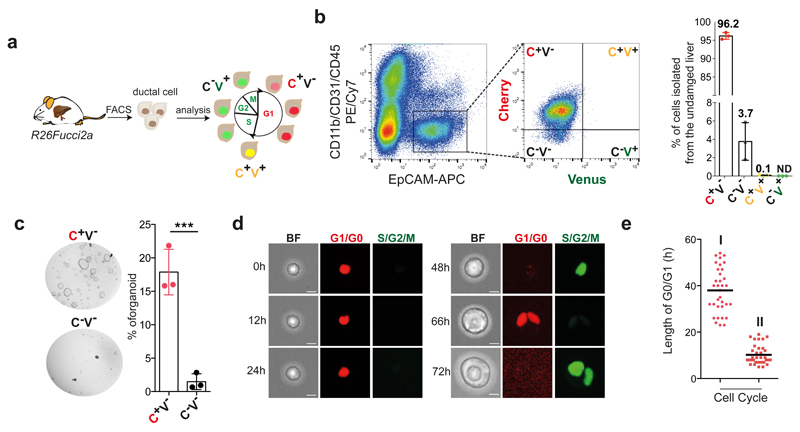
We recently reported a liver organoid culture system that allows the clonal and long-term expansion of mouse4 and human13 liver ductal cells as self-renewing bi-potent organoids capable of differentiating into ductal and hepatocyte-like cells in vitro and in vivo4,13,14,33,34. Using the pan-ductal marker EpCAM after excluding hematopoietic and endothelial cells (see methods) we isolated pure populations of ductal cells capable of generating organoid cultures from undamaged liver with ~15% efficiency (Extended Data Figure 1a). To confirm that organoid formation is not due to a subpopulation of proliferating ductal cells, we isolated EpCAM+ cells from R26Fucci2a mice35 and tracked their cell cycle dynamics. As reported36, we found that virtually all EpCAM+ ductal cells are arrested in G1/G0 (mCherry+/mVenus-/EpCAM+) (Figure 1a-b and Extended Data Figure 1b), indicating that the organoid initiating cells are non-proliferative (Figure 1c). To investigate the molecular basis that endows adult committed ductal cells to initiate bi-potent organoids, we first estimated the time required for the cells to enter the S/G2/M phase. We found that first entry into S-phase takes ~40h from isolation, while subsequent G1 phases shortened to ~15h (Figure 1d-e, Extended Data Figure 1c and Movie 1).
Fig. 1. G1/G0 arrested liver ductal cells require ~48h to start cell proliferation and initiate liver organoids cultures.
R26Fucci2a mice constitutively express a bi-cistronic cell-cycle reporter that allows discriminating between G1/G0 [Cherry-hCdt1+ (30/120), red] and S/G2/M [Venus-hGem+, (1/110) green] phases of the cell cycle. a, Experimental approach b, EpCAM+ liver ductal cells from R26Fucci2a mice were FACS-sorted according to the expression of mCherry-hCdt1 (C) and/or mVenus-hGem (V). The graph represents percentage of EpCAM+ cells positive for mCherry and/or mVenus. Each dot represents an independent experiment from an independent mouse (n=3). Graph is presented as mean±SD of 3 independent experiments. c, Representative bright field images of 500 C+/V- EpCAM+ and C-/V- EpCAM+ cells cultured for 6 days as liver organoids. The graph represents mean±SD of organoid formation efficiency (n=3 experiments). **, p-value (p=0.001413095) was calculated using Student's two tailed t-test. **, p<0.01. d, Still images from a representative movie of C+/V- EpCAM+ ductal cells monitored for 72h using a spinning-disk confocal microscope. Scale bars, 10μm. e, Graph represents G0/G1 length for the first (I) and second (II) cell cycles since t=0h (isolation) of 34 cells (n=3 independent experiments). Global mean of G0/G1 length is shown (G0O/G1 I = 37.97h hours; G0O/G1 II = 10.20h hours). h, hours.
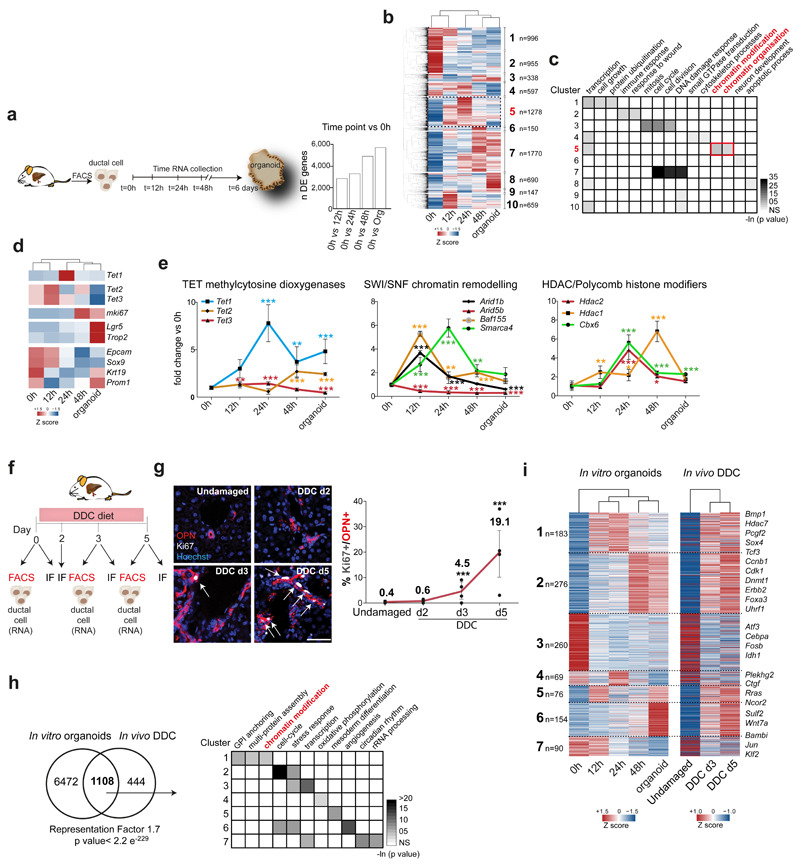
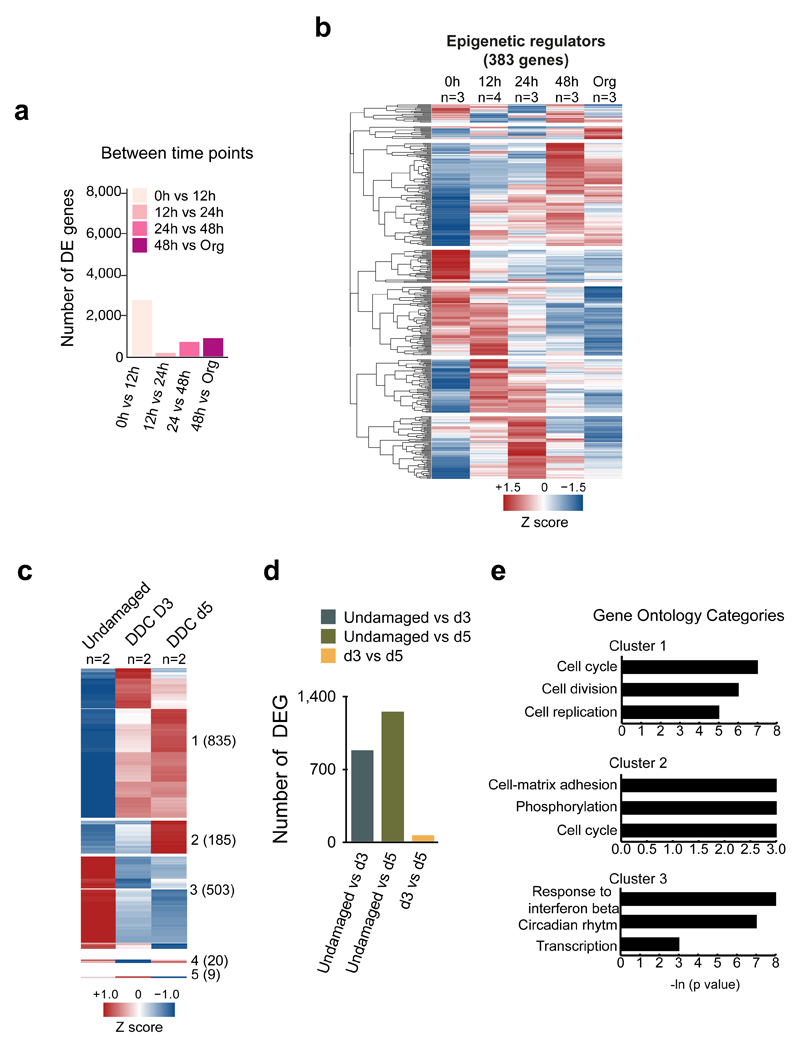
Next, we performed genome-wide gene expression analysis (RNA-sequencing) in cells isolated directly from the undamaged tissue (0h), cells collected prior to entry in S-phase (12h and 24h) and after proliferation initiation (48h and organoid stage, 6 days). We found that adult differentiated ductal cells undergo profound transcriptional changes during the initiation and formation of organoid cultures. We identified >3,000 genes differentially expressed (DE) during the first 24h, prior to S-phase, while 900 genes changed after proliferation started (48h vs organoids) indicating that most of the organoid transcriptional signature is established within 48h in culture (Figure 2a-b, Extended Data Figure 2a and Supplementary Dataset 1).
Fig. 2. Liver ductal cells undergo genome-wide changes in their transcriptional landscape during organoid initiation and in vivo upon damage.
a-e, Expression analysis of ductal cells during organoid initiation. a, Experimental Scheme. Graph represents DE genes (pairwise approach with Wald test performed using Sleuth. Threshold FDR <0.1) b, Hierarchical clustering of all 7580 DE genes. Heatmap represents averaged TPM values of biological replicates (0h n=3; 12h n=4; 24h n=3; 48h n=3; organoid n=3) scaled per gene (Z-score). Number in bold, cluster. n, number of genes/cluster. c, GO and statistical analyses were performed using DAVID 6.8. Red, cluster containing DE genes at 12h and 24h. d, Heatmaps representing averaged Z-score of indicated genes. e, Graphs represent mean±SD of n=6 independent RT-qPCR experiments. Independent experimental data are listed in Source Data. Data are presented as fold-change compared to t=0h. p-value is calculated using two-way ANOVA combined with Tukey HSD test. p-value of comparisons vs t=0 are shown. **, p<0.01; ***, p<0.001. Exact p-values are provided in Source Data. f-i, Expression analysis of ductal cells following liver damage by supplementing the diet with 0.1% DDC (see methods). f, Experimental scheme. g, Immunofluorescence analysis of ductal cell proliferation upon damage. Representative images are shown (n=3 experiments). Scale bar, 50μm. Graph represents mean±SD of proliferating ductal cells (undamaged n=3, DDC d2 n=3, d3 n=4, d5 n=4). p-values were calculated vs undamaged using pairwise comparisons with Wilcoxon rank sum test (DDC d3 p= 0.01201; DDC d5 p= 7.6E-05). *, p<0.05; ***, p<0.001. h, RNA sequencing analysis of sorted EpCAM+ ductal cells isolated from undamaged or DDC-treated livers (day 3 and 5, n=2 per time point). Venn diagram, overlap between DE genes in vitro and in vivo. p-value is calculated using normal approximation of the hypergeometric probability. Table indicates the GO analysis (top 3 significant categories) of the 7 clusters identified in i and their p-values obtained with DAVID 6.8. i, Heatmap (averaged Z score) of the hierarchical clustering of the 1108 DE genes based on the in vitro expression profile. Number in bold, cluster. n, number of genes/cluster.
We classified the differentially expressed genes into 10 clusters. Genes in cluster 3 and 7 (increased expression from 48h-onwards), were mainly enriched in cell-cycle, while genes in cluster 5, whose expression precedes the onset of proliferation (starts at 12h and peaks at 24h), were significantly enriched for chromatin regulators (Figure 2b-c). Of note, 55% (383 out of 698) of the genes from an epigenetic modifiers’ list37 were differentially expressed, including Polycomb, SWI/SNF members and TETs, while some ductal markers were transiently down-regulated (Figure 2d-e and Extended Data Figure 2b). These results suggested that epigenetic mechanisms might be prominently involved in the initiation of liver organoids from non-proliferative, lineage-restricted ductal cells.
Organoids mimic many aspects of the tissue-of-origin in a dish38, however, they have not been used to study the molecular mechanisms of tissue regeneration. Therefore, we opted to benchmark our organoid cultures to the in vivo response to tissue damage by studying the transcriptional changes that occur in vivo after injury and compare these to our organoid findings. For that, we induced liver damage to adult mice by administering a 0.1% 3,5-diethoxycarbonyl-1,4-dihydrocollidine (DDC) supplemented diet (Figure 2f). Proliferation initiation began at day 3 (d3) and peaked at day 5 (d5) of damage (Figure 2g). Interestingly, also in vivo, ductal cells undergo significant genome-wide changes of their transcriptional landscape, with >1,500 genes differentially expressed between the undamaged and any of the two damage time points (Supplementary Dataset 1 and Extended Data Figure 2c-e). Notably, most of the transcriptional changes occur at d3, before the significant increase of proliferation, resembling our in vitro observations.
Interestingly, 71.4% of the DE genes in vivo were also found as DE genes in vitro (1,108 out of 1,552 genes) and presented similar expression patterns. Specifically, epigenetic regulators such as Tet1, Hdac7, Uhrf1 or Dnmt1, hepatoblast markers (Foxa3, Sox4) or ductal markers presented similar patterns (Figure 2h-i and Extended Data Figure 3a).
Altogether, these results reveal that both, in vivo and in vitro, ductal cells undergo a global rewiring of their transcriptional landscape as a response to tissue damage, and validate organoids as a model to study some molecular mechanistic aspects of tissue regeneration.
TET1 catalytic activity is required for organoid initiation and expansion
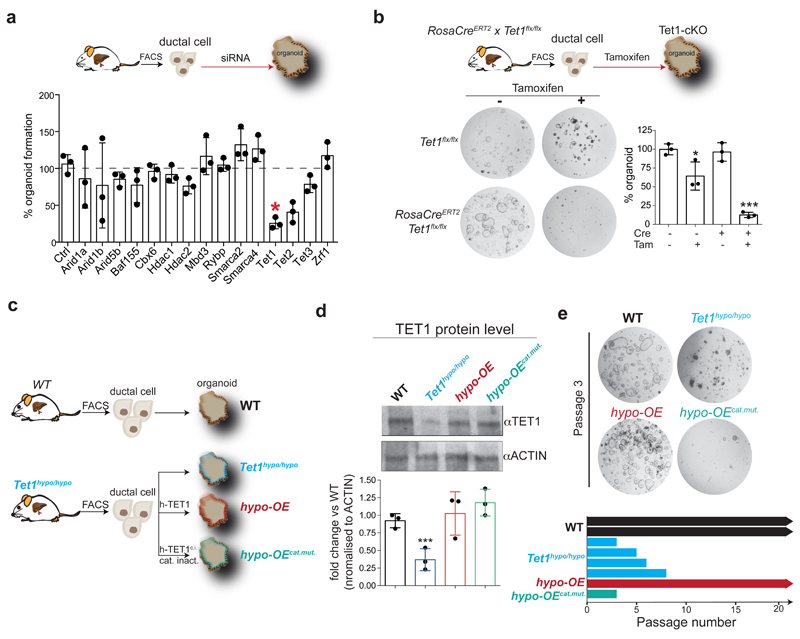
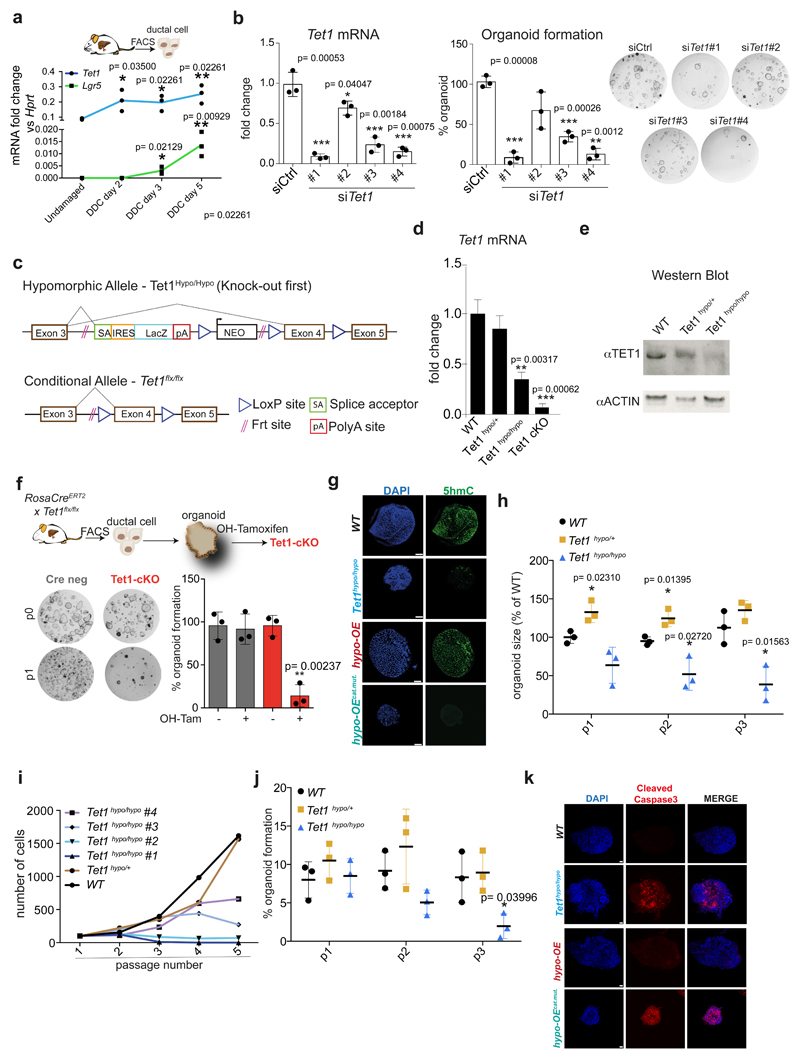
To identify potential epigenetic regulators required for the activation of ductal cells during organoid initiation, we selected some of the DE epigenetic modifiers during the first 24h and assessed the effect of their loss-of-function (siRNA knock-down) on organoid initiation. We found that depletion of Tet1 significantly impaired organoid formation, while Tet2 knock-down exhibited a reduction, but was not statistically significant (Figure 3a and Extended Data Figure 3b).
Fig. 3. TET1 catalytic activity is required for liver organoid initiation and maintenance.
a, FACS-sorted EpCAM+ ductal cells freshly isolated from WT undamaged livers were transfected with a pool of siRNAs, each of them targeting specifically a selected epigenetic modifier, and organoid formation efficiency was evaluated 10 days later. Results are shown as percentage of organoid formation efficiency compared to mock transfected cells. The graph represents mean±SD of n=3 independent experiments (dots). p-values were calculated using one-way ANOVA in conjunction with Tukey’s HSD test by comparison to siCtrl. *, p= 0.01031057 siTet1 vs siCtrl,. b, FACS-sorted EpCAM+ ductal cells derived from RosaCreERT2 x Tet1flx/flx mouse livers were plated in organoid isolation medium supplemented with 5μM hydroxytamoxifen or vehicle and organoid formation efficiency was evaluated 6 days later. Representative bright field images are shown. Data are reported as percentage of organoid formation compared to Cre-Tam- cells. Graphs represent mean±SD of n=3 independent experiments. p-value was calculated using Student's two-tailed t-test vs Cre-Tam- (*, Cre-Tam+ p=0.03781815; ***, Cre+Tam+ p=4.812E-05). c-e, EpCAM+ ductal cells isolated from Tet1 hypomorphic mice were used to generate liver organoids (Tet1hypo/hypo, blue) or were transfected with a hTET1 full length cDNA (hypo-OE organoids, red) or catalytically inactive hTET1 H1671Y/D1673A (hypo-OEcat.mut. organoids, turquoise). Organoids derived from WT littermates were used as controls (black). c, Scheme indicates the lines generated. d, Western blot analysis of TET1 protein levels. The graph represents TET1 levels. Complete blot is shown in data source. Results are presented as mean±SD of n=3 independent experiments (dot). **, p-value calculated using Student's two-tailed t-test vs WT (Tet1hypo/hypo p=0.006779543). e, Representative bright field images of WT (n=2), Tet1hypo/hypo(n=4) hypo-OE (n=1) and hypo-OEcat.mut. (n=1) organoid lines at passage 3. Graph indicates passage number.
Thus, we further investigated the role of TET1 in organoid initiation and expansion. For that, we generated 2 independent TET1 mutant alleles: (1) a conditional allele (Tet1flx/flx) enabling the spatiotemporal control of TET1 deletion and (2) a hypomorphic allele (Tet1hypo) which displays ~35% of Tet1 mRNA and protein levels (Tet1hypo/hypo) compared to WT littermates (Extended Data Figure 3c-e and Supplementary Table 1).
We found that ablation of TET1 in FACS-sorted ductal cells derived from RosaCreERT2/Tet1flx/flx abrogated organoid formation (Figure 3b), in agreement with the siRNA results (see Figure 3a and Extended Data Figure 3b). In addition, TET1 depletion in established organoids impaired their expansion (Extended Data Figure 3f). Organoids generated from the Tet1 hypomorphic mutant mice (Tet1hypo/hypo) exhibited reduced 5hmC levels and expansion defects, despite that they could be established (Figure 3c-e and Extended Data Figure 3g-k). Organoids derived from heterozygous or WT littermates displayed no growth defects (Extended Data Figure 3h-k). Importantly, ectopic expression of full-length TET1 cDNA (hypo-OE organoids), but not a catalytically inactive mutant (TET1H1671Y/D1673A)29,39 (hypo-OEcat.mut. organoids), rescued all these phenotypes (Figure 3c-e and Extended Data Figure 3g/k). Altogether, these results demonstrated that the catalytic activity of TET1 is required to initiate and propagate liver organoids from lineage-restricted, non-proliferative, ductal cells.
Genome-wide changes in DNA methylation/hydroxymethylation occur during the activation of ductal cells following damage
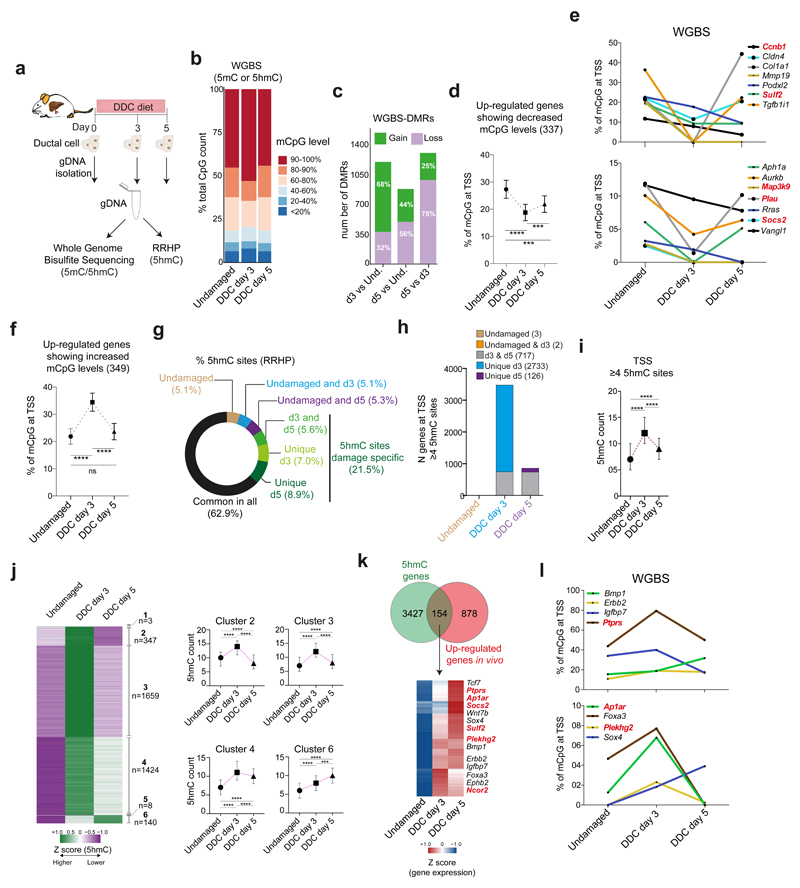
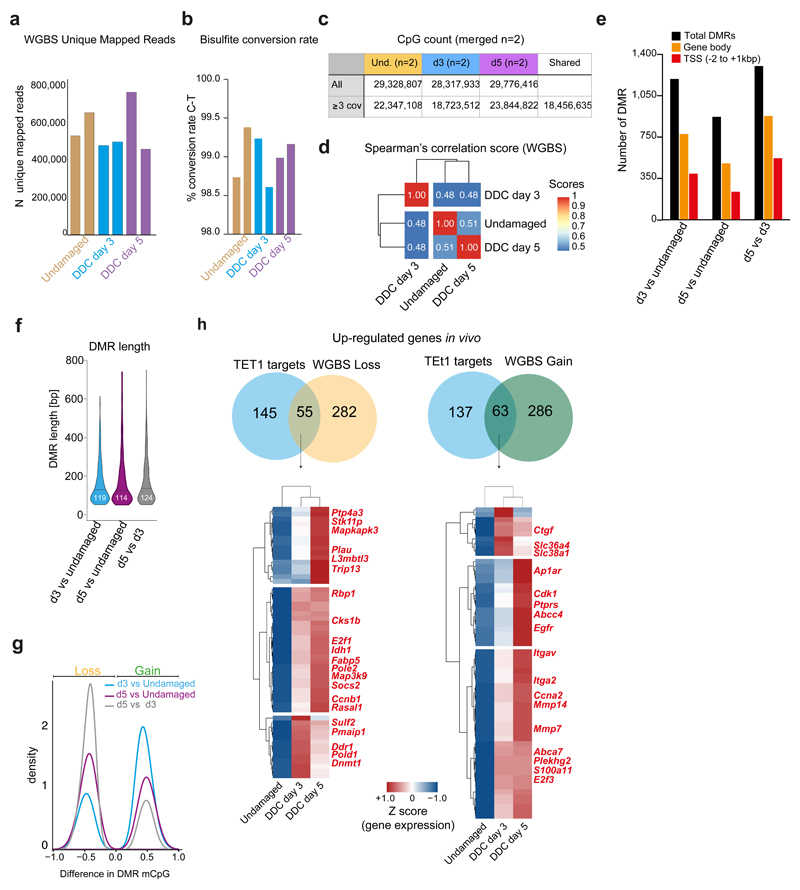
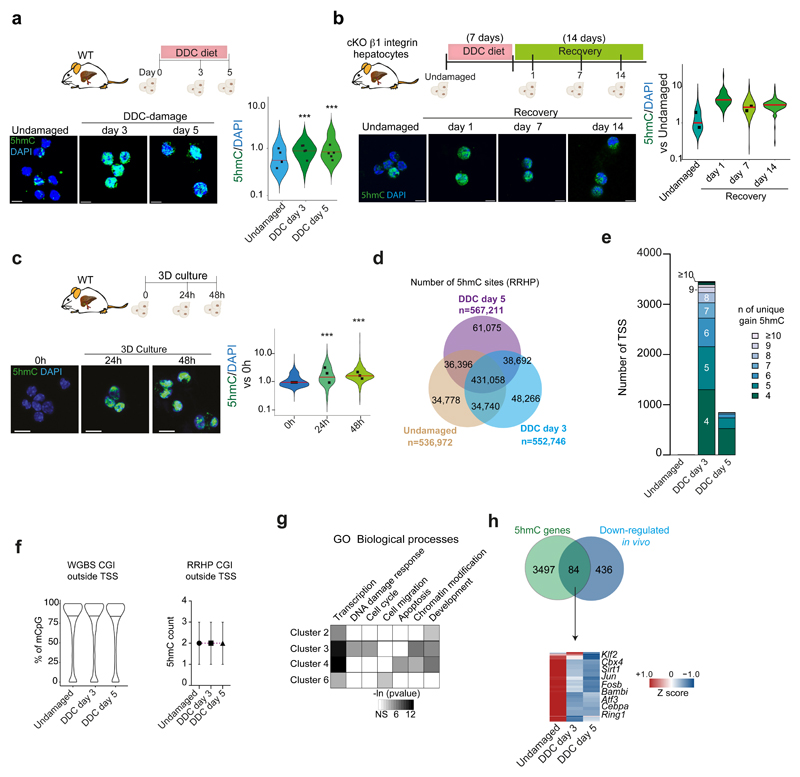
Given the crucial role of TET1-mediated hydroxymethylation in organoid initiation, we speculated that epigenetic regulation of DNA methylation and hydroxymethylation levels could be involved in the ductal regenerative response to damage in vivo. For that, we quantified the levels of DNA methylation at single base resolution by Whole Genome Bisulfite Sequencing (WGBS) in genomic DNA extracted from EpCAM+ ductal cells sorted from undamaged and d3 and d5 DDC-damaged livers (Figure 4a, Extended Data Figure 4a-c, Supplementary Dataset 2). WGBS revealed a global increase in cytosine modification (5mC and/or 5hmC) at d3 after damage, while d5 and undamaged controls showed similar global levels (Figure 4b) although modifications occurred in the same CpG only in ~50% of the cases across the time points analysed (Extended Data Figure 4d). Next, we identified the differential levels of cytosine modification in defined regions in a CpG context (DMRs) (Extended Data Figure 4e-f). At d3, the majority of DMRs represented a gain of modified cytosine (mCpG) compared to undamaged (68%) whereas at d5 and between both damage time points, these were mainly associated with a loss in mCpG (56%, and 75%, respectively) (Figure 4c and Extended Data Figure 4g). We then analysed the levels of mCpG at the TSS (+/- 500bp) of genes transcriptionally up-regulated after damage. From all up-regulated genes, 32.6% (337 out of 1032) showed decreased methylation/hydroxymethylation levels at d3 (Figure 4d-e and Extended Data Figure 4h), suggestive of a potential role of demethylation in their transcriptional activation.
Fig. 4. Liver ductal cells undergo global remodelling of DNA methylation and hydroxymethylation landscapes in vivo upon damage.
a-l, gDNA from undamaged or DDC-damaged livers was split in two fractions and prepared for WGBS (a-f) or RRHP (g-l) (n=2 mice per time point). a, Experimental design. b, Graph shows the percentage of modified CpG (mCpG) sites according to different level categories (average of replicates). c, Number of differentially methylated/hydroxymethylated regions (DMRs) present in the n=2 biological replicates. DMR were called based on a modification difference ≥25%, p<0.05 (see methods). d-e, Graphs (mean±95%CI) represent percentage of modified cytosines at TSS for all 337 up-regulated genes (d) or selected ones (e) showing decreased mCpG levels at d3 (average of replicates). p-value was obtained by Kruskal Wallis test with Dunns multiple comparison. ****, undamaged vs d3 p<0.0001, ***, undamaged vs d5 p=0.0003, d3 vs d5 p=0.0004. TET1 targets (see Figure 5) are represented in bold red. f, Graph represents all 349 up-regulated genes after damage presenting increased mCpG level at TSS (mean ±95% CI). p-value was obtained by Kruskal Wallis test with Dunns multiple comparison. ****, undamaged vs d3 p<0.0001, undamaged vs d5 p=0.3773, d3 vs d5 p<0.0001. g, Distribution of total 5hmC sites identified. h, Number of genes showing ≥4 5hmC sites around their TSS. i, Graph represents median±IQR of 5hmC counts from the 3581 genes differentially hydroxymethylated. p-value was obtained using Kruskal Wallis test coupled with Dunn’s multiple comparison. All p-values are <0.0001. ****, p<0.0001 j, The heatmap represents the z-score values of 5hmC absolute count. 5hmC levels were classified into 6 clusters. n, number of genes/cluster. Graphs (median±IQR) represent the number of 5hmC counts of differentially hydroxymethylated genes. p-value was obtained by Kruskal Wallis test with Dunns multiple comparison. All p-values correspond to p<0.0001 (****), except for ***, p=0.0009. k, Heatmap represents Z-score of the 154 overlapping genes. l, Graph represents the levels of mCpG from the 154 genes identified in k averaged for the 2 biological replicates. In k-l, TET1 targets (see Figure 5) are represented in bold red.
Of note, we also found that a significant proportion of all up-regulated genes (34%, 349 genes out of 1032) presented increased levels of mCpG (Figure 4f and Extended Data Figure 4h). Since WGBS cannot discriminate between 5mC and 5hmC, we hypothesized that this could be explained by an increased 5hmC. Hence, we performed Reduced Representation of Hydroxymethylation Profiles (RRHP), to identify 5hmC at single base resolution in the same DNA samples used for the WGBS (see Figure 4a and Supplementary Dataset 2). Consistent to 5hmC immunofluorescence stainings on ductal cells upon in vivo damage in WT mice or upon β1 integrin deletion (a damage model of duct-mediated hepatocyte regeneration9) and during organoid initiation (Extended Data Figure 5a-c), RRHP showed increased 5hmC sites upon damage (Figure 4g and Extended Data Figure 5d). To identify 5hmC regulated targets, we analysed 3,581 genes showing differential hydroxymethylation levels i.e., presenting ≥4 unique 5hmC sites at their TSS, either in undamaged or after damage. Of note, >95% of these genes (3,450 genes) had acquired de novo 5hmC sites at d3, prior to proliferation, while most of these de novo marks were lost at d5, suggestive of a significant transient reshaping of the hydroxymethylome as a response to damage and prior to cell proliferation (Figure 4h-j and Extended Data Figure 5e). Notably, 5hmC levels did not increase in CpG islands (CGI) outside TSS (Extended Data Figure 5f).
The differentially hydroxymethylated genes could be classified in six clusters (1-6), with clusters 2-4 presenting increased 5hmC at day 3 and reduced levels at day 5 and cluster 6 (140 genes) showing overall increased 5hmC levels at day 5 (Figure 4j and Extended Data Figure 5g). When overlapping genes with increased 5hmC with genes differentially expressed in vivo we found 154 genes transcriptionally up-regulated (Figure 4k and Supplementary Dataset 1). Interestingly, some of these also presented increased cytosine modifications in the WGBS at d3, prior to proliferation, hence explaining, at least in part, the observed dichotomy between the increased levels of modified cytosine in the WGBS and the increase in transcription. Among these, we found genes involved in liver regeneration signalling pathways (e.g. Erbb2)40 and liver development (Foxa3, Sox4)41 (Figure 4l). In addition, 84 genes showing differential 5hmC levels were also down-regulated in vivo, including negative regulators of the BMP pathway (Bambi) and genes important for hepatocyte differentiation (Cebpa and Atf3) (Extended Data Figure 5h and Supplementary Dataset 1).
Altogether, our genome-wide analyses suggest that transient increase in hydroxymethylation levels might facilitate the acquisition of cellular plasticity in ductal cells and subsequent initiation of the response to damage.
TET1 induces ductal cell plasticity through the regulation of the YAP/Hippo and ErbB/MAPK signalling pathways
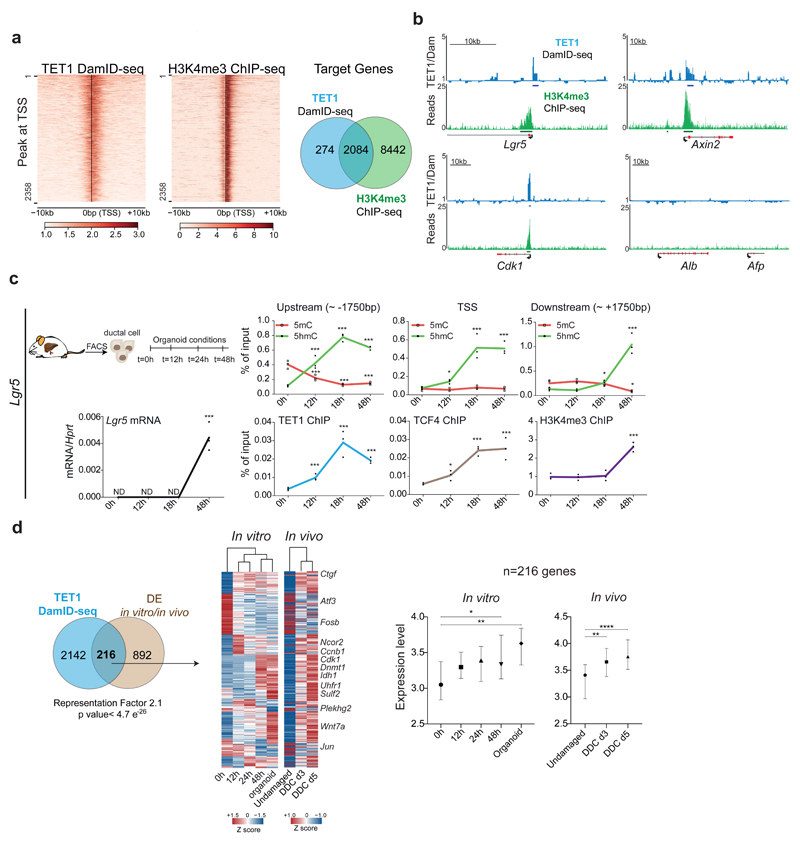
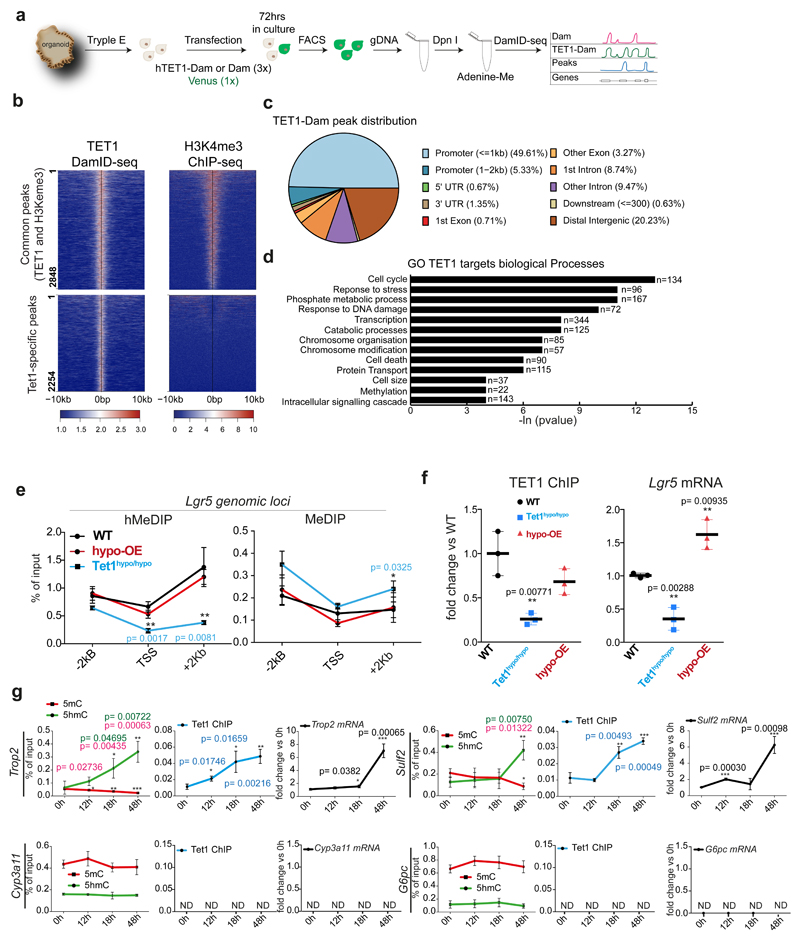
Our findings indicate that hydroxymethylation levels rise upon damage in genes/pathways relevant for liver regeneration, at the time where Tet1 expression is increased, and before the onset of proliferation. Therefore, we next sought to elucidate TET1-regulated genes involved in the acquisition of cellular plasticity during liver regeneration. Hence, we investigated TET1 genomic occupancy by performing Targeted DamID-seq (DNA Adenine Methyltransferase IDentification sequencing)42,43 (Extended Data Figure 6a). We found 5,102 TET1 specific peaks, 56% of which were in actively transcribed regions (Extended Data Figure 6b-c and Supplementary Dataset 3). We next identified TET1 targets by overlapping the peaks to a +/-2Kb region around the TSS. We found 2,358 TET1 target genes in liver organoids, 88% of which shared an H3K4me3 peak, indicating that TET1 binding at TSS occurs mostly in transcriptionally active genes (Figure 5a). These were involved in cell-cycle, transcription and chromatin organisation, among others (Extended Data Figure 6d).
Fig. 5. TET1 regulates the activation of genes involved in organoid formation and liver regeneration.
a-b, TET1-DamID analyses were performed in n=3 independent experiments. a, Heatmaps of TET1-DamID (left) and H3K4me3 (right) binding at the TSS Venn diagram indicates the overlap between the DamID-seq TET1 and H3K4me3 target genes identified by ChIP-seq. b, Genome tracks of TET1 (Dam-ID) and H3K4me3 (ChIP) peaks on selected genes. Graphs show TET1-Dam/Dam only ratio (blue) and H3K4me3 number of reads (green). c, Sorted EpCAM+ cells from WT undamaged livers were cultured as organoids and analysed at the indicated time points (n=3 experiments). Upper panels: hMeDIP (dots, green) and MeDIP (squares, red) levels in the indicated genomic region upstream and downstream of the Lgr5 TSS. Lower panels: TET1 (blue), TCF4 (brown) and H3K4me3 (purple) ChIP-qPCR at the TSS. mRNA expression is shown in black. p-value was obtained using Student's two-tailed t-test. Statistical analyses were performed vs t=0h. (Upstream 5hmC 12h p=0.004305136, 18h, p=3.26345E-05, 48h p=8.36527E-06; 5mC 12h p=0.009532377, 18h, p=0.001130234, 48h p=0.001564496; TSS 5hmC 12h p=0.011044339, 18h, p=0.005230947, 48h p=0.000485153; Downstream 5hmC 18h, p=0.004305136, 48h p=3.26345E-05; 5mC 48h p=8.36527E-06; Lgr5 mRNA 48h p=0.001991489; TET1 ChIP 12h p=0.005403182, 18h, p=0.003789515, 48h p=0.000119801; H3K4me3 ChIP 48h p= 0.000774002). *, p<0.05; **, p <0.01***; p <0.001. d, Overlap between the 1108 DE genes identified in Fig. 2h-i and TET1 targets identified by DamID-seq. p-value of the overlap is calculated using normal approximation of the hypergeometric probability. The heatmap (TPM, z-scored) presents the expression profile of the 216 TET1 targets DE in vivo and in vitro. Graphs show the gene expression levels of 216 genes (median±95% CI) as ln(TPM +1). p-values are obtained with one-way ANOVA followed by Tukey’s multiple comparisons test. 0h vs 48h p=0.0379, 0h vs Org p=0.0039; Und vs d3 p=0.0013, Und vs d5 p<0.0001.*, p< 0.05; **, p <0.01; ***, p <0.001.
Notably, we identified TET1 binding on stem-cell genes such as Lgr510, Axin244,45 and Lrig146, the known TET1-target Cdk147, epigenetic regulators (Cbx3, Ezh2, Dnmt1, Hdac1) and liver development transcription factors (Onecut1 and Onecut2) (Figure 5b and Supplementary dataset 3). TET1 and 5hmC levels were increased before transcription of the stem-cell genes Lgr5, Trop2 and Sulf2, while both, Lgr5 mRNA and 5hmC were reduced in organoids with low levels of TET1 (TET1hypo/hypo) and could be rescued by ectopic expression of TET1 (Figure 5c and Extended Data Figure 6e-g). TET1-dependent 5hmC might co-operate with the existing transcriptional regulatory machinery, as the recruitment of TET1 to Lgr5, a TCF4 target48, paralleled the binding of TCF4/Tcf7l2 to the locus (Figure 5c). As expected, no TET1 binding or changes in 5mC/5hmC were detected in genes not expressed, including the hepatoblast marker Afp and hepatocyte marker Alb (Figure 5b and Extended Data Figure 6g). Of note, some TET1 targets were also up-regulated in vivo (see Figure 4, Extended Data Figure 4h and Supplementary Dataset 4). The overlap between TET1 targets and DE genes in vivo and in vitro (see Figure 2h) suggests that TET1 mainly functions as a transcriptional activator in liver ductal cells (Figure 5d and Supplementary Dataset 1).
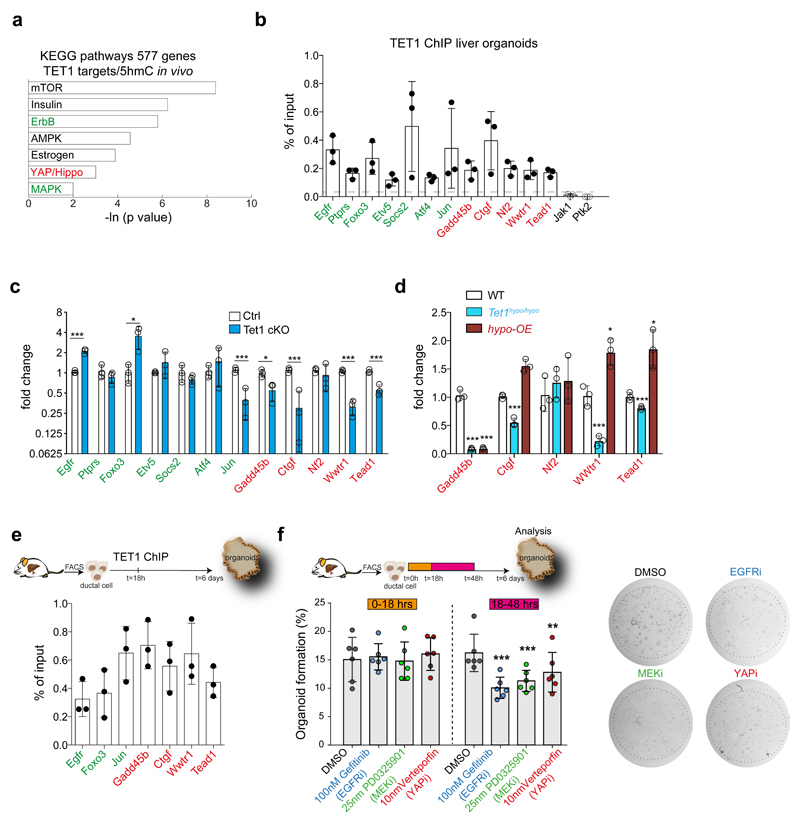
To further elucidate the mechanism by which TET1-mediated hydroxymethylation regulate organoid formation and liver regeneration we performed KEGG pathway enrichment analysis on TET1 targets that were also differentially hydroxymethylated upon damage in vivo. This revealed a significant enrichment on several components/targets of signalling pathways including mTOR, ErbB, MAPK and YAP/Hippo, among others (Figure 6a, Supplementary Dataset 2).
Fig. 6. Tet1 regulates YAP/Hippo and ErbB, MAPK signalling pathways.
a, KEGG pathway enrichment and statistical analyses on the genes identified as TET1-DamID targets in liver organoids (n=3) and showing differential levels of 5hmC in vivo from RRHP using DAVID 6.8. b, TET1 ChIP-qPCRs in liver organoids. Data are reported as percentage of input. Graph represents mean ±SD of n=3 independent experiments. c, mRNA expression levels of selected TET1 targets in WT or RosaCreERT2 x Tet1flx/flx organoids both treated with 5μM tamoxifen for 24hrs. Cells were harvested 24hrs after tamoxifen treatment. Data are reported as fold change compared to Ctrl. Graph represents mean±SD of n=3 independent experiments. p-value obtained using Student's two tailed t-test upon comparison to Ctrl. Egfr, p= 0.000479886; Foxo3, p= 0.031392276; Jun, p= 0.004319905; Gadd45b, p= 0.023554286; Ctgf, p= 0.005333732; Wwtr1, p= 0.000230442; Tead1, p= 0.002322422. *, p<0.05; **, p<0.01; ***, p<0.001. d, mRNA expression levels of YAP/Hippo TET1 targets in TET1hypo/hypo organoids and TET1hypo-OE organoids. Graph represents mean±SD of n=3 independent experiments. p-value obtained using Student's two tailed t-test upon comparison to WT. Gadd45b, TET1hypo/hypo p= 6.00424E-05; TET1hypo-OE p= 6.24089E-05. Ctgf, Tet1hypo/hypo p= 0.000677729; TET1hypo-OE p= 0.001247481. Wwtr1, TET1hypo/hypo p= 0.002222631; TET1hypo-OE p= 0.010861863. Tead1, TET1hypo/hypo p= 0.009343297; TET1hypo-OE p= 0.013645094. *, p<0.05; **, p<0.01; ***, p<0.001 e, TET1 ChIP-qPCRs in EpCAM+ FACS-sorted cells grown in organoid conditions for 18hrs. Data are reported as percentage of input. Graph represents mean ±SD of n=3 independent experiments. f, EpCAM+ ductal cells freshly isolated from undamaged livers were treated at 0-18hrs or 18-48hrs with the small molecule inhibitors as indicated. Organoid formation was quantified at day 6. Graph represents organoid formation efficiency and indicates mean ±SD of n=6 independent experiments. Statistical analyses were performed with two-ways ANOVA with Bonferroni’s multiple compared test vs DMSO control group. 18-48hrs Gefitinib, p<0.0001; PD0325901 p<0.0001; Verteporfin, p=0.0039. **, p<0.01; ***, p<0.001. Representative pictures of organoids are shown.
Interestingly, mTOR, ErbB, MAPK and YAP/Hippo have been extensively described to be essential for liver regeneration in vivo40,49–53. Additionally, YAP/Hippo and mTOR have been recently identified as required for intestinal54 and liver50 organoid expansion. Therefore, we hypothesized that the direct regulation of these pro-regenerative pathways could explain the mechanism by which TET1 facilitates the acquisition of cellular plasticity in liver ductal cells upon tissue injury or during organoid initiation. We first validated TET1 occupancy by ChIP-qPCR on selected TET1 targets [ErbB and MAPK (Egfr, Foxo3, Socsc2, Jun) and YAP/Hippo (Wwtr1/Taz, Tead1, Gadd45b and Ctgf)] (Figure 6b). Next, we assessed whether their expression was TET1 dependent, by evaluating their mRNA levels following TET1 depletion in RosaCreERT2/Tet1flx/flx organoids. We found a consistent down-regulation of YAP/Hippo pathway components such as Wwtr1/Taz and Tead1 and target genes such as Gadd45b and Ctgf upon TET1 knock-down (Figure 6c). The expression levels of these, except for Gadd45b, were rescued in TET1 hypo-OE organoids (Figure 6d). For several of the components and targets of the ErbB/MAPK pathways (Egfr, Foxo3, Jun) we detected both, up- or down-regulation following TET1 knock-down (Figure 6c).
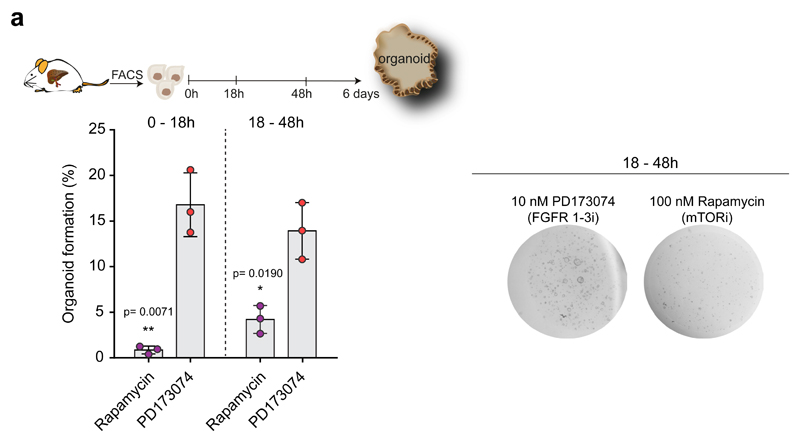
Thus, we evaluated whether TET1-dependent regulation of these pathways is involved in the acquisition of cellular plasticity during organoid formation. We confirmed TET1 binding to some of these targets at 18hrs after seeding (Figure 6e). To elucidate whether ErbB, MAPK and YAP/Hippo signalling act down-stream of TET1, we then supplemented the cultures with small molecule inhibitors of the aforementioned pathways (Gefitinib (EGFRi), PD032509 (MEKi) and Verteporfin (YAPi)) for the first 18h in culture (0-18hrs), i.e., before TET1 binding, and at 18hrs-48hrs, i.e., after TET1 binding, and evaluated organoid formation efficiency 6 days later. Treatment at 18-48hrs, once TET1 is bound to its targets, induced a significant decrease of organoid formation, thus suggesting that the regulation of ErbB, MAPK and YAP/Hippo signalling could represent one of the mechanisms by which TET1 positively regulates organoid formation from mature liver ductal cells (Figure 6f). Conversely, treatment before TET1 binding (0-18h) or inhibition of FGFR1/3 did not cause any significant effect on organoid formation (Figure 6f and Extended Data Figure 7a). mTOR inhibition instead, resulted in ablation of organoid formation regardless of the time of supplementation, suggesting that either this pathway is essential during the first 18h for ductal cell survival in vitro or is not regulated by TET1 (Extended Data Figure 7a). Thus, our results suggest that TET1 promotes the acquisition of cellular plasticity in ductal cells, at least in part, via the regulation of YAP/Hippo and ErbB, MAPK signalling pathways.
TET1 is required for ductal-mediated hepatocyte and cholangiocyte regeneration
To elucidate whether TET1 is relevant for liver regeneration, we induced liver damage to the Tet1 hypomorphic and ductal specific Tet1 mutant mice. As damage paradigms, we opted for three different models: (1) acute damage with 5 days DDC treatment; (2) chronic damage caused by repetitive doses of DDC and (3) a damage model where hepatocyte proliferation is impaired by over-expression of p21 and ductal cells have been demonstrated to regenerate both themselves and hepatocytes2,8,9 (Supplementary Table 1).
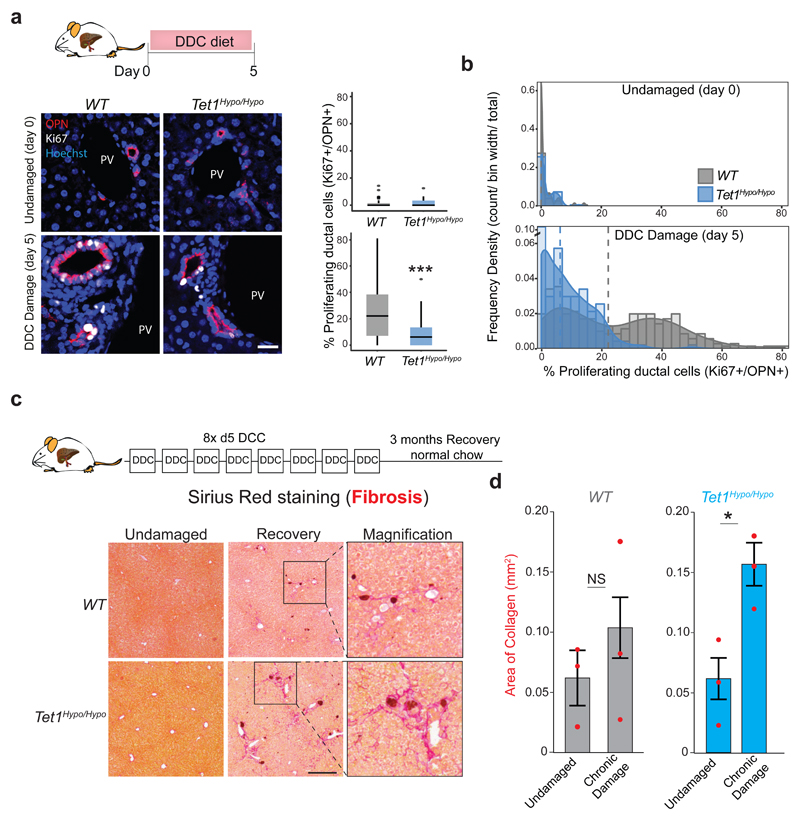
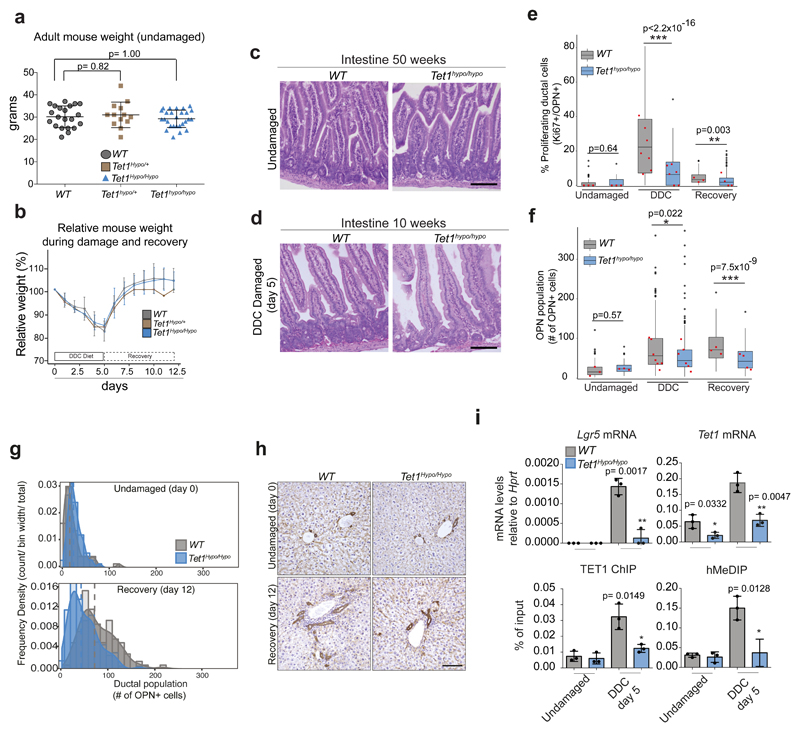
To address the role of TET1 during acute liver damage we used the TET1 hypomorphic allele (Tet1hypo/hypo), since the conditional RosaCreERT2 /Tet1flx/flx exhibited partial lethality upon Cre induction, in agreement with the published TET1 full KO31 (Supplementary Table 1). Tet1hypo/hypo mice presented no obvious phenotype under homeostasis (Extended Data Figure 8a-d). However, upon damage, it exhibited significantly lower number of proliferating liver ductal cells (Ki67+/OPN+ cells) and absolute number of liver ductal cells when compared to WT control littermates (Figures 7a-b and Extended Data Figure 8e-h). Notably, this reduced proliferation of the ductal compartment was not explained by differences in the extent of liver damage between genotypes (Extended Data Figure 8b and d).
Fig. 7. Tet1 hypomorphic mice exhibit reduced ductal regeneration and extensive fibrosis upon damage.
a-b, WT (grey) and Tet1hypo/hypo mice (blue) were fed normal chow or a chow supplemented with 0.1% DDC for 5 days. Individual values of independent experiments are shown in Extended Data Figure 8f. a, Representative images of immunofluorescence staining for the ductal marker OPN (red) and the proliferation marker Ki67 (white). Scale bar, 25μm. PV, portal vein. Graphs represent the percentage of proliferating (Ki67+) ductal cells (OPN+) (median±IQR) obtained from 55 FOV for WT (n=3) and 56 FOV for Tet1hypo/hypo mice (n=3) at day 0 (undamaged), and 253 FOV for WT (n=7) and 169 FOV for Tet1hypo/hypo (n=6) at day5 of DDC damage. Data are represented a boxplots showing the median, IQR and overall range. Dots represent outliers from a single counted FOV defined as >1.5 IQR above or below the median. p-values were obtained using two-sided KolmogoroV-Smirnov test. ***, p< 2.2x10⁻¹⁶. b, Histogram showing the population distribution of proliferating ductal cells (OPN+, Ki67+) by plotting frequency density of counts across the sample range (bar) and the kernel density estimate line. Dashed lines show median values. c-d, WT (grey) and Tet1hypo/hypo (blue) mice were fed normal chow or a chow supplemented with 0.1% DDC for 5 days for 8 consecutive cycles as described in the scheme and methods. Liver tissues were collected 3 months after the last cycle and PicroSirius red staining was performed to analyse the levels of fibrosis (collagen deposition). c, Representative images of PicroSirius red staining (red) (n=3 mice per time point). Scale bar, 200μm. d, Graph represents mean±95% CI of the area of collagen deposition per FOV (n=3 mice per time point per genotype). Statistical analysis was performed on the 3 mean values per genotype compared to undamaged using Student's two-tailed t-test. *, p<0.05.
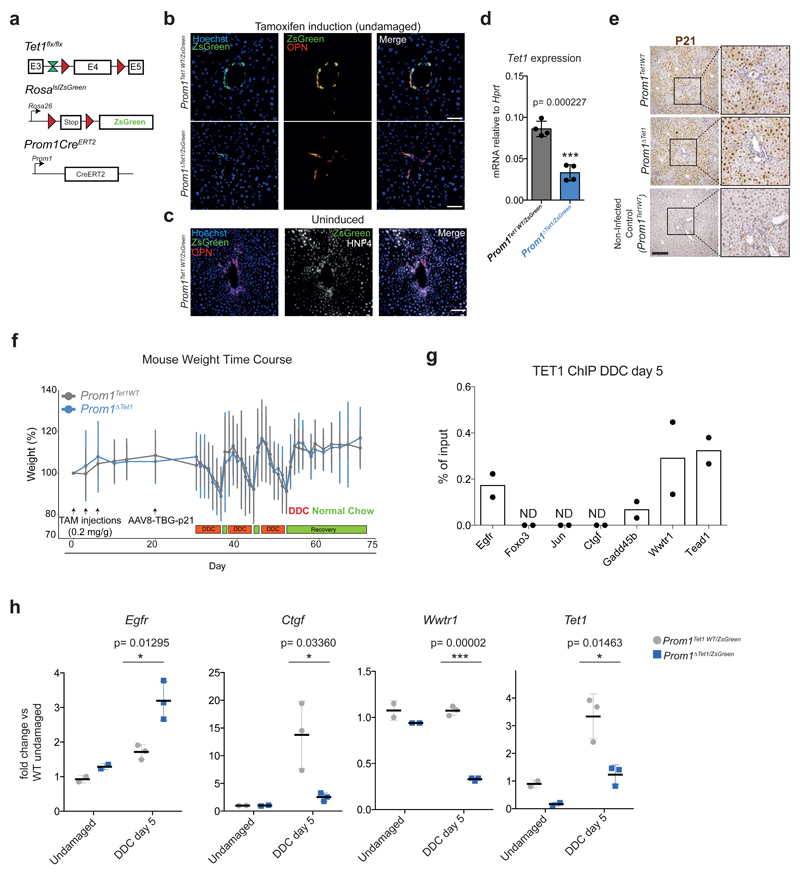
Interestingly, upon chronic liver damage, Tet1hypo/hypo mice presented extended fibrosis (Figure 7c-d). Since Lgr5 depletion in vivo results in tissue fibrosis55 we evaluated the levels of Lgr5 in our mutant mice and found reduced expression and less hydroxymethylation of Lgr5 loci in Tet1hypo/hypo mice (Extended Data Figure 8i). To discriminate whether the defects on liver regeneration observed were caused by the lack of TET1 expression in the adult ductal compartment, we generated a ductal-specific TET1 mutant mouse by crossing the Tet1flx/flx allele with the ductal specific driver Prom1CreERT2 (Extended Data Figure 9a and56,57). To visualise and trace recombination events, we further combined this mouse with the RosalslZsGreen reporter to generate the Prom1CreERT2/RosalslZsGreen/Tet1flx/flx, referred here as Prom1ΔTet1/ZsGreen in contrast to the TET1 WT, named here as Prom1Tet1WT/ZsGreen mice. We confirmed the reliability of the ZsGreen to reflect TET1 levels after recombination. No ZsGreen induction was found without tamoxifen treatment (Extended Data Figure 9b-d).
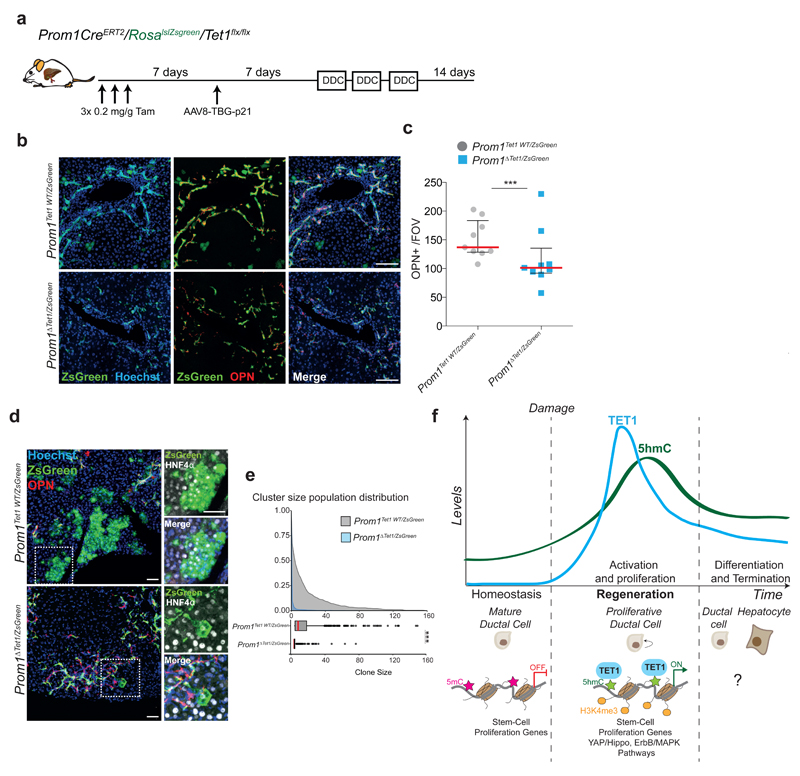
To assess the role of TET1 in ductal-mediated liver regeneration, we used a recently established liver damage model where hepatocyte proliferation is inhibited by p21-over-expression9 and fed the mice DDC for 3 weeks (Figure 8a and Extended Data Figure 9e-f). We observed a massive expansion of ductal cells (OPN+/ZsGreen+) in Prom1Tet1WT/ZsGreen mice while Prom1ΔTet1/ZsGreen mice exhibited a significant reduction (Figure 8b-c), in agreement with our Tet1 hypomorphic model (see Figure 7a-b). Notably, when we examined the contribution of TET1 depleted ductal cells to hepatocyte regeneration, we observed a dramatic reduction in the size of hepatocyte clusters in the Prom1ΔTet1/ZsGreen mice, with most clusters formed by 1-2 cells only, while Prom1Tet1WT/ZsGreen mice readily generated hepatocyte clusters from 1 to 156 cells (Figure 8d-e).
Fig. 8. Ductal specific TET1 depletion results in impaired hepatocyte regeneration.
a, Experimental Scheme. b, Representative images of 10μm liver sections showing ZsGreen+ ductal cells (OPN+) (n=9 per genotype). Scale bar, 50μm c, Graph showing median±IQR of average OPN+ cells per FOV for each individual mouse (n=9 per genotype). Global median level is highlighted in red. p-value was calculated using Wilcoxon rank sum test.*, p= 0.03768. d, Representative images of 50μm frozen liver sections showing regenerative clusters of ZsGreen+ hepatocytes (HNF4a+) and ductal cells (OPN+). Scale bar, 50μm. e, Cumulative relative frequency plots (top graph) and corresponding box plots (bottom graph) showing median (red), upper and lower quartiles and the range (dots represent outliers) of ZsGreen+ hepatocyte cluster size of Prom1Tet1WT/ZsGreen (n=3) and Prom1ΔTet1/ZsGreen (n=6) mice. p-value was determined by two sided KolomogoroV-Smirnov test. ***, p< 2.2x10⁻¹⁶. f, Experimental model.
Molecular analysis of TET1-null ductal cells upon damage indicated that also in vivo TET1 binds to the TSS and regulates the expression of some genes from the pro-regenerative YAP/Hippo and ErbB/MAPK signalling pathways (namely Egfr, Gadd45b, Wwtr1/Taz and Tead1) (Extended Data Figure 9g-h), in line with our organoid data (see Figure 6).
Altogether, our studies demonstrate that TET1 plays a crucial role in ductal-driven liver regeneration, at least in part, through the direct activation of the YAP/Hippo and ErbB/MAPK signalling pathways.
Discussion
Many adult epithelial tissues exhibit cellular plasticity not associated with unrelated fates, but with contribution to tissue repair (see58 for extended details). Under homeostasis a unipotent population of hepatocytes maintain the tissue45,59,60. Following hepatocyte injury, the lost tissue is repaired by remaining hepatocytes61. However, upon severe or chronic liver damage, mature cholangiocytes activate a regenerative response to restore both themselves and hepatocytes5,9,62,63. Yet, the molecular mechanisms behind the activation of this cellular plasticity on liver resident ductal cells remain largely unknown. This knowledge is critical to understand human liver diseases characterized by prominent ductal proliferation and hepatic fibrosis64,65. Here we demonstrate that upon damage and during organoid formation resident ductal cells undergo genome-wide changes in their transcriptional landscape and a significant remodelling of their DNA methylome and hydroxymethylome. We identify demethylation and TET1-mediated hydroxymethylation as an epigenetic mechanism required for ductal cell activation in vitro and in vivo, after damage (Figure 8f). The acquisition of the cellular plasticity that endows differentiated ductal cells with regenerative capacity in vivo, might occur through a progenitor state, as our organoid data imply. However, whether in vivo, new cells are provided through a direct division of differentiated cells, via de-differentiation to a progenitor state, by direct trans-differentiation or a combination of all these66, remains unknown and will require further and more extensive investigations.
Cancer cell lines and liver cancer, exhibit relatively low levels of 5hmC67,68. In contrast, our results, indicate that transient high levels of 5hmC are required to induce ductal cells to activate the regenerative program, similar to what has been reported in pluripotent cells39. TET enzymes have been shown to promote genome integrity in mouse ES cells69. Hence, it is tempting to speculate that transient Tet1 induction during liver damage might be a mechanism for activating the regenerative program in ductal cells while preserving genome integrity in the regenerating cell.
Interestingly, our analyses indicate that the mechanism by which TET1 facilitates the acquisition of cellular plasticity and subsequent pro-regenerative effect is, at least in part, through the direct regulation of ErbB, MAPK and YAP/Hippo regenerative pathways40,50–53. Whether other genes transcriptionally activated/repressed by TET1 are involved in the process requires further investigations.
Notably, the rewiring of the transcriptome and DNA methylome and hydroxymethylome occurs prior to proliferation, as a response to tissue damage and in the absence of any ectopic genetic manipulation. This mechanism resembles embryonic reprogramming, where genome-wide methylation erasure is essential to reset the epigenome for pluripotency28. Our observations might represent a more general mechanism by which adult committed cells initiate the regenerative response to damage.
Extended Data
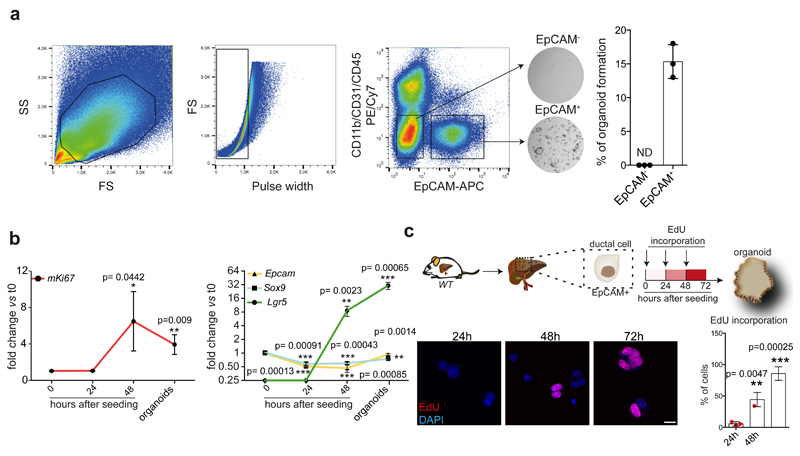
Extended Data Figure 1. Non-proliferative EpCAM+ ductal cells initiate organoid cultures.
a, EpCAM+ ductal cells were isolated from WT livers by FACS using a sequential gating strategy as follows: cells were gated for FSC and SSC and subsequently singlets were gated using FSC/Pulse width. Then, cells were negatively selected for PE/Cy7 (to exclude CD11b+, CD31+ and CD45+ cells) and positively selected for APC (EpCAM+) to obtain CD11b-/CD31-/CD45-/EpCAM+ ductal cells (EpCAM+ cells). These cells give rise to proliferative organoids with ~15% efficiency. Representative bright field pictures of 500 EpCAM+ and EpCAM- cells 6 days after seeding. Graph represents mean ±SD of n=3 independent experiments. b, RT-qPCR analysis of gene expression of the proliferation marker mKi67 (left) and stem-cell (Lgr5) and ductal (Epcam and Sox9) markers (right) at the indicated time points after seeding. Graphs represent the mean±SD of n= 3 independent experiments. p-value obtained using Student's two tailed t-test upon comparison to t= 0h. *, p<0.05; ***, p<0.001. c, Proliferation analysis. EdU (10μM) was incorporated to sorted EpCAM+ ductal cells at different intervals after seeding (0h, 24h and 48h, arrows) and evaluated by immunofluorescence analysis 24h after each incorporation. Representative images are shown. Scale bar, 10μm. Graph represents the percentage of EdU+ cells. Results are expressed as mean±SD cells from n= 3 independent experiments. Student's two tailed t-test statistical analyses were performed vs t=24h. *, p<0.05; **, p<0.01; ***, p<0.001
Extended Data Figure 2. Transcriptional changes in ductal cells in vitro during liver organoid formation and in vivo upon damage.
a-e, RNA-seq analysis of ductal cells isolated from adult livers (0h) and at different time points after culture. For DE genes, a pairwise approach with Wald test was performed on each gene using Sleuth. FDR <0.1 was selected as threshold. a, Graphs represent the number of significantly DE genes for each comparison. b, Hierarchical clustering analysis of epigenetic regulators found DE (383 out of 698 published in ref 49), in at least one comparison. Heatmap represents averaged TPM values scaled per gene. Results are presented as the averaged gene expression of ≥3 biological replicates. c-e, RNA-seq analysis of ductal cells isolated from adult livers (0h) and at day 3 and day 5 after liver damage (n=2 independent mice per time point). The heatmap shows 1552 genes DE at least in one comparison (TPM>5, FDR<0.1, |b|>0.58). Clustering analysis identified 5 different clusters (Clusters 1-5) according to the expression profile. Number of genes in each cluster is indicated in brackets. Results are presented as average of the at least 3 biological replicates. d, Graph represents the number of significant DE genes in the different comparisons. e, GO and statistical analyses of the 3 main clusters identified in c were perfomed using DAVID 6.8.
Extended Data Figure 3. TET1 catalytic activity is required for liver organoid formation and maintenance.
a, Tet1 and Lgr5 mRNA levels (n=3 mice). Student's two-tailed t-test statistical analyses were performed vs undamaged. b, Tet1 mRNA levels (24h after transfection) and organoid formation efficiency 10 days after Tet1 siRNA knock-down using 4 independent Tet1 siRNAs. Data is presented as percentage relative to siCtrl. Graph indicates mean±SD of n=3 independent experiments. Student's two-tailed t-test statistical analyses were performed vs siCtrl. c, Scheme of the two different Tet1 alleles used. d, Tet1 mRNA levels in WT, Tet1hypo/+ and Tet1hypo/hypo and Tet1 conditional knock-out (cKO) organoids presented as mean±SD of n=3 experiments. e, Representative Western blot image showing TET1 protein levels in WT, Tet1hypo/+ and Tet1hypo/hypo organoids (n=3 independent experiments). f, Organoid formation efficiency from FACS-sorted EpCAM+ cells derived from RosaCreERT2 x Tet1 flx/flx livers treated with 5μM hydroxytamoxifen (mean±SD of n=3 independent experiments). Student's two-tailed t-test statistical analyses were performed vs non-induced control. g, Whole mount immunofluorescence staining of 5hmC (green) on WT, Tet1hypo/hypo, hypo-OE and hypo-OEcat.mut. organoids. Representative images are shown (n=2 experiments). Scale bar, 50 μm. h, Graph represents organoid size at the indicated passages (mean±SD of n=3 independent experiments). Student's two tailed t-test statistical analyses were performed vs WT. i, Growth curves. j, Organoid formation efficiency at the indicated passage expressed as a percentage of organoids. Graphs represent mean±SD of n=3 independent experiments. Student's two tailed t-test statistical analyses were performed vs WT. k, Representative confocal images of Cleaved Caspase 3 whole mount immunostaining on WT, Tet1hypo/hypo, hypo-OE and hypo-OEcat.mut. organoids (n=2 independent experiments). Scale bar, 25μm.
Extended Data Figure 4. WGBS of ductal cells upon damage uncovers a global epigenetic remodelling of the DNA methylome.
a, Number of WGBS unique mapped reads in the different biological replicates. b, Bisulfite conversion rate. c-h, WGBS analyses were performed in merged biological replicates per time point (n=2). Only CpG sites with ≥3 reads were further analysed. c, CpG counts in merged biological replicates per time point. d, Genome-wide Spearman’s correlation score at the time points analysed shows dynamic CpG modifications. e, Functional localisation of DMRs. DMRs were called if the difference in cytosine modification between samples was ≥25% with a p-value of <0.05, using DSS software. f, Violin plot of the DMR length distribution (in base pairs) identified in the n=2 biological replicates. Lines and numbers, median. g, Density plot indicating the difference in mCpG levels for loss/gain DMRs for each comparison. h, Venn diagram showing the overlap between TET1 targets (see Figure 5) that are transcriptionally up-regulated and genes showing either loss (left) or gain (right) of mCpG at the TSS according to the WGBS analyses. Hierarchical clustering analyses of the overlapping genes are presented as heatmaps of TPMs scaled per gene (Z-score).
Extended Data Figure 5. 5hmC levels increase in ductal cells in vitro andin vivo upon damage.
a-c, EpCAM+ ductal cells sorted from 0.1% DDC livers (a), β1 integrin mutant mice fed with normal chow (undamaged) or DDC (b) or WT undamaged livers and grown as organoids (c). 5hmC fluorescence intensity was normalised to DAPI. Data are presented as violin plots of the ratio 5hmC/DAPI. Each dot represents the median value (shown in red) of cells counted/mouse (a, n=353 cells from 4 undamaged mice, n= 231 cells from 5 mice after 3 days of DDC, and n=392 cells from 5 mice at DDC d5; b, n=138 cells from undamaged, n=119 cells at day 1, n=247 at day 7 and n=125 at day 14 after returning the mice to normal chow (recovery); c, n=2500 (0h), n=900 (24h) and n=2000 (48h) cells from n=3 independent experiments. p-values were calculated using pairwise comparisons with Wilcoxon rank sum test. a, d3 vs d0 p= 1x10-13 ; d5 vs d0 p< 2.2x10⁻¹⁶. c, 0h vs 24h p< 2.2x10⁻¹⁶ ; 48h vs 0h p< 2.2x10⁻¹⁶. Scale bar, 10μm. d, All 5hmC sites identified by RRHP. e, Number of genes associated to TSS showing differential 5hmC levels. The number of CpG sites (n) with unique gain of hydroxymethylation is shown. f, Graphs represent distribution of percentage of mCpG identified by WGBS in CGI outside TSS (n=32673) using the average of the 2 independent samples (violin plots, black lines median, left) and number of 5hmC counts (median±IQR) in CGI outside TSS (n= 25579) (right) (n=2 independent samples). g, GO and statistical analyses of the clusters identified in Fig. 4j were performed using DAVID 6.8. Heatmap shows the expression profile of the 84 overlapping genes and is presented as averaged Z score of (n=2)
Extended Data Figure 6. TET1 regulates actively transcribed genes in liver organoids.
a-d, DamID-sequencing was performed in EpCAM+ sorted ductal cells derived from already established liver organoids (n=3 independent experiment). Only TET1-Dam peaks identified in all 3 experiments were considered for futher analyses. a, Scheme of DamID-seq protocol. b, Heatmaps showing TET1 peaks identified by DamID-seq (left panels) and H3K4me3 peaks identified by ChIP-seq (right panels). Heatmaps are centred in the middle of the peak (0) and show a genomic window of ±10kb. Top heatmaps represent common peaks between TET1 and H3K4me3 (2848 peaks) while bottom heatmaps represent TET1-specific peaks (2254 peaks). c, Pie-chart indicates the percentage of genomic distribution of TET1-Dam peaks. d, GO and statistical analyses of biological processes among TET1-Dam targets in liver organoids were performed using DAVID 6.8. n, number of genes. e, 5hmC and 5mC levels determined by MeDIP and hMeDIP followed by qPCR on the indicated genomic region surrounding Lgr5 TSS in WT (black), Tet1hypo/hypo (blue) and hypo-OE (red) organoids. Graphs represent mean±SD of n=3 independent experiments. Student's two tailed was performed comparing samples to WT. *, p<0.05; ** =p <0.01 f, TET1 ChIP-qPCR at Lgr5 TSS (left panel) and Lgr5 mRNA levels (right panel) in WT, Tet1hypo/hypo and hypo-OE organoids. Graphs represent mean±SD of 3 independent experiments. Student's two tailed t-test statistical analyses were performed vs WT. **, p <0.01 g, Sorted EpCAM+ cells from WT livers were cultured in organoid medium and harvested for DNA, chromatin and mRNA expression analyses at the indicated time points. Graphs represent mean±SD of 3 independent experiments. Student's two tailed t-test analyses were performed vs t=0h *, p<0.05; ** =p <0.01; *** =p <0.001
Extended Data Figure 7. Treatment with Rapamycin impairs organoid formation.
a, EpCAM+ ductal cells freshly isolated from the undamaged liver were treated at 0-18hrs or 18-48hrs with the indicated small molecule inhibitors. Organoid formation was quantified at day 6. Graph represents organoid formation efficiency and indicates mean ±SD of n=3 independent experiments. Statistical analyses were performed with two-ways ANOVA with Bonferroni’s multiple compared test (vs DMSO control group). DMSO control quantifications are shown in Fig. 6f. Representative pictures of organoids treated with the inhibitors at 18-48hrs are shown.
Extended Data Figure 8. TET1 hypomorphic mice present a significantly impaired ductal regeneration upon damage.
a, Graph represents mean ±SD of mouse weight of WT (n=21 mice), Tet1hypo/+ (n=13 mice) and Tet1hypo/hypo (n=27 mice) littermates. Student's two tailed t-test statistical analyses were performed. b, Relative mouse weight of WT (n=5), Tet1hypo/+ (n=1) and Tet1hypo/hypo (n=5) mice. c, Representative H&E stainings (n=3 experiments) of intestines from 50 week old WT and Tet1hypo/hypo mice. Scale bar, 100μm. . d, Representative H&E stainings (n=3 experiments) of small intestine from 10 week old WT and Tet1hypo/hypo mice treated with DDC for 5 days. Scale bar, 100μm. e-f, Box-and-whisker plots showing median and IQR of proliferating ductal cells (OPN+/Ki67+) (e) or total ductal cells (OPN+) (f). Undamaged, n=3 WT and n=3 Tet1hypo/hypo ; DDC, n=7 WT and n=6 Tet1hypo/hypo ; Recovery, n=3 WT and n=4 Tet1hypo/hypo). Dots, outliers. Squares, median level corresponding to each independent mice. p-values obtained by two-sided Kolmogorov-Smirnov test. g, Population distribution of the total number of ductal cells (OPN+) Dashed lines show median values obtained from 55 FOV (n=3) for WT and 56 FOV for Tet1hypo/hypo (n=3) mice at day 0 (undamaged) and 110 FOV for WT (n=3) and 153 FOV for Tet1hypo/hypo (n=4) mice at day 12 (recovery). h, PCK immunohistochemistry (n=3 experiments) from WT (left) and Tet1hypo/hypo (right) undamaged or in recovery after DDC (day 12) livers. Nucleus, Haematoxylin. Scale bar, 100μm. i, Lgr5 and Tet1 mRNA levels, TET1 ChIP and hMedIP on Lgr5 TSS were analysed in undamaged and DDC treated livers. Graphs represent mean±SD of values obtained from n=3 independent biological replicates (dot). p-value was calculated using Student's two-tailed t-test.
Extended Data Figure 9. Ductal specific Tet1 conditional deletion impairs duct-mediated liver regeneration.
a, Schematic of the Prom1CreERT2/RosalslZsGreen/Tet1flx/flx mouse model. b, Representative immunofluorescence analysis (OPN+ red, ZsGreen+, green) of Prom1ΔTet1/ZsGreen and Prom1Tet1WT/ZsGreen upon tamoxifen treatment and injection of AAV8-TBG p21 (n=2 mice per genotype). Nucleus, Hoechst. Scale bar, 50 μm c, Representative immunofluorescence analysis of livers from Prom1Tet1WT/ ZsGreen mice injected with AAV8-TBG p21 not receiving tamoxifen treatment (n=2 mice per genotype). Scale bar, 100 μm. d, Tet1 expression in EpCAM+/ZsGreen+ ductal cells isolated by FACS from Prom1ΔTet1/ZsGreen (n=4) or Prom1Tet/ZsGreen (n=4) livers derived from mice treated for 3-cycles of DDC and collected 12 days after damage. Graph represents the expression of Tet1 for both genotypes expressed as a fold change compared to Prom1Tet1WT. Student's two tailed t-test statistical analyses were performed. ***, p<0.001. e, Representative pictures of P21 immunohistochemistry analyses. Scale bar, 200 μm. f, Weight curves of mice undergoing AAV8-TBG-p21 injection followed by DDC treatment (mean± 95%CI). g, TET1 ChIP-qPCR analyses on target genes in ZsGreen+/EpCAM+ ductal cells isolated from Prom1Tet1WT/ZsGreen DDC-treated livers for 5 days. Cells isolated from 3 mice littermates were pooled used for each independent experiment (n=2). ND, not detected. h, Graph represents mean ±SD of mRNA expression of Tet1 and selected target genes (fold change vs WT undamaged) in EpCAM+ ductal cells isolated from undamaged (n=2 per genotype) or day 5 DDC-treated livers (n=3 per genotype) derived from Prom1Tet1WT/ZsGreen (grey) or Prom1ΔTet1/ZsGreen (blue) mice. Statistical analysis was performed using Student's two-tailed t-test compared to the Prom1Tet1WT/ZsGreen value at the corresponding time point.
Supplementary Material
Acknowledgements
M.H. is a Wellcome Trust Sir Henry Dale Fellow and is jointly funded by the Wellcome Trust and the Royal Society (104151/Z/14/Z). A.H.B. was funded by Wellcome Trust Senior Investigator Award 103792 and Royal Society Darwin Trust Research Professorship. S.J.F. is supported by a MRC grant: MR/P016839/1. L.A. was supported by a Marie-Curie Postdoctoral fellowship (Grant RG81823_H2020-MSCA-IF-2016) and a NC3Rs grant awarded to M.H (NC/R001162/1). M.A.M. is supported by a Medical Research Council (MRC) doctoral training grant (MR/K50127X/1). L.C-E is jointly funded by a Wellcome Trust Four-Year PhD Studentship with the Stem Cell Biology and Medicine Programme and by a Wellcome Cambridge Trust Scholarship. J.v.d.A. was supported by EMBO Long-term Fellowship ALTF 1600_2014 and Wellcome Trust Postdoctoral Training Fellowship for Clinicians 105839. F.A. is supported by ERC advanced research grant to M.Z.G. M.Z.G. is a Wellcome Trust Senior Research Fellow. This work was partially funded by a H2020 LSMF4LIFE (ECH2020-668350) awarded to M.H. and partially funded by ERC advanced grant to M.Z.G and a Wellcome Trust Senior Investigator Award awarded to E.A.M. (104640/Z/14/Z, 092096/Z/10/Z) and a Cancer Research Programme Grant awarded to E.A.M. (C13474/A18583, C6946/A14492). G.V. would like to thank Wolfson College at University of Cambridge and the Genetics Society, London for financial help. The authors acknowledge core funding to the Gurdon Institute from the Wellcome Trust (092096) and CRUK (C6946/A14492). The authors thank Dr Robert Krautz and Dr Walter Sanseverino for advice on bionformatic analyses; Mr Robert Arnes-Benito and Andrew A. Malcom, for histological and immunostaining assistance; Dr Wolf Reik and Dr José Silva for sharing TET1 plasmids; Mr Richard Butler for developing macro scripts to quantify 5hmC stainings; Mr Kay Harnish and Dr Charles Bradshaw of the Gurdon Institute genomic and bioinformatic facility for high-throughput sequencing; The Gurdon Institute facilities for assistance with imaging, animal care and bioinformatics analysis and Dr Andy Riddell and Dr Maike Paramor (Cambridge Stem Cell Institute) for assistance with FACS sorting and library preparation, respectively; CRUK CI genomic facility for sequencing of WGBS and RRHP libraries; Margaret Keighren (MRC Human Genetics Unit, University of Edinburgh) for technical support. Life Science editors for assistance during manuscript preparation. M.H. would like to thank Prof Benjamin Simons and Prof Hans Clevers for critical comments on the manuscript.
Footnotes
Author contributions
M.H. and L.A. conceived and designed the project and interpreted the results. L.A., M.A.M., L.C-E., G.B., G.V., N.A., J.v.d.A., A.R. and MH designed and performed experiments and interpreted results.. L.A. designed and performed the in vitro experiments, M.A.M., designed and performed the in vivo experiments, L.C-E., the hydroxymethylation and EdU stainings, G.B, experiments with small molecule inhibitors. G.V. and E.A.M. prepared and analysed WGBS and RRHP libraries, analysed RNAseq and interpreted corresponding bionformatic analyses related. N.A., A.R. and S.J.F. performed experiments with β1 integrin model and interpreted results of the p21 models. J.v.d.A. and A.H.B. performed DamID-seq experiments. B.F-C helped on the in vivo analysis. R.A.C. helped on bioinformatics analyses. R.L.M. provided the R26Fucci2a line. F.A. and M.Z.G. performed the live imaging of ductal cells. L.A. and M.H. wrote the manuscript. All authors commented on the manuscript.
Authors declare no competing financial interests.
Data availability:
RNA, ChIP, DamID, WGBS and RRHP sequencing data that support the findings of this study have been deposited in the Gene Expression Omnibus (GEO) under accession code GSE123133.
All other data supporting the findings of this study are available from the corresponding author on reasonable request.
References
- 1.Choi TY, Ninov N, Stainier DY, Shin D. Extensive conversion of hepatic biliary epithelial cells to hepatocytes after near total loss of hepatocytes in zebrafish. Gastroenterology. 2014;146:776–788. doi: 10.1053/j.gastro.2013.10.019. [DOI] [PMC free article] [PubMed] [Google Scholar]
- 2.Russell JO, et al. Hepatocyte-specific beta-catenin deletion during severe liver injury provokes cholangiocytes to differentiate into hepatocytes. Hepatology. 2018 doi: 10.1002/hep.30270. [DOI] [PMC free article] [PubMed] [Google Scholar]
- 3.Espanol-Suner R, et al. Liver progenitor cells yield functional hepatocytes in response to chronic liver injury in mice. Gastroenterology. 2012;143:1564–1575 e1567. doi: 10.1053/j.gastro.2012.08.024. [DOI] [PubMed] [Google Scholar]
- 4.Huch M, et al. In vitro expansion of single Lgr5+ liver stem cells induced by Wnt-driven regeneration. Nature. 2013;494:247–250. doi: 10.1038/nature11826. [DOI] [PMC free article] [PubMed] [Google Scholar]
- 5.Lu WY, et al. Hepatic progenitor cells of biliary origin with liver repopulation capacity. Nat Cell Biol. 2015;17:971–983. doi: 10.1038/ncb3203. [DOI] [PMC free article] [PubMed] [Google Scholar]
- 6.Sackett SD, et al. Foxl1 is a marker of bipotential hepatic progenitor cells in mice. Hepatology. 2009;49:920–929. doi: 10.1002/hep.22705. [DOI] [PMC free article] [PubMed] [Google Scholar]
- 7.Shin S, et al. Foxl1-Cre-marked adult hepatic progenitors have clonogenic and bilineage differentiation potential. Genes Dev. 2011;25:1185–1192. doi: 10.1101/gad.2027811. [DOI] [PMC free article] [PubMed] [Google Scholar]
- 8.Deng X, et al. Chronic Liver Injury Induces Conversion of Biliary Epithelial Cells into Hepatocytes. Cell stem cell. 2018;23:114–122 e113. doi: 10.1016/j.stem.2018.05.022. [DOI] [PubMed] [Google Scholar]
- 9.Raven A, et al. Cholangiocytes act as facultative liver stem cells during impaired hepatocyte regeneration. Nature. 2017;547:350–354. doi: 10.1038/nature23015. [DOI] [PMC free article] [PubMed] [Google Scholar]
- 10.Barker N, et al. Identification of stem cells in small intestine and colon by marker gene Lgr5. Nature. 2007;449:1003–1007. doi: 10.1038/nature06196. [DOI] [PubMed] [Google Scholar]
- 11.Prior N, et al. Lgr5(+) stem and progenitor cells reside at the apex of a heterogeneous embryonic hepatoblast pool. Development. 2019;146 doi: 10.1242/dev.174557. [DOI] [PMC free article] [PubMed] [Google Scholar]
- 12.Okabe M, et al. Potential hepatic stem cells reside in EpCAM+ cells of normal and injured mouse liver. Development. 2009;136:1951–1960. doi: 10.1242/dev.031369. [DOI] [PubMed] [Google Scholar]
- 13.Huch M, et al. Long-term culture of genome-stable bipotent stem cells from adult human liver. Cell. 2015;160:299–312. doi: 10.1016/j.cell.2014.11.050. [DOI] [PMC free article] [PubMed] [Google Scholar]
- 14.Li B, et al. Adult Mouse Liver Contains Two Distinct Populations of Cholangiocytes. Stem Cell Reports. 2017 doi: 10.1016/j.stemcr.2017.06.003. [DOI] [PMC free article] [PubMed] [Google Scholar]
- 15.Messerschmidt DM, Knowles BB, Solter D. DNA methylation dynamics during epigenetic reprogramming in the germline and preimplantation embryos. Genes Dev. 2014;28:812–828. doi: 10.1101/gad.234294.113. [DOI] [PMC free article] [PubMed] [Google Scholar]
- 16.Iurlaro M, von Meyenn F, Reik W. DNA methylation homeostasis in human and mouse development. Curr Opin Genet Dev. 2017;43:101–109. doi: 10.1016/j.gde.2017.02.003. [DOI] [PubMed] [Google Scholar]
- 17.Smith ZD, Meissner A. DNA methylation: roles in mammalian development. Nat Rev Genet. 2013;14:204–220. doi: 10.1038/nrg3354. [DOI] [PubMed] [Google Scholar]
- 18.Bird A. DNA methylation patterns and epigenetic memory. Genes Dev. 2002;16:6–21. doi: 10.1101/gad.947102. [DOI] [PubMed] [Google Scholar]
- 19.Li E, Zhang Y. DNA methylation in mammals. Cold Spring Harb Perspect Biol. 2014;6 doi: 10.1101/cshperspect.a019133. a019133. [DOI] [PMC free article] [PubMed] [Google Scholar]
- 20.Probst AV, Dunleavy E, Almouzni G. Epigenetic inheritance during the cell cycle. Nat Rev Mol Cell Biol. 2009;10:192–206. doi: 10.1038/nrm2640. [DOI] [PubMed] [Google Scholar]
- 21.Kohli RM, Zhang Y. TET enzymes, TDG and the dynamics of DNA demethylation. Nature. 2013;502:472–479. doi: 10.1038/nature12750. [DOI] [PMC free article] [PubMed] [Google Scholar]
- 22.Pastor WA, Aravind L, Rao A. TETonic shift: biological roles of TET proteins in DNA demethylation and transcription. Nat Rev Mol Cell Biol. 2013;14:341–356. doi: 10.1038/nrm3589. [DOI] [PMC free article] [PubMed] [Google Scholar]
- 23.Hill PW, Amouroux R, Hajkova P. DNA demethylation, Tet proteins and 5-hydroxymethylcytosine in epigenetic reprogramming: an emerging complex story. Genomics. 2014;104:324–333. doi: 10.1016/j.ygeno.2014.08.012. [DOI] [PubMed] [Google Scholar]
- 24.Hahn MA, Szabo PE, Pfeifer GP. 5-Hydroxymethylcytosine: a stable or transient DNA modification? Genomics. 2014;104:314–323. doi: 10.1016/j.ygeno.2014.08.015. [DOI] [PMC free article] [PubMed] [Google Scholar]
- 25.Branco MR, Ficz G, Reik W. Uncovering the role of 5-hydroxymethylcytosine in the epigenome. Nat Rev Genet. 2011;13:7–13. doi: 10.1038/nrg3080. [DOI] [PubMed] [Google Scholar]
- 26.Yamaguchi S, Shen L, Liu Y, Sendler D, Zhang Y. Role of Tet1 in erasure of genomic imprinting. Nature. 2013;504:460–464. doi: 10.1038/nature12805. [DOI] [PMC free article] [PubMed] [Google Scholar]
- 27.Hill PWS, et al. Epigenetic reprogramming enables the transition from primordial germ cell to gonocyte. Nature. 2018;555:392–396. doi: 10.1038/nature25964. [DOI] [PMC free article] [PubMed] [Google Scholar]
- 28.Ficz G, et al. Dynamic regulation of 5-hydroxymethylcytosine in mouse ES cells and during differentiation. Nature. 2011;473:398–402. doi: 10.1038/nature10008. [DOI] [PubMed] [Google Scholar]
- 29.Costa Y, et al. NANOG-dependent function of TET1 and TET2 in establishment of pluripotency. Nature. 2013;495:370–374. doi: 10.1038/nature11925. [DOI] [PMC free article] [PubMed] [Google Scholar]
- 30.Rasmussen KD, Helin K. Role of TET enzymes in DNA methylation, development, and cancer. Genes Dev. 2016;30:733–750. doi: 10.1101/gad.276568.115. [DOI] [PMC free article] [PubMed] [Google Scholar]
- 31.Kim R, Sheaffer KL, Choi I, Won KJ, Kaestner KH. Epigenetic regulation of intestinal stem cells by Tet1-mediated DNA hydroxymethylation. Genes Dev. 2016;30:2433–2442. doi: 10.1101/gad.288035.116. [DOI] [PMC free article] [PubMed] [Google Scholar]
- 32.Reizel Y, et al. Postnatal DNA demethylation and its role in tissue maturation. Nature communications. 2018;9 doi: 10.1038/s41467-018-04456-6. 2040. [DOI] [PMC free article] [PubMed] [Google Scholar]
- 33.Tarlow BD, Finegold MJ, Grompe M. Clonal tracing of Sox9+ liver progenitors in mouse oval cell injury. Hepatology. 2014;60:278–289. doi: 10.1002/hep.27084. [DOI] [PMC free article] [PubMed] [Google Scholar]
- 34.Dorrell C, et al. Prospective isolation of a bipotential clonogenic liver progenitor cell in adult mice. Genes Dev. 2011;25:1193–1203. doi: 10.1101/gad.2029411. [DOI] [PMC free article] [PubMed] [Google Scholar]
- 35.Mort RL, et al. Fucci2a: a bicistronic cell cycle reporter that allows Cre mediated tissue specific expression in mice. Cell Cycle. 2014;13:2681–2696. doi: 10.4161/15384101.2015.945381. [DOI] [PMC free article] [PubMed] [Google Scholar]
- 36.Duncan AW, Dorrell C, Grompe M. Stem cells and liver regeneration. Gastroenterology. 2009;137:466–481. doi: 10.1053/j.gastro.2009.05.044. [DOI] [PMC free article] [PubMed] [Google Scholar]
- 37.Medvedeva YA, et al. EpiFactors: a comprehensive database of human epigenetic factors and complexes. Database (Oxford) 2015;2015 doi: 10.1093/database/bav067. bav067. [DOI] [PMC free article] [PubMed] [Google Scholar]
- 38.Huch M, Koo BK. Modeling mouse and human development using organoid cultures. Development. 2015;142:3113–3125. doi: 10.1242/dev.118570. [DOI] [PubMed] [Google Scholar]
- 39.Tahiliani M, et al. Conversion of 5-methylcytosine to 5-hydroxymethylcytosine in mammalian DNA by MLL partner TET1. Science. 2009;324:930–935. doi: 10.1126/science.1170116. [DOI] [PMC free article] [PubMed] [Google Scholar]
- 40.Natarajan A, Wagner B, Sibilia M. The EGF receptor is required for efficient liver regeneration. Proceedings of the National Academy of Sciences of the United States of America. 2007;104:17081–17086. doi: 10.1073/pnas.0704126104. [DOI] [PMC free article] [PubMed] [Google Scholar]
- 41.Yang L, et al. A single-cell transcriptomic analysis reveals precise pathways and regulatory mechanisms underlying hepatoblast differentiation. Hepatology. 2017;66:1387–1401. doi: 10.1002/hep.29353. [DOI] [PMC free article] [PubMed] [Google Scholar]
- 42.Marshall OJ, Southall TD, Cheetham SW, Brand AH. Cell-type-specific profiling of protein-DNA interactions without cell isolation using targeted DamID with next-generation sequencing. Nat Protoc. 2016;11:1586–1598. doi: 10.1038/nprot.2016.084. [DOI] [PMC free article] [PubMed] [Google Scholar]
- 43.Cheetham SW, et al. Targeted DamID reveals differential binding of mammalian pluripotency factors. Development. 2018;145 doi: 10.1242/dev.170209. [DOI] [PMC free article] [PubMed] [Google Scholar]
- 44.Hu M, et al. Wnt/beta-catenin signaling in murine hepatic transit amplifying progenitor cells. Gastroenterology. 2007;133:1579–1591. doi: 10.1053/j.gastro.2007.08.036. [DOI] [PubMed] [Google Scholar]
- 45.Wang B, Zhao L, Fish M, Logan CY, Nusse R. Self-renewing diploid Axin2(+) cells fuel homeostatic renewal of the liver. Nature. 2015;524:180–185. doi: 10.1038/nature14863. [DOI] [PMC free article] [PubMed] [Google Scholar]
- 46.Jensen KB, et al. Lrig1 expression defines a distinct multipotent stem cell population in mammalian epidermis. Cell stem cell. 2009;4:427–439. doi: 10.1016/j.stem.2009.04.014. [DOI] [PMC free article] [PubMed] [Google Scholar]
- 47.Chrysanthou S, et al. A Critical Role of TET1/2 Proteins in Cell-Cycle Progression of Trophoblast Stem Cells. Stem Cell Reports. 2018;10:1355–1368. doi: 10.1016/j.stemcr.2018.02.014. [DOI] [PMC free article] [PubMed] [Google Scholar]
- 48.Boj SF, et al. Diabetes risk gene and Wnt effector Tcf7l2/TCF4 controls hepatic response to perinatal and adult metabolic demand. Cell. 2012;151:1595–1607. doi: 10.1016/j.cell.2012.10.053. [DOI] [PubMed] [Google Scholar]
- 49.Fouraschen SM, et al. mTOR signaling in liver regeneration: Rapamycin combined with growth factor treatment. World journal of transplantation. 2013;3:36–47. doi: 10.5500/wjt.v3.i3.36. [DOI] [PMC free article] [PubMed] [Google Scholar]
- 50.Planas-Paz L, et al. YAP, but Not RSPO-LGR4/5, Signaling in Biliary Epithelial Cells Promotes a Ductular Reaction in Response to Liver Injury. Cell stem cell. 2019;25:39–53 e10. doi: 10.1016/j.stem.2019.04.005. [DOI] [PubMed] [Google Scholar]
- 51.Talarmin H, et al. The mitogen-activated protein kinase kinase/extracellular signal-regulated kinase cascade activation is a key signalling pathway involved in the regulation of G(1) phase progression in proliferating hepatocytes. Molecular and cellular biology. 1999;19:6003–6011. doi: 10.1128/mcb.19.9.6003. [DOI] [PMC free article] [PubMed] [Google Scholar]
- 52.Pepe-Mooney BJ, et al. Single-Cell Analysis of the Liver Epithelium Reveals Dynamic Heterogeneity and an Essential Role for YAP in Homeostasis and Regeneration. Cell stem cell. 2019;25:23–38 e28. doi: 10.1016/j.stem.2019.04.004. [DOI] [PMC free article] [PubMed] [Google Scholar]
- 53.Yimlamai D, et al. Hippo pathway activity influences liver cell fate. Cell. 2014;157:1324–1338. doi: 10.1016/j.cell.2014.03.060. [DOI] [PMC free article] [PubMed] [Google Scholar]
- 54.Serra D, et al. Self-organization and symmetry breaking in intestinal organoid development. Nature. 2019;569:66–72. doi: 10.1038/s41586-019-1146-y. [DOI] [PMC free article] [PubMed] [Google Scholar]
- 55.Lin Y, et al. HGF/R-spondin1 rescues liver dysfunction through the induction of Lgr5(+) liver stem cells. Nature communications. 2017;8 doi: 10.1038/s41467-017-01341-6. 1175. [DOI] [PMC free article] [PubMed] [Google Scholar]
- 56.Kamimoto K, et al. Heterogeneity and stochastic growth regulation of biliary epithelial cells dictate dynamic epithelial tissue remodeling. eLife. 2016;5 doi: 10.7554/eLife.15034. [DOI] [PMC free article] [PubMed] [Google Scholar]
- 57.Zhu L, et al. Multi-organ Mapping of Cancer Risk. Cell. 2016;166:1132–1146 e1137. doi: 10.1016/j.cell.2016.07.045. [DOI] [PMC free article] [PubMed] [Google Scholar]
- 58.Blanpain C, Fuchs E. Stem cell plasticity. Plasticity of epithelial stem cells in tissue regeneration. Science. 2014;344 doi: 10.1126/science.1242281. 1242281. [DOI] [PMC free article] [PubMed] [Google Scholar]
- 59.Lin S, et al. Distributed hepatocytes expressing telomerase repopulate the liver in homeostasis and injury. Nature. 2018;556:244–248. doi: 10.1038/s41586-018-0004-7. [DOI] [PMC free article] [PubMed] [Google Scholar]
- 60.Font-Burgada J, et al. Hybrid Periportal Hepatocytes Regenerate the Injured Liver without Giving Rise to Cancer. Cell. 2015;162:766–779. doi: 10.1016/j.cell.2015.07.026. [DOI] [PMC free article] [PubMed] [Google Scholar]
- 61.Huch M, Dolle L. The plastic cellular states of liver cells: Are EpCAM and Lgr5 fit for purpose? Hepatology. 2016;64:652–662. doi: 10.1002/hep.28469. [DOI] [PMC free article] [PubMed] [Google Scholar]
- 62.Michalopoulos GK. The liver is a peculiar organ when it comes to stem cells. Am J Pathol. 2014;184:1263–1267. doi: 10.1016/j.ajpath.2014.02.020. [DOI] [PMC free article] [PubMed] [Google Scholar]
- 63.Forbes SJ, Rosenthal N. Preparing the ground for tissue regeneration: from mechanism to therapy. Nat Med. 2014;20:857–869. doi: 10.1038/nm.3653. [DOI] [PubMed] [Google Scholar]
- 64.Hall C, et al. Regulators of Cholangiocyte Proliferation. Gene Expr. 2017;17:155–171. doi: 10.3727/105221616X692568. [DOI] [PMC free article] [PubMed] [Google Scholar]
- 65.Lazaridis KN, LaRusso NF. The Cholangiopathies. Mayo Clin Proc. 2015;90:791–800. doi: 10.1016/j.mayocp.2015.03.017. [DOI] [PMC free article] [PubMed] [Google Scholar]
- 66.Tanaka EM, Reddien PW. The cellular basis for animal regeneration. Developmental cell. 2011;21:172–185. doi: 10.1016/j.devcel.2011.06.016. [DOI] [PMC free article] [PubMed] [Google Scholar]
- 67.Jin SG, et al. 5-Hydroxymethylcytosine is strongly depleted in human cancers but its levels do not correlate with IDH1 mutations. Cancer research. 2011;71:7360–7365. doi: 10.1158/0008-5472.CAN-11-2023. [DOI] [PMC free article] [PubMed] [Google Scholar]
- 68.Thomson JP, et al. Loss of Tet1-Associated 5-Hydroxymethylcytosine Is Concomitant with Aberrant Promoter Hypermethylation in Liver Cancer. Cancer research. 2016;76:3097–3108. doi: 10.1158/0008-5472.CAN-15-1910. [DOI] [PMC free article] [PubMed] [Google Scholar]
- 69.Kafer GR, et al. 5-Hydroxymethylcytosine Marks Sites of DNA Damage and Promotes Genome Stability. Cell reports. 2016;14:1283–1292. doi: 10.1016/j.celrep.2016.01.035. [DOI] [PubMed] [Google Scholar]
Associated Data
This section collects any data citations, data availability statements, or supplementary materials included in this article.


