

Abstract

Nitrogen-doped carbon quantum dots (NCQDs) were prepared from chitosan through a hydrothermal reaction. When ethanol precipitation was used as the purification method, a high product yield of 85.3% was obtained. A strong blue fluorescence emission with a high quantum yield (QY) of 6.6% was observed from the NCQD aqueous solution. Physical and chemical characteristics of the NCQDs were carefully investigated by transmission electron microscopy (TEM), X-ray diffraction (XRD), Fourier transform infrared spectra (FTIR), Raman spectra, X-ray photoelectron spectroscopy (XPS), and transient fluorescence spectra. Experimental results showed that diameters of the NCQDs were in the range of 2–10 nm. The carbon quantum dots possess good water dispersibility and precipitation by ethanol. When used for metal ion detection, the detection limit of the NCQDs for Fe3+ was as low as 1.57 μM. This work proposed a facile method to synthesize NCQDs from chitosan with high yield and demonstrated that carbon quantum dots derived from chitosan were promising for ion detection.
1. Introduction
Carbon quantum dots (CQDs) have received much attention due to their extraordinary properties, including excellent biocompatibility, low cytotoxicity, good cell permeability, and simple synthetic routes.1,2 As a new class of fluorescent carbon nanomaterials, CQDs have potential applications in multiple scientific fields, such as bioimaging, drug delivery, catalysts, energy conversion devices, optoelectronics, detection of metal ions, and so forth.3−6 Generally, synthetic routes of the CQDs could be classified into top-down and bottom-up approaches.7 The top-down methods refer to processes involving cutting larger carbon structures into smaller pieces, including chemical oxidation, electrochemical synthesis, arc-discharge and laser-ablation, and so on.2 In these processes, the CQDs are formed from macroscopic carbon materials such as graphite, active carbon, graphene oxide, carbon nanotubes, coal, carbonized waste carbon paper, and biomass.7−9 By contrast, the bottom-up approaches refer to synthesize CQDs from organic molecular precursors using specific synthetic means such as microwave irradiation, hydrothermal treatments, ultra-sonication, and thermal combustion.7 To get high quality CQDs, usually, expensive starting materials, or high reaction temperature, or further complex surface-passivation is needed, hindering its large-scale commercialization. Therefore, exploring simple, cheap and environmentally friendly way to synthesize CQDs is of great importance.
It is widely accepted that hydrothermal carbonization is a green, sustainable and facile method for synthesizing CQDs.2,7 Great efforts have been made to synthesize CQDs by hydrothermal method using biomass.10−14 These biomass-derived precursors are considered to be the most promising staring materials for CQDs because of its low cost, environmental friendliness, abundance and varieties of heteroatom doping.15−19 Chitosan is the second most abundant natural polymer that exists extensively in the shell of crustaceans. This kind of special macromolecule has significant applications in the biomaterial fields owing to its nontoxicity and biocompatibility.20,21 Previously, chitosan had been used to synthesize nitrogen-doped carbon dots (NCQDs) using the hydrothermal method under a mild reaction condition of 180 °C.11,22 Zhang et al. reported an approach to synthesize NCQDs from chitosan by carbonization at 300 °C, and quantum efficiency of the NCQDs was up to 4.34%.13 Nessim et al. proposed a method to synthesize NCQDs from chitosan using chemical vapor deposition, in which the obtained NCQDs exhibited a graphenelike structure.12 As is known to all, post-treatments such as high-speed centrifugation, dialysis, and freeze drying are often adopted in the purification process. These operations are usually time-consuming and complicated.23 To synthesize biomass-derived CQDs efficiently, it is important to simplify the purification process.
In this work, NCQDs were synthesized from chitosan by hydrothermal carbonization and purified via a simple ethanol precipitation process. The product yield of the NCQDs was as high as 85.3%, which was better than the previously reported scientific data on the yield of biomass-derived CQDs (Figure 1). Studies have shown that the NCQDs had a strong blue fluorescence emission with a high quantum yield (QY) of 6.6%, and the NCQDs exhibited excellent metal ion detection ability. This work might benefit for the applications of NCQDs on a large scale.
Figure 1.

Statistical product yields vs quantum yield of the recently reported biomass-derived CQDs from the science database.
2. Results and Discussion
2.1. Morphology and Chemical Composition
The morphology of the NCQDs is shown in Figure 2a. Clearly, the synthesized NCQDs were uniform in size and had a nearly spherical shape. The NCQDs had a narrow size distribution, and its diameters were in the range of 2–10 nm. The gaussian fitting curve (based on more than 100 particles) showed that the average size of the NCQDs was 6 nm, as shown in Figure 2b.
Figure 2.
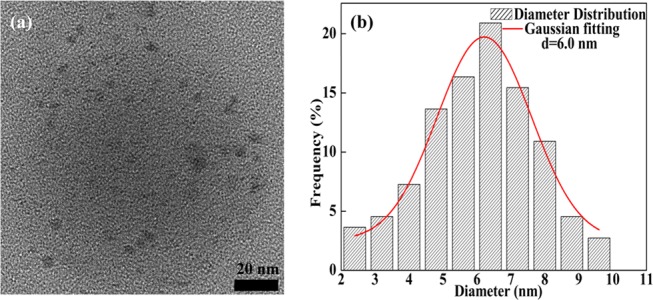
(a) HRTEM image of the NCQDs. (b) Statistical diameter distribution of the NCQDs from HRTEM images.
XRD patterns of the chitosan and the NCQDs are presented in Figure 3a. The chitosan sample showed diffraction peaks at 2θ = 20° and 11°, which were deemed as the characteristic crystallization peak and the amorphous peak, respectively.13 After hydrothermal carbonization, the crystalline peak of chitosan had diminished and a new peak at 2θ = 25° with a large full width at half maximum (FWHM) was observed. Disappearance of the characteristic crystalline peaks and appearance of a broad new diffraction peak revealed that chitosan had been completely carbonized and an amorphous carbon phase was formed.17
Figure 3.

(a) XRD patterns of the NCQDs and chitosan. (b) Fourier transform infrared spectra (FTIR) spectra of chitosan and NCQDs. (c) Raman spectra of the NCQDs.
FTIR spectra of the chitosan and the NCQDs are shown in Figure 3b. For the NCQDs, absorptions at 3500–3200, 1695–1570, and 1400 cm–1 were strengthened, indicating the existence of O–H/N–H, C=O, and N–H bands (attributed to amide groups) and COOH bands, respectively. Incidentally, these polar units were responsible for the good dispersity of the NCQDs in water. For the chitosan, the C–H stretching bands obviously disappeared or weakened at 2880 and 1130–1064 cm–1, illustrating the depolymerization of the chitosan chains and the decomposition of the pyranose rings during carbonization. The presence of C=O bands demonstrated that carboxyl or carbonyl moieties existed in the NCQDs, which was consistent with the XPS results.11,17
The Raman spectrum of the NCQDs showed a disordered (D) band at 1350 cm–1 and a crystalline (G) band at 1585 cm–1 (Figure 3c). The D band is generally due to amorphous sp3 carbon, and the G band belongs to the crystalline sp2 carbon of graphitic domains and the in-plane vibration of sp2 carbon-bonded atoms.24,25 The intensity ratio of D to G bands (ID/IG ratio) was 0.87, which indicated partially the existence of disorientation and stacking of graphene sheets in NCQDs.24
Further information on the composition of the NCQDs was obtained by X-ray photoelectron spectroscopy (XPS) as shown in Figure 4a. The survey scan performed in the 0–1350 eV binding energy range showed characteristic peaks of elements C, O, and N. The integral area ratio of C/O/N was about 9:4:1. By careful analysis of the C 1s peaks between 281 and 291 eV (Figure 4b), four peaks at 284.60, 285.40, 286.10, and 288.37 eV were found, which should be attributed to the C–C/C=C, C–N, C–O, and C=O bonds, respectively.26 It should be noted that the characteristic peak at around 284.60 eV was an indication of sp2 aromatic or graphitic structures.17 The appearance of C–O and C=O signals could confirm the existence of carbonyl and carboxyl groups in NCQDs.17 Moreover, the N 1s spectrum of the NCQDs (Figure 4c) showed predominant peaks at 399.80 and 400.60 eV, which were caused by the N–H and C=N interactions.13,27 The O 1s spectrum (Figure 4d) presented two peaks at 532.01 and 533.17 eV, which were attributed to C=O and C–O bonds, respectively.13 The XPS results suggested that there existed hydrophilic functional groups on the surface of the NCQDs. The hydrophilic property of the NCQDs could be further confirmed by the surface potential measurement, as shown in Figure S1.
Figure 4.

(a) Full scan of the XPS spectra, (b) C 1s XPS spectra, (c) N 1s XPS spectra, and (d) O 1s XPS spectra of as-prepared NCQDs.
According to the discussions above, the possible reaction route for the synthesis of the NCQDs was as follows: the interactions between the positive charges in the protonated amino groups of chitosan and the negative charges in the carboxylate groups of citric acid lead to the formation of a chitosan–citrate complex.28 Such a complex first forms a polymerlike structure and then is further carbonized to form NCQDs with carboxyl, hydroxyl, and amino groups on its surface. This synthetic mechanism (Figure 5) was similar to that in a previous report.29 It should be emphasized that the NCQD powder could be well dispersed in aqueous solutions (>40 mg/mL). When ethanol was added to the NCQD solution, the intermolecular hydrogen bond between NCQDs and water was destroyed, and the −COOH and −NH2 groups on its surface formed a strong hydrogen bond. These features were beneficial for the precipitation and purification of the NCQDs, leading to the final high product yield of 85.3%. It should be noted that such a productivity was much higher than those CQDs obtained from the traditional hydrothermal method (see Figure 1).
Figure 5.

Possible reaction route for the synthesis of the NCQDs.
2.2. Optical Properties of CQDs
UV–vis absorption of the NCQDs (Figure 6a) showed an absorption peak at 330 nm with a shoulder at around 240 nm, which were aroused from π–π* transition of the C=C bonds and n−π* transition of the C=O bonds.30 As shown in Figure 6b, the NCQDs displayed a maximum emission at 418 nm when excited with a 310 nm light. The FWHM was 108 nm, indicating a complex fluorescence emission from the NCQDs.29 The aqueous solution of the NCQDs showed strong blue light emission under UV irradiation. When exposed to the daylight, the solution changed back to translucent yellow (right inset, Figure 6b). As shown in Figure 6c, the NCQDs exhibited typical excitation-dependent photoluminescent behavior, which was similar to previous reports.31,32 Upon increasing the excitation wavelength from 270 to 490 nm, the emission peak red-shifted from 418 to 530 nm. Such behavior could be explained by the broad distribution of different emissive sites in the NCQDs.31
Figure 6.

(a) UV–vis absorption spectra. (b) fluorescence excitation (black line, λex = 310 nm) and emission spectra (red line, λem = 418 nm) of the NCQDs dispersed in water at room temperature. (inset: photograph of chitosan NCQDs under daylight and UV radiation). (c) Fluorescence emission spectra of the NCQDs obtained at different excitation wavelengths with a 20 nm increment from 270 to 490 nm. (d) Time-resolved PL decay and fitting curves for the as-prepared NCQDs.
In consideration of its strong luminous property,
the NCQD aqueous
solution (20 mg/mL) was utilized as ink for writing. The Chinese characters
“ ”
written from the ink emitted a strong fluorescence when excited with
UV lamps, as shown in Figure S2. When mixed
with poly(vinyl alcohol) (PVA) solution, the NCQDs/PVA composite film
precursor was obtained. Figure S3 shows
the fluorescence microscopy images of the PVA/NCQD film with daylight,
UV, blue, and green light excitation. The multicolor emission effect
of the composite film suggested that the NCQDs were promising for
electronic labels and biological imaging.
”
written from the ink emitted a strong fluorescence when excited with
UV lamps, as shown in Figure S2. When mixed
with poly(vinyl alcohol) (PVA) solution, the NCQDs/PVA composite film
precursor was obtained. Figure S3 shows
the fluorescence microscopy images of the PVA/NCQD film with daylight,
UV, blue, and green light excitation. The multicolor emission effect
of the composite film suggested that the NCQDs were promising for
electronic labels and biological imaging.
The maximum photoluminescence (PL) quantum yield was measured to be 6.6% when at 418 nm blue fluorescence was emitted. The average lifetime of the NCQDs was fitted to be 10.45 ns, as shown in Figure 6d. The lifetime of the NCQDs was longer than the previously reported values, suggesting that the NCQDs in this work were suitable for optoelectronic and biological applications.33
2.3. Detection of Metal Ions
Metal ions are widely distributed in the environmental and biological systems.34 Accurate detection of the metal ion content is of significant importance for the ecosystems and life systems.33,35 Different from other methods, the fluorescence detection method has unique advantages such as high sensitivity, simple operation, convenient monitoring, and fast reaction.33 To evaluate the selectivity of the NCQDs for metal ion detection, different metal ions, including Mg2+, Mn2+, Fe2+, Zn2+, Co2+, Ni2+, Cu2+, Fe3+, and Pb2+, were used as target ions. Detection results are shown in Figure 7a. Through analysis of the fluorescence intensity ratio I/I0 (where I and I0 are the fluorescence intensities at 418 nm after and before the addition of target ions), it was found that the NCQDs had a universal detecting ability for many ions. Specifically, the fluorescence intensity ratio for Fe3+ detection was the lowest with a value of 0.1, demonstrating the high detectivity of the NCQDs for Fe3+.
Figure 7.

Fluorescence response of NCQDs by metal ions: (a) Fluorescence quenching induced by different metal ions at a concentration of 1 mM (I0 and I are the fluorescence intensities of the NCQD aqueous dispersion without and with metal ions, respectively). (b) Fluorescence spectra of NCQDs at various concentrations of Fe3+ ranging from 0 to 1 mM. The excitation wavelength is fixed at 310 nm. (c) Linear relationship between fluorescence and Fe3+ concentration at 0–0.18 mM.
To further study the Fe3+ sensitivity of the NCQDs, Fe3+ ions with different concentrations were added into the NCQDs aqueous solution and the fluorescence intensities were measured. As shown in Figure 7b, the PL intensities decreased with the increase of Fe3+ concentration. This was easy to understand since the chelation between Fe3+ ions and phenolic hydroxy groups could reduce fluorescence emission from the NCQDs.8Figure 7c depicts the relationship of the fluorescence quenching value ΔI/I0 with the concentration of Fe3+, where ΔI = I0 – I. Obviously, the fluorescence quenching values presented an almost linear relationship in the range of 0–0.18 mM. The theoretical lower detection limit was calculated to be 1.57 μM (= 3σ/m, where σ is the standard deviation and m is the slope of the linear response region), which was much lower than most of the previously reported values as shown in Table 1. The results clearly suggested that the NCQDs in this contribution had high sensitivity in metal ion detection.
Table 1. Comparison of the Detection Limit of Fe3+ by Different Sensing Systems.
3. Conclusions
We have successfully synthetized NCQDs from chitosan. A simple ethanol precipitation procedure was adopted for purification. The product yield of the NCQDs was as high as 85.3%. The synthesized NCQDs possessed excellent water dispersity (>40 mg/mL) due to the hydrophilic functional groups on the surface. Spectral studies had shown that the NCQDs could reach a high quantum yield of 6.6%. The metal ion detection experiment illustrated that the NCQDs have universal ion detection capability and is especially suitable for Fe3+ monitoring. This contribution may be beneficial for the large-scale production and application of NCQDs.
4. Experimental Section
4.1. Materials
Chitosan powder (DD ≥ 95%, 100–200 mPa s) and lead(II) acetate trihydrate (A.R.) were purchased from Macklin Reagent Biochemical Co. Ltd. The other reagents were purchased from Shanghai Sinopharm Reagent Co. All reagents were of analytical grade and used without further purification.
4.2. Synthesis of CQDs
Chitosan powder was dissolved in 0.5 M citric acid (CA) solution to obtain 1 wt % chitosan aqueous solution. The chitosan aqueous solution and urea were added to a 25 mL Teflon container that was packed into a stainless steel autoclave. Then, the experimental installation was heated to 180 °C and kept for 10 h. After that, the autoclave was cooled to room temperature in the air. The obtained aqueous solution was first mixed with CH2Cl2, and then, the underlying aqueous solution was removed. Afterward, the aqueous solution was filtered with a 0.22 μm filter membrane and ethanol was employed for precipitation. The precipitate was centrifuged (3600 rpm), and the final product was dried at 60 °C for 6 h. The obtained solid powder was denoted CQDs. The details of the synthesis of NCQDs is illustrated in Scheme 1.
Scheme 1. Synthesis of NCQDs from the Hydrothermal Treatment of Chitosan Aqueous Solution.

4.3. Characterization
The morphology of the NCQDs was characterized by transmission electron microscopy (TEM; HT7700 EXALENS, operated at 200 kV). The size distribution of the NCQDs was calculated based on their TEM images. X-ray diffraction (XRD) patterns were carried on an XRD diffractometer (D8 Advance, Bruker, PANalytical) with Cu Kα radiation (λ = 0.15406 nm). Raman spectroscopy (Renishaw, 532 nm laser) was employed to characterize the structure of the samples. X-ray photoelectron spectroscopy (XPS) measurements were performed on a Thermo ESCALAB 250XI X-ray spectrometer (Thermo Scientific) with monochromatic A1 Kα (1486.7 eV). The samples were recorded on a TENSOR 27 FTIR spectrometer (Bruker, Germany) with KBr powder as the background, ranging from 4000 to 500 cm–1. The ζ-potential was measured on a Malvern Nano ZS instrument (Malvern). Optical absorption was measured on a UV-2550 (Shimadzu, Japan) spectrometer. Fluorescence spectra were recorded on an LS-55 fluorescence spectrometer (PE) with a slit width of 5 nm for excitation and emission. The excitation was increased by a 20 nm increment starting from 270 to 490 nm. All of the optical spectra were recorded with a quartz cuvette of 1 cm path length. Fluorescence decay curves and photoluminescence (PL) quantum yield (QY) of the as-prepared NCQDs were measured at room temperature using an Edinburgh FLSP 920 spectrometer (Edinburgh Instruments) equipped with an integrating sphere under 310 nm excitation.
4.4. Detection of Metal Ions
Different concentrations of Fe3+ aqueous solutions (0–0.20 mM, interval of 0.02 mM; 0.20–1.0 mM, interval of 0.2 mM) and other metal ion solutions (1.0 mM) were freshly prepared. To evaluate the sensitivity of the NCQDs to Fe3+, the Fe3+ solutions of different concentrations were mixed with 0.01 mg/mL NCQD aqueous dispersion at 1:1 volume ratio. After 5 min of equilibration, fluorescence from the mixed solutions was detected by a fluorescence spectrophotometer. Other metal ionic solutions were mixed and detected with the NCQDs in the same way. All of the experiments were performed at room temperature.
Acknowledgments
This work was financially supported by the National Natural Science Foundation of China (51703081), the Hubei Natural Science Foundation (2019CFB198), the Guiding Project of Education Department of Hubei Province (B2018259), the Discipline Cultivation Plan of Material Science and Engineering, Jianghan University (03100023).
Supporting Information Available
The Supporting Information is available free of charge at https://pubs.acs.org/doi/10.1021/acsomega.9b03318.
Surface charge profile of NCQDs obtained by a Malvern Nano instrument (Figure S1), NCQD ink (20 mg/mL) gave fluorescence words under a UV lamp at 365 and 254 nm (Figure S2), fluorescence microscopy images of PVA/NCQD film with (a) daylight, (b) UV, (c) blue, and (d) green light excitation (Figure S3) (PDF)
The authors declare no competing financial interest.
Supplementary Material
References
- Wang W.; Wang Z.; Liu J.; Peng Y.; Yu X.; Wang W.; Zhang Z.; Sun L. One-pot facile synthesis of graphene quantum dots from rice husks for Fe3+ sensing. Ind. Eng. Chem. Res. 2018, 57, 9144. 10.1021/acs.iecr.8b00913. [DOI] [Google Scholar]
- Bhandari S.; Monda D.; Nataraj S. K.; Balakrishna R. G. Biomolecule-derived quantum dots for sustainable optoelectronics. Nanoscale Adv. 2019, 1, 913. 10.1039/C8NA00332G. [DOI] [PMC free article] [PubMed] [Google Scholar]
- Xie C.; Fan T.; Wang A.; Chen S. Enhanced visible-light photocatalytic activity of a TiO2 membrane-assisted with N-doped carbon quantum dots and SiO2 opal photonic crystal. Ind. Eng. Chem. Res. 2019, 58, 120. 10.1021/acs.iecr.8b05101. [DOI] [Google Scholar]
- Hu S.; Zhang S.; Gao C.; Xu C.; Gao Q. A new selective fluorescent sensor for Fe3+ based on a pyrazoline derivative. Spectrochim. Acta, Part A 2013, 113, 325. 10.1016/j.saa.2013.04.118. [DOI] [PubMed] [Google Scholar]
- Wei Y.; Aydin Z.; Zhang Y.; Liu Z.; Guo M. A turn-on fluorescent sensor for imaging labile Fe3+ in live neuronal cells at subcellular resolution. ChemBioChem 2012, 13, 1569. 10.1002/cbic.201200202. [DOI] [PubMed] [Google Scholar]
- Wang Y.; Wang K.; Han Z.; Yin Z.; Zhou C.; Du F.; Zhou S.; Chen P.; Xie Z. High color rendering index trichromatic white and red LEDs prepared from silane-functionalized carbon dots. J. Mater. Chem. C 2017, 5, 9629. 10.1039/C7TC02297B. [DOI] [Google Scholar]
- Wang R.; Lu K.; Tang Z.; Xu Y. Recent progress in carbon quantum dots: synthesis, properties and applications in photocatalysis. J. Mater. Chem. A 2017, 5, 3717. 10.1039/C6TA08660H. [DOI] [Google Scholar]
- Wang D.; Wang L.; Dong X.; Shi Z.; Jin J. Chemically tailoring graphene oxides into fluorescent nanosheets for Fe3+ ion detection. Carbon 2012, 50, 2147. 10.1016/j.carbon.2012.01.021. [DOI] [Google Scholar]
- Yuan F.; Li S.; Fan Z.; Meng X.; Fan L.; Yang S. Shining carbon dots: synthesis and biomedical and optoelectronic applications. Nano Today 2016, 11, 565. 10.1016/j.nantod.2016.08.006. [DOI] [Google Scholar]
- Liang Q.; Ma W.; Shi Y.; Li Z.; Yang X. Easy synthesis of highly fluorescent carbon quantum dots from gelatin and their luminescent properties and applications. Carbon 2013, 60, 421. 10.1016/j.carbon.2013.04.055. [DOI] [Google Scholar]
- Yang Y.; Cui J.; Zheng M.; Hu C.; Tan S.; Xiao Y.; Yang Q.; Liu Y. One-step synthesis of amino-functionalized fluorescent carbon nanoparticles by hydrothermal carbonization of chitosan. Chem. Commun. 2012, 48, 380. 10.1039/C1CC15678K. [DOI] [PubMed] [Google Scholar]
- Kumar S.; Aziz S. T.; Girshevitz O.; Nessim G. D. One-step synthesis of N-doped graphene quantum dots from chitosan as a sole precursor using chemical vapor deposition. J. Phys. Chem. C 2018, 122, 2343. 10.1021/acs.jpcc.7b05494. [DOI] [Google Scholar]
- Liu X.; Pang J.; Xu F.; Zhang X. Simple approach to synthesize amino-functionalized carbon dots by carbonization of chitosan. Sci Rep. 2016, 6, 31100 10.1038/srep31100. [DOI] [PMC free article] [PubMed] [Google Scholar]
- Liu M. L.; Chen B. B.; Li C. M.; Huang C. Z. Carbon dots: synthesis, formation mechanism, fluorescence origin and sensing applications. Green Chem. 2019, 21, 449. 10.1039/C8GC02736F. [DOI] [Google Scholar]
- Zhao S.; Lan M.; Zhu X.; Xue H.; Ng T. W.; Meng X.; Lee C. S.; Wang P.; Zhang W. Green synthesis of bifunctional fluorescent carbon dots from garlic for cellular imaging and free radical scavenging. ACS Appl. Mater. Interfaces 2015, 7, 17054. 10.1021/acsami.5b03228. [DOI] [PubMed] [Google Scholar]
- Zhang M.; Wang W.; Yuan P.; Chi C.; Zhang J.; Zhou N. Synthesis of lanthanum doped carbon dots for detection of mercury ion, multi-color imaging of cells and tissue, and bacteriostasis. Chem. Eng. J. 2017, 330, 1137. 10.1016/j.cej.2017.07.166. [DOI] [Google Scholar]
- Liang Z.; Zeng L.; Cao X.; Wang Q.; Wang X.; Sun R. Sustainable carbon quantum dots from forestry and agricultural biomass with amplified photoluminescence by simple NH4OH passivation. J. Mater. Chem. C 2014, 2, 9760. 10.1039/C4TC01714E. [DOI] [Google Scholar]
- Yang S.; Sun J.; Li X.; Zhou W.; Wang Z.; He P.; Ding G.; Xie X.; Kang Z.; Jiang M. Large-scale fabrication of heavy doped carbon quantum dots with tunable-photoluminescence and sensitive fluorescence detection. J. Mater. Chem. A 2014, 2, 8660 10.1039/c4ta00860j. [DOI] [Google Scholar]
- Qu D.; Zheng M.; Du P.; Zhou Y.; Zhang L.; Li D.; Tan H.; Zhao Z.; Xie Z.; Sun Z. Highly luminescent S, N co-doped graphene quantum dots with broad visible absorption bands for visible light photocatalysts. Nanoscale 2013, 5, 12272. 10.1039/c3nr04402e. [DOI] [PubMed] [Google Scholar]
- Fang Y.; Zhang R.; Duan B.; Liu M.; Lu A.; Zhang L. Recyclable universal solvents for chitin to chitosan with various degrees of acetylation and construction of robust hydrogels. ACS Sustainable Chem. Eng. 2017, 5, 2725. 10.1021/acssuschemeng.6b03055. [DOI] [Google Scholar]
- Zhu K.; Duan J.; Guo J.; Wu S.; Lu A.; Zhang L. High-strength films consisted of oriented chitosan nanofibers for guiding cell growth. Biomacromolecules 2017, 18, 3904. 10.1021/acs.biomac.7b00936. [DOI] [PubMed] [Google Scholar]
- Zhao L.; Baccile N.; Gross S.; Zhang Y.; Wei W.; Sun Y.; Antonietti M.; Titirici M. Sustainable nitrogen-doped carbonaceous materials from biomass derivatives. Carbon 2010, 48, 3778. 10.1016/j.carbon.2010.06.040. [DOI] [Google Scholar]
- Zhang X.; Jiang M.; Niu N.; Chen Z.; Li S.; Liu S.; Li J. Natural-product-derived carbon dots: from natural products to functional materials. ChemSusChem 2018, 11, 11. 10.1002/cssc.201701847. [DOI] [PubMed] [Google Scholar]
- Sefidan S. B.; Eskandari H.; Shamkhali A. N. Rapid colorimetric flow injection sensing of hypochlorite by functionalized graphene quantum dots. Sens. Actuators, B 2018, 275, 339. 10.1016/j.snb.2018.08.023. [DOI] [Google Scholar]
- Li Y.; Zhao Y.; Cheng H.; Hu Y.; Shi G.; Dai L.; Qu L. Nitrogen-doped graphene quantum dots with oxygen-rich functional groups. J. Am. Chem. Soc. 2012, 134, 15. 10.1021/ja206030c. [DOI] [PubMed] [Google Scholar]
- Wang G.; Guo Q.; Chen D.; Liu Z.; Zheng X.; Xu A.; Yang S.; Ding G. Facile and highly effective synthesis of controllable lattice sulfur-doped graphene quantum dots via hydrothermal treatment of durian. ACS Appl. Mater. Interfaces 2018, 10, 5750. 10.1021/acsami.7b16002. [DOI] [PubMed] [Google Scholar]
- Liu X.; Jiang H.; Ye J.; Zhao C.; Gao S.; Wu C.; Li C.; Li J.; Wang X. Nitrogen-doped carbon quantum dot stabilized magnetic iron oxide nanoprobe for fluorescence, magnetic resonance, and computed tomography triple-modal in vivo bioimaging. Adv. Funct. Mater. 2016, 26, 8694. 10.1002/adfm.201603084. [DOI] [Google Scholar]
- Watthanaphanit A.; Supaphol P.; Furuike T.; Tokura S.; Tamura H.; Rujiravanit R. Novel chitosan-spotted alginate fibers from wet-spinning of alginate solutions containing emulsified chitosan-citrate complex and their characterization. Biomacromolecules 2009, 10, 320. 10.1021/bm801043d. [DOI] [PubMed] [Google Scholar]
- Zhu S.; Meng Q.; Wang L.; Zhang J.; Song Y.; Jin H.; Zhang K.; Sun H.; Wang H.; Yang B. Highly photoluminescent carbon dots for multicolor patterning, sensors, and bioimaging. Angew. Chem., Int. Ed. 2013, 52, 3953. 10.1002/anie.201300519. [DOI] [PubMed] [Google Scholar]
- Pan D.; Zhang J.; Li Z.; Wu M. Hydrothermal route for cutting graphene sheets into blue-luminescent graphene quantum dots. Adv. Mater. 2010, 22, 734. 10.1002/adma.200902825. [DOI] [PubMed] [Google Scholar]
- Sun Y.; Zhou B.; Lin Y.; Wang W.; Fernando K. A. S.; Pathak P.; Meziani M. J.; Harruff B. A.; Wang X.; Wang H.; Luo P. G.; Yang H.; Kose M. E.; Chen B.; Veca L. M.; Xie S. Quantum-sized carbon dots for bright and colorful photoluminescence. J. Am. Chem. Soc. 2006, 128, 7756. 10.1021/ja062677d. [DOI] [PubMed] [Google Scholar]
- Zheng M.; Liu S.; Li J.; Qu D.; Zhao H.; Guan X.; Hu X.; Xie Z.; Jing X.; Sun Z. Integrating oxaliplatin with highly luminescent carbon dots: an unprecedented theranostic agent for personalized medicine. Adv. Mater. 2014, 26, 3554. 10.1002/adma.201306192. [DOI] [PubMed] [Google Scholar]
- Wang L.; Zhou H. S. Green synthesis of luminescent nitrogen-doped carbon dots from milk and its imaging application. Anal. Chem. 2014, 86, 8902. 10.1021/ac502646x. [DOI] [PubMed] [Google Scholar]
- Luo X.; Lei X.; Cai N.; Xie X.; Xue Y.; Yu F. Removal of heavy metal ions from water by magnetic cellulose-based beads with embedded chemically modified magnetite nanoparticles and activated carbon. ACS Sustainable Chem. Eng. 2016, 4, 3960. 10.1021/acssuschemeng.6b00790. [DOI] [Google Scholar]
- Zheng M.; Tan H.; Xie Z.; Zhang L.; Jing X.; Sun Z. Fast response and high sensitivity europium metal organic framework fluorescent probe with chelating terpyridine sites for Fe3+. ACS Appl. Mater. Interfaces 2013, 5, 1078. 10.1021/am302862k. [DOI] [PubMed] [Google Scholar]
- Kagit R.; Yildirim M.; Ozay O.; Yesilot S.; Ozay H. Phosphazene based multicentered naked-eye fluorescent sensor with high selectivity for Fe3+ ions. Inorg. Chem. 2014, 53, 2144. 10.1021/ic402783x. [DOI] [PubMed] [Google Scholar]
- Ananthanarayanan A.; Wang X.; Routh P.; Sana B.; Lim S.; Kim D.; Lim K.; Li J.; Chen P. Facile synthesis of graphene quantum dots from 3D graphene and their application for Fe3+ Sensing. Adv. Funct. Mater. 2014, 24, 3021. 10.1002/adfm.201303441. [DOI] [Google Scholar]
- Ju J.; Chen W. Synthesis of highly fluorescent nitrogen-doped graphene quantum dots for sensitive, label-free detection of Fe (III) in aqueous media. Biosens. Bioelectron. 2014, 58, 219. 10.1016/j.bios.2014.02.061. [DOI] [PubMed] [Google Scholar]
Associated Data
This section collects any data citations, data availability statements, or supplementary materials included in this article.