Abstract
The development of covalent organic frameworks (COFs) with nodes and spacers, designed to maximize their functional properties, is a challenge. Triazines exhibit better electron affinity than benzene-based aromatic rings; therefore, structures based on 1,3,5-substituted triazine-centered nodes are more stable than those from 1,3,5-benzene-linked COFs. Compared to COFs prepared from flat, rigid sp2 carbon-linked triazine nodes, the O-linked flexible tripodal triazine-based COF demonstrates several unpredictable properties such as an increase in crystallinity and cavity size. In this study, the COF prepared from O-linked flexible 2,4,6-tris(p-formylphenoxy)-1,3,5-triazine serves as an excellent absorbent for removing methylene blue from water. Our results demonstrate that COF is highly stable in water and functions as a robust adsorbent. Its adsorption isotherm is consistent with the Langmuir model and its adsorption kinetics follows a pseudo-second order model. Moreover, the COF was characterized using elemental analysis, Fourier transform infrared spectroscopy, thermogravimetric analysis, scanning electron microscopy, solid-state ultraviolet–visible spectroscopy, and X-ray diffraction. It exhibited permanent porosity, a high specific surface area (279.5 m2·g–1), and was chemically and thermally stable. Photophysical studies revealed that the COF exhibits a low bandgap energy value of 3.07 eV, indicating its semiconducting nature.
1. Introduction
Covalent organic frameworks (COFs) are porous crystalline organic polymers developed using strong covalent bonds. COFs demonstrate excellent potential for various applications such as gas storage and separation,1,2 extraction and adsorption,3,4 and optoelectronics5 because of their well-defined crystalline structures, large specific surface areas, permanent porosities, and high stabilities.6,7 Moreover, COFs exhibit drug delivery,8 heterogeneous catalysis,9−11 photosensitization,12 and sensing properties.13
Typically, COFs are synthesized from rigid building blocks to ensure that their porous structures are maintained on activation and/or post-synthesis modification; however, the design and synthesis of COFs obtained from flexible monomers2,14 is challenging because of the high rotational freedom of the flexible units, which makes it considerably difficult to obtain highly ordered structures with good crystallinity.15 This is a regrettable situation because such flexibility would facilitate developing diverse COFs with a variety of functions. For example, COFs obtained from flexible monomers generally exhibit expandable lattices, making them excellent materials for removing organic dye pollutants such as methylene blue (MB) from water.4,16
2,4,6-Tris(p-formylphenoxy)-1,3,5-triazine (TPT-CHO) is an interesting trigonal molecule that has attracted considerable attention in the field of two-dimensional (2D) COF synthesis.3,4,9,11−15 TPT-CHO is highly flexible, lacks electrons, contains nitrogen atoms, and is highly basic, which is beneficial for its combination with guest metals and dye molecules.
Triazine-centered nodes have been applied more frequently for developing COFs than benzene-based nodes.2−5,9,10,12−16 Although the aromaticity indices (IA) for benzene and 1,3,5-triazine are calculated to be exactly the same (IA = 100),17 many studies have shown that structures obtained from triazine-centered nodes are more stable than those based on benzene-centered nodes.18−22 This was demonstrated by studying the electron affinities for a series of N-heterocyclic molecules,23 which revealed that a molecule will be a good acceptor when its electron affinity is high. The ability to accept electrons increased as the number of nitrogen atoms in the benzene ring increased.24 Thus, based on the electron affinities of benzene and 1,3,5-triazine, the N-heterocyclic triazine molecule showed superior electron-accepting properties.25,26
In a study of 49 COFs prepared by the combination of 11 spacers and five sulfono linkers, the diamine spacer 2,2′-dimethyl-[1,1′-biphenyl]-4,4′-diamine (DMBD) provided the largest surface area.27 The twisting angle, which is attributed to the two methyl groups, was observed to increase the space between stacking layers; however, the crystallinity of the resultant COF was not disturbed by this interruption.
Here, we report the design, synthesis, and characterization of a robust and highly crystalline TPT-DMBD-COF obtained from the triazine-based flexible linker TPT-CHO as the main building block. N2 adsorption isothermal analysis revealed that TPT-DMBD-COF has a large Brunauer–Emmett–Teller (BET) surface area of 279.5 m2·g–1. Thus, a detailed kinetic study on the adsorption of the organic dye MB was conducted to evaluate the properties of TPT-DMBD-COF as a pollutant absorbent.
2. Results and Discussion
2.1. Characterization of the COF
2.1.1. Fourier-Transform Infrared (FTIR) Results
FTIR spectroscopy was used to characterize the as-prepared COF. The clear band at 1703 cm–1 in the IR spectrum of TPT-CHO corresponds to the C=O stretching vibration. The sharp bands in the 3207–3466 cm–1 range in the spectrum of DMBD are related to the −NH2 groups of the diamine moieties. In the spectrum of TPT-DMBD-COF, the N–H stretching bands from 3207 to 3466 cm–1 disappeared and the typical C=O stretching band at 1703 cm–1 practically vanished, indicating the consumption of the aldehyde and amino groups of the monomers. Furthermore, the resulting characteristic C=N stretching band (1621 cm–1) reveals the successful formation of a macromolecular polymer linked by imine groups (Figure 1). These observations are in good agreement with the corresponding values for COF materials reported in the literature.28−30 In summary, FTIR results indicate that a highly polymerized COF was successfully prepared via condensation.
Figure 1.
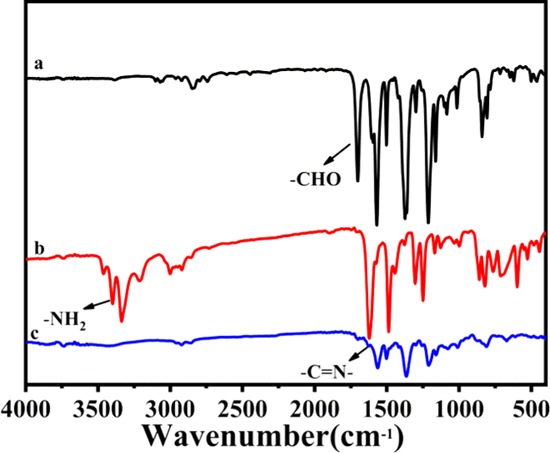
FT-IR spectra of (a) trialdehyde monomer TPT-CHO, (b) diamine linker DMBD, and (c) TPT-DMBD-COF.
2.1.2. Powder X-Ray Diffraction (PXRD) Analysis
The exact structure of the material obtained was determined by theoretical simulation and PXRD experiments. As shown in Figure 2a, the PXRD pattern of the COF contains a number of different diffraction peaks. The primary diffraction peak for the (100) facet was observed at 2.28°, and the other clearly visible peaks at 3.96, 4.55, 6.00, and 7.92° are attributed to the (110), (200), (210), and (220) facets, respectively. The sharp diffraction peaks in the PXRD pattern of the as-prepared COF demonstrate the material’s excellent crystallinity.
Figure 2.
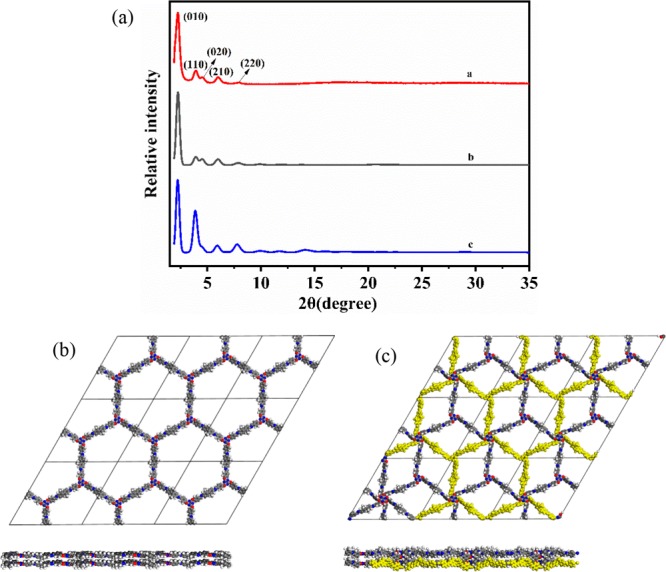
(a) Experimental (red) a, predicted AA stacking (gray) b, and AB stacking (blue) c PXRD patterns of TPT-DMBD-COF. (b) Views of the AA stacking structure along c and b axes. (c) Views of the AB stacking structure along c and b axes.
The crystal structure was then simulated using Materials Studio software, and the results showed that the experimental pattern was consistent with the simulated pattern based on an eclipsed stacking (AA) structure (Figure 2b). Pawley refinement produced unit cell parameters of a = b = 45.09 Å; c = 4.35 Å; α = β = 90°; and γ = 120°, with RP = 3.53% and RWP = 4.98%, which is consistent with the observed pattern. The intensities of the diffraction peaks for the COF are considerably strong, and the experimental model is less affected by the baseline. Moreover, we considered a staggered stacking (AB) model (Figure 2c); however, the simulated PXRD pattern for AB stacking (Figure 2a, blue line) did not match the experimental results.
2.1.3. Solvent Stability
To achieve a wide range of applications, the stability of COF in solution must be evaluated. Hence, as-prepared TPT-DMBD-COF samples were placed in various solutions for 24 h including an aqueous solution of HCl at pH = 1, boiling water, an aqueous NaOH solution at pH = 13, dimethylformamide (DMF), MeOH, and acetone. The stability in various solutions was verified by PXRD and FTIR spectroscopy. The X-ray diffraction (XRD) patterns (Figure S2) show that its crystallinity in each solution remains basically the same. Moreover, the FTIR spectra (Figure S3) show that the intensity and position of each characteristic peak are basically the same, and these results indicate that it can be stably present in various solutions.
2.1.4. BET Surface Area
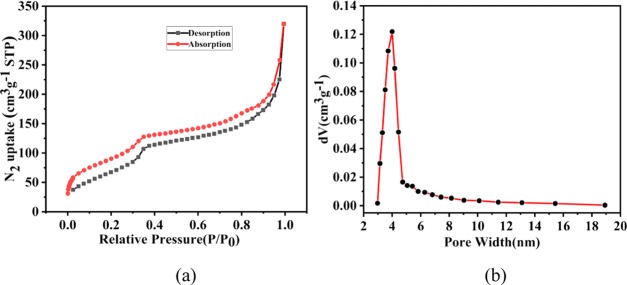
To evaluate the porosity of TPT-DMBD-COF, N2 adsorption–desorption experiment was performed (Figure 3). The adsorption curve of the COF presents a typical type-IV isotherm with a rapid uptake at a relatively low pressure of P/P0 < 0.1, followed by a second step in the P/P0 range of 0.05–0.20, indicating that the COF was a mesoporous material. The isotherm angle in the P/P0 range of 0.8–1.0 confirms the presence of textured mesopores, which is the result of COF crystal aggregation. Based on the N2 adsorption branch, the BET specific surface area was calculated to be 279.5 m2·g–1. The total pore volume of the COF was calculated to be 0.50 cm3·g–1 when P/P0 = 1.
Figure 3.
(a) N2 absorption–desorption isotherms of TPT-DMBD-COF and (b) pore size distribution plot.
The specific surface area and pore size distribution of COF have considerable influences on the adsorption. With a large specific surface area, relatively more adsorption sites would be expected. This could benefit the adsorption crucially. Furthermore, if the pore size of the material is too small, e.g., if there are only micropores, then the adsorbed molecules may be too large to enter the adsorbent, and adsorption sites inside the adsorbent cannot be completely utilized. Here, we studied the specific surface area and pore size of TPT-DMBD-COF in detail. Figure 3a shows an adsorption isotherm of the COF at 77 K. Figure 3b is the pore size distribution plot, as it can be seen, the largest distribution peak is located at the pore width of 4 nm, which is consistent with the measurement of modeling COF structure on hexagonal cell. The pore size distribution plot shows that the COF contains numerous mesopores and macropores, which could ensure a large number of adsorption sites. Meanwhile, the maximum size of the MB molecules (14.47 Å) (Figure 4) is much smaller than the sizes of these pores. They can thus enter the interior of the TPT-DMBD-COF through these pores and be adsorbed on sites within the pore structure. Therefore, a relatively high specific surface area and abundant pore structure are important factors for TPT-DMBD-COF as a robust adsorbent.
Figure 4.
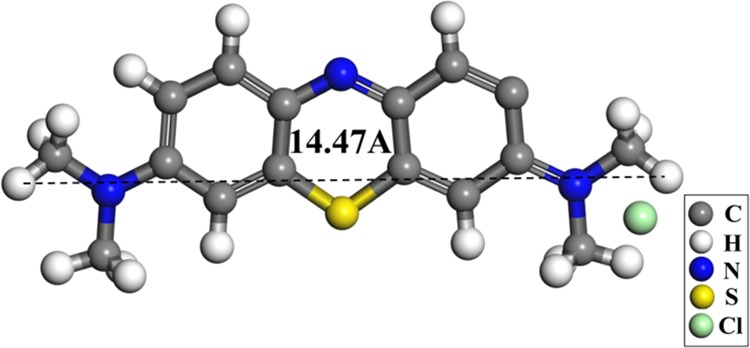
Modeling illustration of methylene blue molecule size.
2.1.5. Scanning Electron Microscopy (SEM) Morphology Study
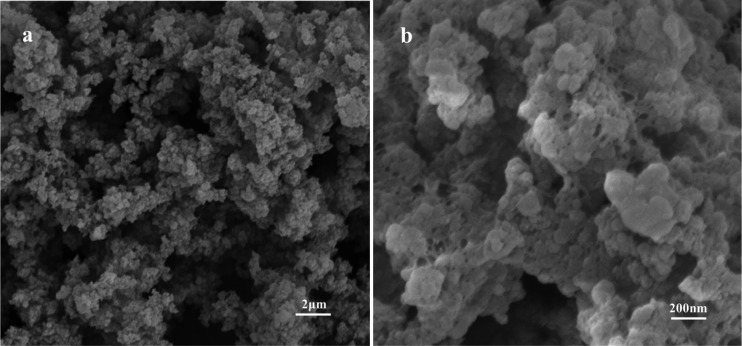
SEM images of TPT-DMBD-COF are shown in Figure 5. The material exhibits a uniformly distributed and loose block morphology. The SEM image with a 2 μm scale plate, shows a random-shaped aggregation composed of many macroscopic tiny balls. Since each individual aggregated particle is difficult to distinguish with the naked eye, ζ-potentials (Figure S4) of the adsorbents and analytes dispersing in ultrapure water were performed to test the particle size distribution of the COF powder. The result indicates that the particle size of the COF powder before any adsorption is started at 700 nm and the largest distribution is located at 1000 nm.
Figure 5.
SEM images of TPT-DMBD-COF in the scale of 2 μm (a) and zoom in 200 nm (b).
2.1.6. Thermal Properties
Figure S5 shows the thermogravimetric analysis (TGA) curve of the COF material. The low mass loss during heating to 100 °C is primarily attributed to the evaporation of residual solvent molecules from the surface and channels of the COF. As the temperature continues to increase to 400 °C, significant mass loss occurs because of the collapse of the macromolecular rings and decomposition of C–O–C and C=N bonds. However, the weight loss remains within 50% up to 800 °C; thus, TGA revealed that the prepared COF has good thermal stability, enabling its practical applications in high-temperature environments.
TPT-DMBD-COF was calcined at 100, 200, 300, and 400 °C, and PXRD was measured at each step (Figure 6). The PXRD patterns at 100, 200, and 300 °C were the same as those at room temperature; however, the PXRD pattern at 400 °C was considerably altered and exhibited an amorphous shape, thus confirming that the structure had changed. These results are consistent with previous TGA test results, further demonstrating the material’s thermal stability.
Figure 6.
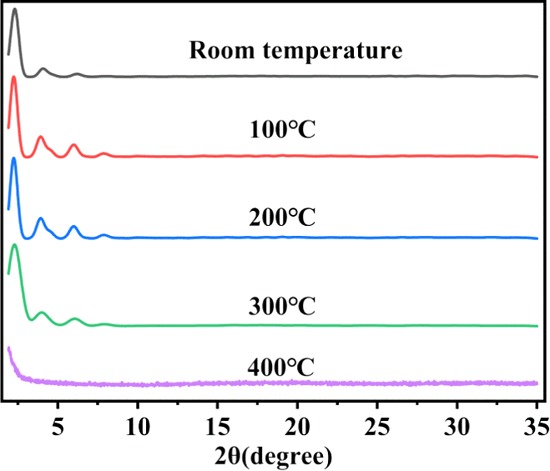
Experimental PXRD patterns of TPT-DMBD-COF calcined at different temperatures.
2.1.7. Diffuse Reflectance Spectroscopy
The electronic properties of TPT-DMBD-COF were investigated using solid-state UV–vis spectroscopy and the results were compared with those of the parent components. The monomers TPT-CHO and DMBD present absorption bands at 220–280 and 250–330 nm, respectively (Figure 7), whereas the COF exhibited broader absorption bands at 250–400 nm, which were redshifted compared to those of the parent monomers. This is attributed to the formation of macromolecular rings, which increases the conjugation of the system and causes the maximum absorption wavelength to redshift. Thus, TPT-DMBD-COF exhibited strong absorption and was a highly efficient triazine-based UV absorber.
Figure 7.
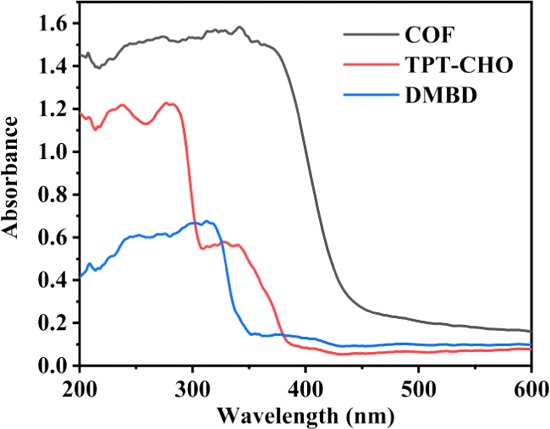
Solid-state UV–vis spectra for COF, TPT-CHO, and DMBD.
Furthermore, the bandgap value for TPT-DMBD-COF was calculated from the optical diffuse reflectance spectrum. The absorption (F = α/S) values were calculated from the reflectance data using the Kubelka–Munk function
where α is the absorption, S is the scattering coefficient, and R is the reflectance of an infinitely thick layer at a given wavelength. Note that Eg is defined as the intersection point of the energy axis and a line extrapolated from the linear portion. Interestingly, TPT-DMBD-COF exhibits a low Eg value of 3.07 eV, which clearly indicates the semiconducting properties of the material (Figure S6). This bandgap value is lower than those reported for a triazine-based COF constructed by boroxine linkages (3.6 eV) and the IRMOF series of COFs (∼3.73 eV).31−33
2.2. Organic Dye Removal
2.2.1. Standard Curve
A standard solution of MB was analyzed using a single-wavelength method, and the maximum absorption wavelength of MB was found to be 664 nm. Subsequently, standard solutions with concentrations of 1.0, 2.0, 3.0, 4.0, and 5.0 mg·L–1 were analyzed using UV–vis spectrophotometry to prepare a curve and derive the curve equation. Moreover, the measured data were linearly simulated by the least squares method to obtain a standard curve and a fitting equation for subsequent dye solution concentration determination (Figure S7).
2.2.2. Adsorption Kinetics
First, 2 mg samples of TPT-DMBD-COF were added to 5 mL MB solutions (pH 6.5, unadjusted) at room temperature with an initial concentration of 5 mg·L–1. The solutions were stirred at 150 rpm for 2, 5, 10, 20, 30, 40, 50, 60, 70, 80, and 90 min, and the adsorbent was removed using a 0.22 μm microfiltration membrane. Then, the concentrations of the MB remaining in the solutions were measured. The adsorption kinetics curve for MB was obtained by analyzing the adsorption capacity qt (mg·g–1) of the COF for MB at time t using eq 1.
| 1 |
In this equation, Co and Ct are the initial and equilibrium concentrations (mg·L–1), respectively, V is the volume (L) of the added MB solution, and M is the mass of COF (g).
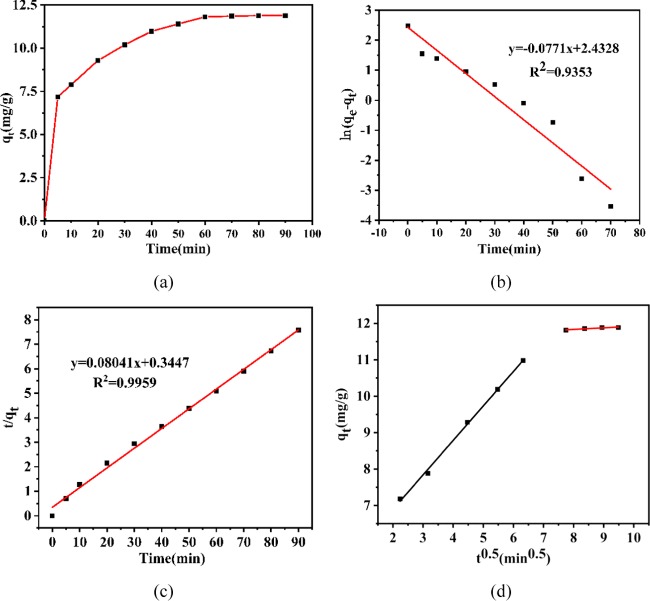
Several kinetic models, such as pseudo-first order, pseudo-second order, and intra-particle diffusion models, were applied for interpreting the kinetic nature of the adsorption process. The appropriate kinetic model was selected with reference to linear equations, the slope, and R2 values (Figure 8).
Figure 8.
(a) Effects of contact time on the adsorption of MB by COF, (b) pseudo-first order kinetics, (c) pseudo-second order kinetics, and (d) intra-particle diffusion plots.
For the pseudo-first order model, the curve of ln(qe – qt) versus t was prepared, and the linear equation was defined as eq 2.
| 2 |
For the pseudo-second order model, the curve of t/qt versus t was prepared, and the linear equation was defined as eq 3.
| 3 |
For the intra-particle diffusion model, the curve of qt versus t1/2 was prepared, and the linear equation was defined as eq 4.
| 4 |
In these equations, qe (mg·g–1) is the amount of adsorption at equilibrium and qt (mg·g–1) is the amount of adsorption at time t. K1 (min–1), K2 (g·mg–1 min–1), and Ki (mg·g–1 min–1/2) are the adsorption rate constants for the pseudo-first order, pseudo-second order, and intra-particle diffusion models, respectively. Moreover, C provides an intercept related to boundary thickness, and the correlation parameters were calculated for these models. The results are presented in Table 1.
Table 1. Kinetic Parameters in the Removal of MB by COF Absorbents.
| models | parameters | TPT-DMBD-COF |
|---|---|---|
| pseudo-first order | K1 (min–1) | 0.0771 |
| R2 | 0.9353 | |
| pseudo-second order | K2 (g mg–1 min–1) | 0.001178 |
| qexp (mg·g–1) | 11.86 | |
| qcal (mg·g–1) | 11.72 | |
| R2 | 0.9959 | |
| intra-particle diffusion | Ki1 (mg·g–1 min–1/2) | 0.9475 |
| Ki2 (mg·g–1 min–1/2) | 0.04332 | |
| C1 (mg·g–1) | 4.999 | |
| C2 (mg·g–1) | 11.48 | |
| R12 | 0.9974 | |
| R22 | 0.9896 |
To optimize the reaction time, the removal of MB was studied at different times in the range of 10–90 min. Figure 8a shows that the adsorption considerably increases within the first 10 min, and the adsorption rate rapidly changes. This indicates that this stage primarily involves surface adsorption. Note that the surface layer was gradually saturated and the dye molecules began to diffuse into the pores through the material’s surface and the adsorption rate gradually decreased. Interestingly, the maximum adsorption of MB was observed after 60 min, which is when equilibrium is reached. The pseudo-first order kinetic model (Figure 8b), based on adsorption capacity, assumes that dye molecules reaching the surface of the adsorbent proceed by a diffusion-controlled mechanism and that only one type of binding site is available on the adsorbent’s surface. The pseudo-second order kinetic model (Figure 8c) is based on the assumption that the adsorption rate is controlled by chemisorption, including electron transfer and sharing between the adsorbent and the adsorbent. Moreover, there are two types of binding sites on the adsorbent surface. According to experimental results, the pseudo-second order kinetics has a higher correlation coefficient R2 (0.9959) than the pseudo-first order model. Furthermore, the actual measured value of qexp is highly matched to the theoretically predicted qcal, which indicates that chemisorption is involved in the initial stage of adsorption.
Adsorption kinetics is generally controlled by different mechanisms. The most important mechanism is the diffusion-controlled mechanism, although neither the pseudo-first order nor the pseudo-second order kinetic model expresses the diffusion mechanism. Therefore, to determine whether diffusion is the rate-limiting step for the adsorption process, we used the intra-particle diffusion model. Note that this model can provide relevant information at different stages of the adsorption process, and Figure 8d shows the linear fit of the experimental results. The figure shows that the fitted curve is clearly divided into two stages, indicating that the adsorption of MB by COF can be divided into two stages: film diffusion and intra-particle diffusion. The film’s diffusion is the diffusion of the dye molecules into the surface of the adsorbent in the solution system. At this stage, because the adsorbed molecules are less resistant, the adsorption rate is quicker and the slope corresponding to the first-stage curve in the figure is larger. Because the intra-particle diffusion occurs from the adsorbent’s surface to the inside and the diffusion resistance is large at this stage owing to the resistance of the inner pores and the cross-linking gap, the repulsion between the adsorbed dye molecules and the adsorption speed is relatively slow until finally the resistance and adsorption are equal and the adsorption is at an equilibrium. The fitting curve does not pass through the origin, which indicates that intra-particle diffusion is not a rate-controlling phase and film diffusion and intra-particle diffusion may simultaneously occur. The values of R12 and R2 are considerably close to 100%, indicating that the adsorption process has a high degree of fit to the intra-particle diffusion model.
2.2.3. Adsorption Isotherms
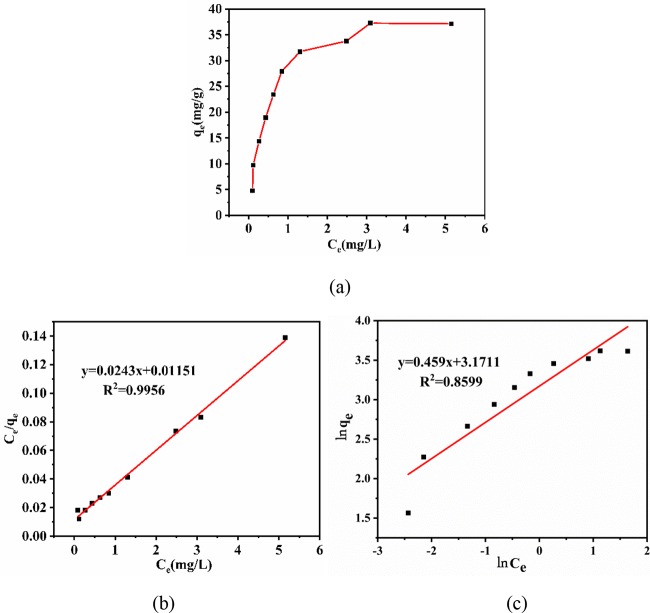
First, 2 mg samples of TPT-DMBD-COF were added to 5 mL aliquots of MB solution (pH 6.5, unadjusted) at room temperature at different initial concentrations (2–24 mg·L–1) and stirred at 150 rpm for 2 h. After the adsorption equilibrium was reached, the adsorbent was removed using a 0.22 μm microfiltration membrane and the MB concentration remaining in the solution was measured. The isothermal adsorption line for MB was obtained by analyzing the relationship between the equilibrium adsorption amount (qe) of COF and the equilibrium concentration (Ce) of the solution. To improve our understanding of the adsorption process, two commonly used models, i.e., Langmuir and Freundlich, were introduced to calculate the adsorption isotherms and adsorption equilibrium points. Both the linear Langmuir and Freundlich adsorption isotherm equations are expressed as eqs 5 and 6, respectively34
| 5 |
| 6 |
where Ce (mg·L–1) and qe (mg·g–1) are the equilibrium concentration of the MB and the adsorption capacity at equilibrium, respectively. Furthermore, KL (L·mg–1) and qmax (mg·g–1) are the Langmuir adsorption constant and the maximum saturated adsorption capacity, respectively. Note that KF (mg·L–1) is the Freundlich constant, and 1/n is a constant describing the adsorption density. If n >1, adsorption is favorable and n = 0 indicates irreversible adsorption.35
As shown in Figure 9a, with an increase in equilibrium concentration of MB in the solution, the adsorption capacity first rapidly increases and then tends to balance. Typically, the Langmuir adsorption isotherm model is used for single-layer adsorption, where most of the adsorption sites have the same affinity for dye molecules. Table 2 lists the fitted data. The correlation coefficient R2 shows that the value of the Langmuir model (0.9956) is considerably close to 1, and its single-layer adsorption capacity is 45.45 mg·g–1, which is remarkably close to the experimental value of qe. Compared to the Freundlich model (Figure 9b), the Langmuir adsorption isotherm model (Figure 9c) matches the adsorption characteristics of MB, i.e., the adsorption sites on the adsorbent surface have similar properties. Moreover, the adsorption on the COF surface is single-layer adsorption.
Figure 9.
(a) Adsorption isotherms for the adsorption of MB at 298 K, (b) Langmuir and (c) Freundlich isotherms for the adsorption of MB onto the COF.
Table 2. Isotherm Parameters in the Removal of MB at 298 K by COF Absorbents.
| models | parameters | TPT-DMBD-COF |
|---|---|---|
| Langmuir | qmax (mg·g–1) | 45.45 |
| KL (L·mg–1) | 1.684 | |
| R2 | 0.9956 | |
| Freundlich | KF (mg·L–1) | 24.50 |
| n | 2.200 | |
| R2 | 0.8599 |
2.2.4. pH
pH is a key factor for determining the adsorption capacity of an adsorbent because it affects the charge and adsorption site properties of the adsorbent surface, the nature of the water, and the structure of dye molecules.36,37 Thus, the effect of pH on MB adsorption was investigated. As the initial pH value increased in the range of 2–10, the adsorption amount showed a significant increasing trend, indicating that the pH of the dye solution is indeed a considerably important factor for adsorption (Figure 10). When the pH of the MB solution was low, the MB solution was acidic, and a large amount of H+ and MB (positively charged in the aqueous solution) competed with each other. Thus, under acidic conditions, the adsorption amount and rate of MB by the COF were relatively low. When the MB solution was alkaline (pH is close to 10), the adsorption amount reached a maximum of 12.31 mg·g–1. Thus, the results indicate that neutral or alkaline conditions favor MB adsorption by the COF because the surface groups of the COF are electronegative under neutral or alkaline conditions.
Figure 10.
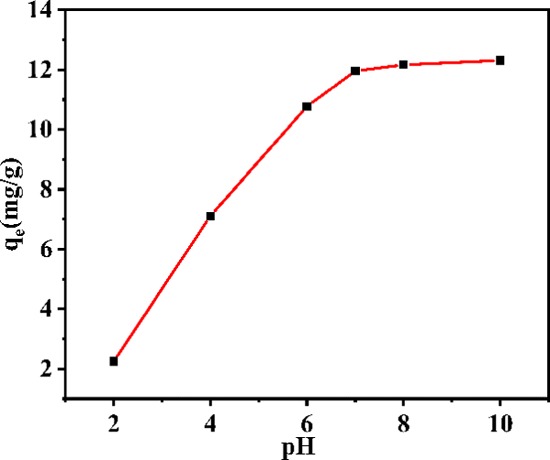
Effects of initial pH on the adsorption of MB.
2.2.5. Recyclability Test
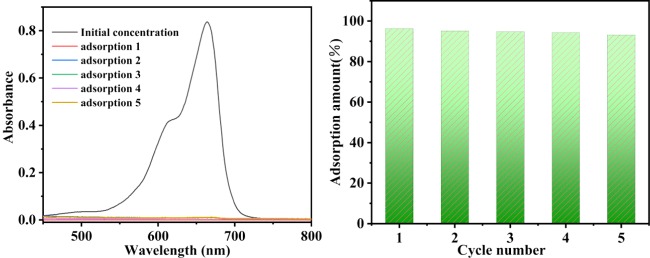
To evaluate the recycling performance of TPT-DMBD-COF, an experiment of MB adsorption–desorption was carried out using UV–vis spectroscopy. The COF material was added to an MB solution with an initial concentration of 5 mg·L–1. After adsorption, the supernatant was centrifuged. The concentration of the filtrate (remaining MB solution) was determined and the adsorption rate was calculated. The residue material (COF-MB composite) was ultrasonically shaken by adding a methanol solution containing 0.1 mM HCl. The solution then changed from colorless to blue, indicating that the adsorbed MB had been desorbed, and the COF material was again separated by centrifugation. After washing and drying the residue, the above experimental steps were repeated. Figure 11 shows that after five repetitions of these steps, the adsorption rate of the material exceeded 90%, indicating that the TPT-DMBD-COF can indeed adsorb and desorb MB, has excellent recyclability and sustainability and has great potential for use in dye adsorption.
Figure 11.
UV–vis spectra of MB adsorption recyclability for TPT-DMBD-COF and the bar graph for recycle times.
2.2.6. Adsorption Mechanism
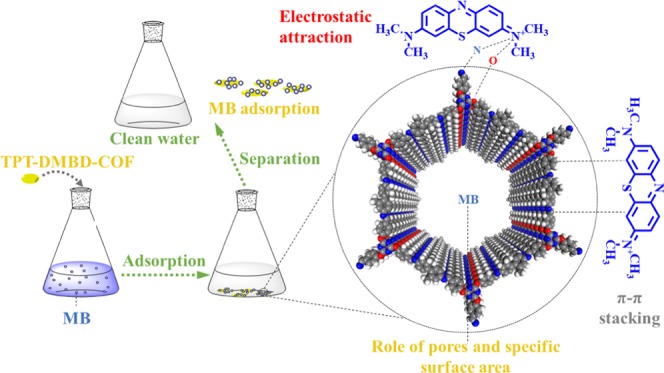
To clarify the adsorption mechanism, as shown in Figure 12, we studied the ζ-potential of TPT-DMBD-COF under different pH conditions. The ζ-potential decreased from 19 to −56 mV with an increase in pH. Moreover, the adsorption capacity increased with an increase in pH, reaching a maximum when the pH was 10. This indicates that there was an electrostatic attraction between the cationic MB dye molecule and TPT-DMBD-COF.
Figure 12.
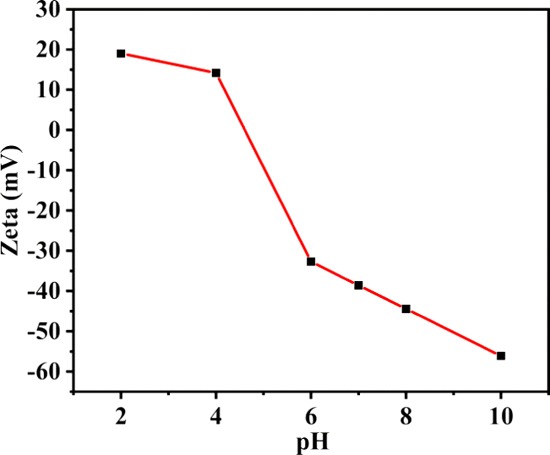
Plot of ζ-potential changes with pH.
We also performed infrared spectroscopy for MB, TPT-DMBD-COF, and the TPT-DMBD-COF-MB composite (Figure S9). Moreover, we determined that the positions and intensities of some absorption peaks changed after TPT-DMBD-COF adsorption of MB. The characteristic absorption peaks at 1566 cm–1, those of the aromatic rings at 819 cm–1, and those of the triazine rings were redshifted (compared to the original values of 1568 and 816 cm–1, respectively). Moreover, the intensities of those characteristic peaks also significantly weakened because the TPT-DMBD-COF adsorbent contains many aromatic rings that undergoes π–π stacking with the MB molecules during adsorption.
To further demonstrate that MB enters the TPT-DMBD-COF channels, we performed gas adsorption–desorption test on the adsorbed TPT-DMBD-COF-MB composite. Figure S10 shows the N2 adsorption and desorption curve of the TPT-DMBD-COF-MB composite. BET calculation shows that the specific surface area of the composite material is abruptly reduced to 11.18 m2 g–1. The reduction in the specific surface area of TPT-DMBD-COF indicates that MB has indeed entered the COF pores and occupied the cavity.
Based on these experiments, it can be clearly stated that adsorption is not simply a guest–host interaction based on appropriately sized cavities in the COF structure and that the chemical structure and adsorption characteristics of the adsorbent and MB play an important role in the process. Moreover, a possible mechanism to rationalize all of the observations is proposed. Because MB is a typical cationic dye with a planar structure held together by aromatic rings and the COF also has a large number of aromatic rings, π–π stacking is observed. Note that COF contains a large amount of electron-rich atoms such as N and O (containing a lone pair of electrons) and is regarded as an electron-donating Lewis base, whereas the cationic dye is regarded as a Lewis acid. According to the Lewis acid–base reaction principle, these N and O atoms can attract cationic dye molecules during the adsorption process. Moreover, the relatively large specific surface area and pore structure of the adsorbent can provide abundant adsorption sites. These three factors synergistically promote the adsorption of MB by COF.
3. Conclusions
In summary, this study reports the design and development of a new COF, namely, TPT-DMBD-COF, from the condensation of the O-linked, flexible, triazine-based aldehyde TPT-CHO and the rigid diamine DMBD. The sharp diffraction peaks in the PXRD pattern are consistent with theoretical simulations, confirming a highly ordered, AA stacked hexagonal structure in the synthesized COF. Moreover, this material has a large BET surface area of 279.5 m2·g–1. The high porosity of the 2D COF holds the promise of excellent performance for removing MB. Our results demonstrate that the COF is highly stable in water and functions as a robust adsorbent. Moreover, different kinetic models were investigated, and the pseudo-second order model was found to provide the best fit. Based on these kinetic studies and the organic structure of MB, we proposed a reasonable, detailed mechanism to explain the entire adsorption process. This study demonstrates the potential of a new COF absorbent for use in environmental pollution cleanup with properties such as high efficiency, eco-friendliness, ease of preparation, and absence of byproducts.
4. Experimental Section
4.1. Materials and Methods
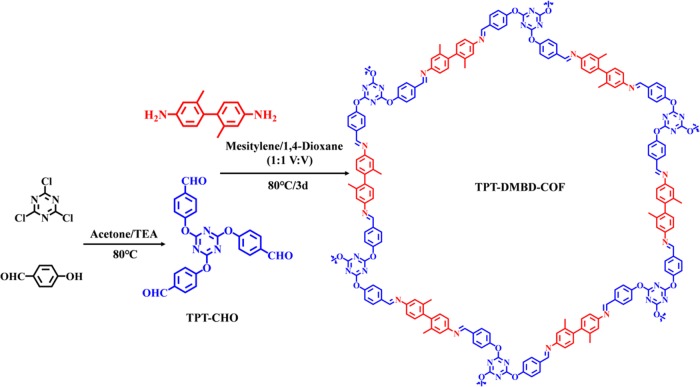
All reagents and solvents were of analytical grade and used as received without further purification. TPT-CHO was synthesized from cyanuric chloride and p-hydroxy benzaldehyde (Scheme 1). Column chromatography was performed using silica gel (Merck, Kieselgel 60, 200–300 mesh) with the indicated eluents. Fourier transform infrared (FTIR) spectra were recorded on KBr pellets in the range of 400–4000 cm–1 at 2 cm–1 resolution using a DIGILAB FTS-3000 spectrometer. ζ-Potentials of the adsorbent and analytes dispersing in ultrapure water were measured on a ζ-potential analyzer (Zetasizer Nano ZS, Malvern Panalytical, U.K.). Powder X-ray diffraction (PXRD) patterns were obtained on a Philips PW 1710-BASED diffractometer at 293 K. Ultraviolet–visible (UV–vis) absorption spectra were measured on a Varian Cary 100 UV–vis spectrophotometer equipped with an integrating sphere attachment and a standard BaSO4 plate as a reference. The concentrations of the dye solutions were determined using UV–vis spectrophotometry (model: 722, Shanghai Electronics and Instrument Analysis Co., Ltd.). Morphology analysis was performed using an ULTRA Plus scanning electron microscope (SEM, Germany). Thermogravimetric analysis (TGA) and differential thermal analysis of the samples were performed at a heating rate of 10 °C min–1 under N2 atmosphere with a NETZSCH Instruments thermal analyzer (STA449C). N2 adsorption–desorption isotherms were measured on an Autosorb iQ Station (QuantaChrome Instruments V 5.0) at 77 K, and the surface area was calculated by the BET method. AA stacking and AB stacking molecular models and Pawley refinement of TPT-DMBD-COF were performed using the Materials Studio software.
Scheme 1. Schematic Representation for the Synthesis of TPT-DMBD-COF.
4.2. Synthesis of TPT-DMBD-COF
First, TPT-CHO (88.4 mg, 0.2 mmol) and DMBD (63.7 mg, 0.3 mmol) were dissolved in mesitylene/dioxane (1:1, v/v, 4 mL) and sonicated at room temperature for about 10 min to obtain a uniform dispersion. Subsequently, acetic acid (AcOH, 6 M, 0.4 mL) was slowly added, and the resulting mixture was sealed in an air-isolated glass bottle and transferred to a 25 mL Teflon-lined stainless steel container for heating at 80 °C for 3 days. After the temperature of the container reached room temperature, the yellow precipitate was collected by centrifugation and washed with anhydrous N,N-dimethylformamide (DMF) and methanol until the washings were colorless to remove the trapped guest molecules and solvents. Finally, the COF was dried at 50 °C under vacuum for 12 h (Scheme 1). TPT-DMBD-COF was obtained as a yellow powder (92.1 mg, yield 65.2%). Anal. Calc. for (C90H66O6N12)n: C, 76.58; N, 11.91%. Results: C, 72.47; N, 15.31%. IR (KBr pellet, cm–1): 3403(s), 1697(s), 1621(s), 1562(s), 1501(s), 1368(m), 1210(s), 1162(s), 1007(s), 839(s), and 808(s).
Acknowledgments
The authors would like to thank the scientists from the Key Laboratory of Eco-functional Polymer Materials of the Ministry of Education for their support.
Supporting Information Available
The Supporting Information is available free of charge at https://pubs.acs.org/doi/10.1021/acsomega.9b03176.
Synthetic route approach to TPT-CHO; NMR spectrum; experimental PXRD patterns; FT-IR spectra; particle size distribution; TGA curve; solid-state optical diffuse-reflection spectrum; N2 absorption–desorption isotherms (PDF)
The authors declare no competing financial interest.
Supplementary Material
References
- Ma H.; Ren H.; Meng S.; Yan Z.; Zhao H.; Sun F.; Zhu G. A 3D microporous covalent organic framework with exceedingly high C3H8/CH4 and C2 hydrocarbon/CH4 selectivity. Chem. Commun. 2013, 49, 9773–9775. 10.1039/c3cc45217d. [DOI] [PubMed] [Google Scholar]
- Modak A.; Pramanik M.; Inagaki S.; Bhaumik A. A triazine functionalized porous organic polymer: excellent CO2 storage material and support for designing Pd nanocatalyst for C–C cross-coupling reactions. J. Mater. Chem. A 2014, 2, 11642. 10.1039/C4TA02150A. [DOI] [Google Scholar]
- Li Y.; Chen W.; Hao W.; Li Y.; Chen L. Covalent Organic Frameworks Constructed from Flexible Building Blocks with High Adsorption Capacity for Pollutants. ACS Appl. Nano Mater. 2018, 1, 4756–4761. 10.1021/acsanm.8b00983. [DOI] [Google Scholar]
- Konavarapu S. K.; Biradha K. Luminescent Triazene-Based Covalent Organic Frameworks Functionalized with Imine and Azine: N2 and H2 Sorption and Efficient Removal of Organic Dye Pollutants. Cryst. Growth Des. 2019, 19, 362–368. 10.1021/acs.cgd.8b01458. [DOI] [Google Scholar]
- Bessinger D.; Ascherl L.; Auras F.; Bein T. Spectrally Switchable Photodetection with Near-Infrared-Absorbing Covalent Organic Frameworks. J. Am. Chem. Soc. 2017, 139, 12035–12042. 10.1021/jacs.7b06599. [DOI] [PMC free article] [PubMed] [Google Scholar]
- Ding S. Y.; Wang W. Covalent organic frameworks (COFs): from design to applications. Chem. Soc. Rev. 2013, 42, 548–568. 10.1039/C2CS35072F. [DOI] [PubMed] [Google Scholar]
- Kandambeth S.; Dey K.; Banerjee R. Covalent Organic Frameworks: Chemistry beyond the Structure. J. Am. Chem. Soc. 2019, 141, 1807–1822. 10.1021/jacs.8b10334. [DOI] [PubMed] [Google Scholar]
- Mitra S.; Sasmal H. S.; Kundu T.; Kandambeth S.; Illath K.; Diaz D.; Banerjee R. Targeted Drug Delivery in Covalent Organic Nanosheets (CONs) via Sequential Postsynthetic Modification. J. Am. Chem. Soc. 2017, 139, 4513–4520. 10.1021/jacs.7b00925. [DOI] [PubMed] [Google Scholar]
- Mullangi D.; Nandi S.; Shalini S.; Sreedhala S.; Vinod C. P.; Vaidhyanathan R. Pd loaded amphiphilic COF as catalyst for multi-fold Heck reactions, C-C couplings and CO oxidation. Sci. Rep. 2015, 5, 10876 10.1038/srep10876. [DOI] [PMC free article] [PubMed] [Google Scholar]
- Puthiaraj P.; Pitchumani K. Triazine-based mesoporous covalent imine polymers as solid supports for copper-mediated Chan-Lam cross-coupling N-arylation reactions. Chem. – Eur. J. 2014, 20, 8761–8770. 10.1002/chem.201402365. [DOI] [PubMed] [Google Scholar]
- Wang X.; Han X.; Zhang J.; Wu X.; Liu Y.; Cui Y. Homochiral 2D Porous Covalent Organic Frameworks for Heterogeneous Asymmetric Catalysis. J. Am. Chem. Soc. 2016, 138, 12332–12335. 10.1021/jacs.6b07714. [DOI] [PubMed] [Google Scholar]
- Liu T.; Hu X.; Wang Y.; Meng L.; Zhou Y.; Zhang J.; Chen M.; Zhang X. Triazine-based covalent organic frameworks for photodynamic inactivation of bacteria as type-II photosensitizers. J. Photochem. Photobiol., B 2017, 175, 156–162. 10.1016/j.jphotobiol.2017.07.013. [DOI] [PubMed] [Google Scholar]
- Das P.; Mandal S. K. A dual-functionalized, luminescent and highly crystalline covalent organic framework: molecular decoding strategies for VOCs and ultrafast TNP sensing. J. Mater. Chem. A 2018, 6, 16246–16256. 10.1039/C8TA05070H. [DOI] [Google Scholar]
- Guo X.; Tian Y.; Zhang M.; Li Y.; Wen R.; Li X.; Li X.; Xue Y.; Ma L.; Xia C.; Li S. Mechanistic Insight into Hydrogen-Bond-Controlled Crystallinity and Adsorption Property of Covalent Organic Frameworks from Flexible Building Blocks. Chem. Mater. 2018, 30, 2299–2308. 10.1021/acs.chemmater.7b05121. [DOI] [Google Scholar]
- Xu L.; Ding S. Y.; Liu J.; Sun J.; Wang W.; Zheng Q. Y. Highly crystalline covalent organic frameworks from flexible building blocks. Chem. Commun. 2016, 52, 4706–4709. 10.1039/C6CC01171C. [DOI] [PubMed] [Google Scholar]
- Wang R. L.; Li D. P.; Wang L. J.; Zhang X.; Zhou Z. Y.; Mu J. L.; Su Z. M. The preparation of new covalent organic framework embedded with silver nanoparticles and its applications in degradation of organic pollutants from waste water. Dalton Trans. 2019, 48, 1051–1059. 10.1039/C8DT04458A. [DOI] [PubMed] [Google Scholar]
- Bird C. W. Heteroaromaticity, 5, a unified aromaticity index. Tetrahedron 1992, 48, 335–340. 10.1016/S0040-4020(01)88145-X. [DOI] [Google Scholar]
- Walker I. C.; Palmer M. H.; Ballard C. C. The electronic states of the azines. VI. 1,3,5-triazine, studied by VUV absorption, near-threshold electron energy-loss spectroscopy and ab initio multi-reference configuration interaction calculations. Chem. Phys. 1992, 167, 61–75. 10.1016/0301-0104(92)80023-O. [DOI] [Google Scholar]
- Byström K. The stabilization energy of 1,3,5-triazine derived from measurements of the enthalpies of combustion and sublimation. J. Chem. Thermodyn. 1982, 14, 865–870. 10.1016/0021-9614(82)90160-4. [DOI] [Google Scholar]
- Jetti R. K. R.; Nangia A.; Xue F.; Mak T. C. W. Polar host–guest assembly mediated by halogen··π interaction: inclusion complexes of 2,4,6-tris(4-halophenoxy)-1,3,5-triazine (halo = chloro, bromo) with trihalobenzene (halo = bromo, iodo). Chem. Commun. 2001, 919–920. 10.1039/b102150h. [DOI] [Google Scholar]
- Dereli Ö.; Bahçeli S.; Abbas A.; Naseer M. M. Quantum chemical investigations of a co-crystal of 1,3,5-tris(4-hydroxyphenyl)benzene and 2,4,6-trimethoxy-1,3,5-triazine. Monatsh. Chem. 2015, 146, 1473–1484. 10.1007/s00706-015-1413-z. [DOI] [Google Scholar]
- Ren S.; Dawson R.; Laybourn A.; Jiang J.-x.; Khimyak Y.; Adams D. J.; Cooper A. I. Functional conjugated microporous polymers: from 1,3,5-benzene to 1,3,5-triazine. Polym. Chem. 2012, 3, 928. 10.1039/c2py00585a. [DOI] [Google Scholar]
- Hajgató B.; Deleuze M. S.; Tozer D. J.; De Proft F. A benchmark theoretical study of the electron affinities of benzene and linear acenes. J. Chem. Phys. 2008, 129, 084308 10.1063/1.2967182. [DOI] [PubMed] [Google Scholar]
- Lipkind D.; Chickos J. S. An examination of the vaporization enthalpies and vapor pressures of pyrazine, pyrimidine, pyridazine, and 1,3,5-triazine. Struct. Chem. 2009, 20, 49–58. 10.1007/s11224-008-9389-5. [DOI] [Google Scholar]
- Pan Y.; Zhu W.; Xiao H. Design and selection of nitrogen-rich bridged di-1,3,5-triazine derivatives with high energy and reduced sensitivity. J. Mol. Model. 2012, 18, 3125–3138. 10.1007/s00894-011-1329-4. [DOI] [PubMed] [Google Scholar]
- Chu T.-Y.; Ho M.-H.; Chen J.-F.; Chen C. H. Ab initio molecular orbital study of 1,3,5-triazine derivatives for phosphorescent organic light emitting devices. Chem. Phys. Lett. 2005, 415, 137–140. 10.1016/j.cplett.2005.08.149. [DOI] [Google Scholar]
- Karak S.; Kumar S.; Pachfule P.; Banerjee R. Porosity Prediction through Hydrogen Bonding in Covalent Organic Frameworks. J. Am. Chem. Soc. 2018, 140, 5138–5145. 10.1021/jacs.7b13558. [DOI] [PubMed] [Google Scholar]
- Uribe-Romo F. J.; Doonan C. J.; Furukawa H.; Oisaki K.; Yaghi O. M. Crystalline covalent organic frameworks with hydrazone linkages. J. Am. Chem. Soc. 2011, 133, 11478–11481. 10.1021/ja204728y. [DOI] [PubMed] [Google Scholar]
- Shinde D. B.; Ostwal M.; Wang X.; Hengne A. M.; Liu Y.; Sheng G.; Huang K.-W.; Lai Z. Chlorine-functionalized keto-enamine-based covalent organic frameworks for CO2 separation and capture. CrystEngComm 2018, 20, 7621–7625. 10.1039/C8CE01397G. [DOI] [Google Scholar]
- Gottschling K.; Stegbauer L.; Savasci G.; Prisco N. A.; Berkson Z. J.; Ochsenfeld C.; Chmelka B. F.; Lotsch B. V. Molecular Insights into Carbon Dioxide Sorption in Hydrazone-Based Covalent Organic Frameworks with Tertiary Amine Moieties. Chem. Mater. 2019, 31, 1946–1955. 10.1021/acs.chemmater.8b04643. [DOI] [PMC free article] [PubMed] [Google Scholar]
- Lukose B.; Kuc A.; Frenzel J.; Heine T. On the reticular construction concept of covalent organic frameworks. Beilstein J. Nanotechnol. 2010, 1, 60–70. 10.3762/bjnano.1.8. [DOI] [PMC free article] [PubMed] [Google Scholar]
- Kuc A.; Enyashin A.; Seifert G. Metal-organic frameworks: structural, energetic, electronic, and mechanical properties. J. Phys. Chem. B 2007, 111, 8179–8186. 10.1021/jp072085x. [DOI] [PubMed] [Google Scholar]
- Li X.; Gao Q.; Aneesh J.; Xu H.-S.; Chen Z.; Tang W.; Liu C.; Shi X.; Adarsh K. V.; Lu Y.; Loh K. P. Molecular Engineering of Bandgaps in Covalent Organic Frameworks. Chem. Mater. 2018, 30, 5743–5749. 10.1021/acs.chemmater.8b02560. [DOI] [Google Scholar]
- El Saliby I.; Erdei L.; Kim J. H.; Shon H. K. Adsorption and photocatalytic degradation of methylene blue over hydrogen-titanate nanofibres produced by a peroxide method. Water Res. 2013, 47, 4115–4125. 10.1016/j.watres.2012.12.045. [DOI] [PubMed] [Google Scholar]
- Arica T. A.; Ayas E.; Arica M. Y. Magnetic MCM-41 silica particles grafted with poly(glycidylmethacrylate) brush: Modification and application for removal of direct dyes. Microporous Mesoporous Mater. 2017, 243, 164–175. 10.1016/j.micromeso.2017.02.011. [DOI] [Google Scholar]
- Ai L.; Zhang C.; Liao F.; Wang Y.; Li M.; Meng L.; Jiang J. Removal of methylene blue from aqueous solution with magnetite loaded multi-wall carbon nanotube: kinetic, isotherm and mechanism analysis. J. Hazard. Mater. 2011, 198, 282–290. 10.1016/j.jhazmat.2011.10.041. [DOI] [PubMed] [Google Scholar]
- Madrakian T.; Afkhami A.; Ahmadi M.; Bagheri H. Removal of some cationic dyes from aqueous solutions using magnetic-modified multi-walled carbon nanotubes. J. Hazard. Mater. 2011, 196, 109–114. 10.1016/j.jhazmat.2011.08.078. [DOI] [PubMed] [Google Scholar]
Associated Data
This section collects any data citations, data availability statements, or supplementary materials included in this article.


