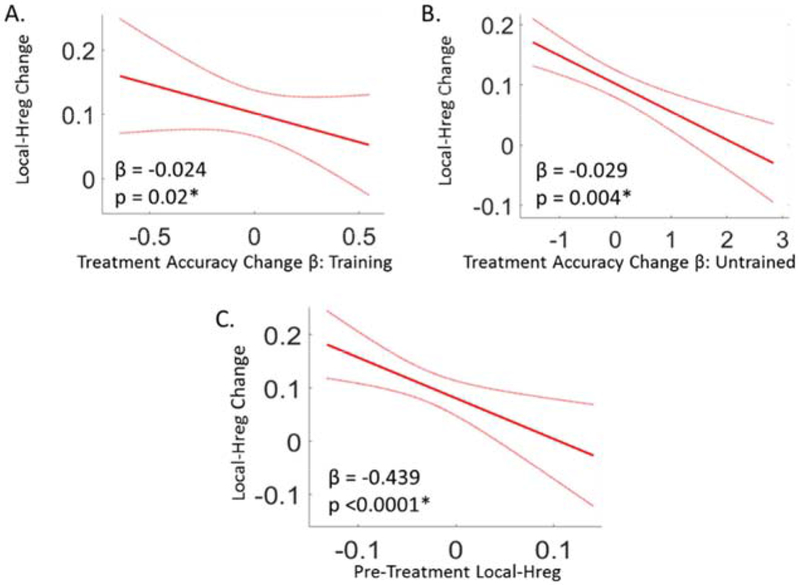
Figure 6: Analysis of the relationship between Local-Hreg changes and changes in spelling accuracy, within the left vOTC cluster identified in Analysis 1.
Overall, these results reveal that changes in Local-Hreg within the left vOTC region were tightly coupled to treatment-related spelling improvements. (Note: All Local-Hreg values are based on the Training items only). (A) The relationship between the pre to post-treatment changes in Local-Hreg for Training items (y-axis) and the pre to post-treatment Accuracy change β’s for Training items (x-axis). (B) The relationship between the pre to post-treatment change in Local-Hreg (y-axis) and the Accuracy Change βs (x-axis) for Untrained items. (C) The relationship between pre to post-treatment changes in Local-Hreg (y-axis) and pre-treatment Local-Hreg (x-axis). Figure Details: Red lines depict the β-estimate regression lines and red dotted lines depict the 95% confidence intervals. β estimates and p-values of these relationships are reported at the bottom of each plot, and obtained from an LME model. *Significant relationship at an alpha level of 0.05.

