Abstract
Purpose:
Transcranial focused ultrasound (FUS) is increasingly being explored to modulate neuronal activity. To target neuromodulation, researchers often localize the FUS beam onto the brain region(s) of interest using spatially tracked tools overlaid on pre-acquired images. Here, we quantify the accuracy of optically tracked image-guided FUS with magnetic resonance imaging (MRI) thermometry, evaluate sources of error, and demonstrate feasibility of these procedures to target the macaque somatosensory region.
Methods:
We developed an optically tracked FUS system capable of projecting the transducer focus onto a pre-acquired MRI volume. To measure the target registration error (TRE), we aimed the transducer focus at a desired target in a phantom under image guidance, heated the target while imaging with MR thermometry, and then calculated the TRE as the difference between the targeted and heated locations. Multiple targets were measured using either an unbiased or bias-corrected calibration. We then targeted the macaque S1 brain region, where displacement induced by the acoustic radiation force was measured using MR acoustic radiation force imaging (MR-ARFI).
Results:
All calibration methods enabled registration with TRE on the order of 3mm. Unbiased calibration resulted in an average TRE of 3.26 mm (min – max: 2.80 – 4.53 mm), which was not significantly changed by prospective bias correction (TRE of 3.05 mm; 2.06 – 3.81 mm, p=0.55). Restricting motion between the transducer and target and increasing the distance between tracked markers reduced the TRE to 2.43 mm (min-max: 0.79 – 3.88 mm). MR-ARFI images showed qualitatively similar shape and extent as projected beam profiles in a living non-human primate.
Conclusions:
Our study describes methods for image guidance of FUS neuromodulation and quantifies errors associated with this method in a large animal. The workflow is efficient enough for in vivo use, and we demonstrate transcranial MR-ARFI in vivo in macaques for the first time.
Keywords: focused ultrasound, ultrasound neuromodulation, optical tracking, image-guided therapy, neuromodulation
Introduction
Focused ultrasound (FUS) is a non-invasive technology with a growing number of therapeutic and neuroscientific applications. FUS uses geometrically focused transducers to make a spatially convergent acoustic field. With proper choice of parameters such as transducer power, wave frequency, and duty factor, FUS devices can achieve a variety of biological effects at the acoustic focus without affecting intervening tissue. Broadly, FUS can be applied in either destructive (e.g., thermal necrosis, mechanical liquefaction for tissue ablation) or non-destructive (e.g., neuromodulation, immune stimulation, drug delivery) modes [1–6]. Development of magnetic resonance imaging (MRI)-compatible array transducers has helped increase clinical feasibility of FUS therapy by offering image guidance for tissue-selective targeting, feedback via real-time MR thermometry, and immediate post-treatment assessment with contrast-enhanced MRI [7–13].
Neuromodulation is a non-destructive application of FUS that has garnered recent attention for its spatial selectivity and non-invasiveness compared to existing neuromodulation methods. FUS neuromodulation has been shown in numerous studies to stimulate and inhibit activities in motor circuits in mouse and rat brain [14–16]. Other FUS-based neuromodulation approaches include FUS-activated drugs, and opening of the blood-brain barrier (BBB) to deliver neuromodulatory agents or designer receptors [17–19]. Accuracy remains very important in FUS neuromodulation applications, but with the benefit of reduced acoustic energy and higher tolerance to off-target stimulation when compared to FUS ablation. These relaxed requirements and desire to use FUS neuromodulation in conscious animals has led researchers to explore image-guidance with pre-acquired images as a method to guide ultrasound. Yoo et al. have used optically tracked FUS to modulate human somatosensory and visual cortices, reporting elicited sensations and phosphene generation, respectively in response to acoustic pulses [20, 21]. Our group has shown changes in blood oxygen level dependent (BOLD) MRI when sonicating the macaque somatosensory cortex [22]. Wu et al. have recently characterized the use of optically tracked FUS for selective opening of the BBB [18].
Optical tracking is an established technique in image-guided surgery that enables projection of surgical tools into pre-acquired volumetric imaging data [23–25]. In passive optical tracking, surgical tools are rigidly attached to a set of reflective spheres that have a known, pre-defined geometric configuration. Near-infrared stereoscopic cameras record marker positions as the tool is manipulated, and using the known camera-camera distance and distances between reflective spheres, the 3D position and rotational attitude of the tracked bodies can be deduced. The tip of a tracked surgical probe is localized, or calibrated, by fixing it in a divot and pivoting the tool in a circular arc, resulting in an offset vector that can be applied in software to visualize the tool tip. An error of 0.2–0.4 mm is common for the offset vector on rigid tools calibrated in this manner [26, 27].
Real-time projection of the tool onto medical image volumes requires registration of the images to the physical anatomy of the subject. A common method for registration is point-based rigid registration, in which fiducial points visible in the acquired image volume (e.g., MRI, computed tomography (CT)) are localized in physical space by placing a calibrated pointer tip on each fiducial and measuring its position with the tracking system. A transform between the two coordinate systems is then computed, and is often termed the physical-to-image registration. Registration typically introduces additional error into the system due to compounding uncertainties in fiducial localization, physical non-rigidity or movement of the subject, and non-linear distortions in the image volume [28–30]. The error of primary concern is the target registration error (TRE), which is the difference between the projected location of a tracked point in image space and its actual location in the physical space of the patient.
In this paper, we evaluate the TRE of an optically-tracked FUS instrument guided with anatomical MR images. The increasing prevalence of optically tracked FUS neuromodulation motivates the present study, where we quantify the TRE when overlaying a measured acoustic beam on a pre-acquired MRI volume using optical tracking and demonstrate feasibility of using this system in vivo.
Methods
Materials
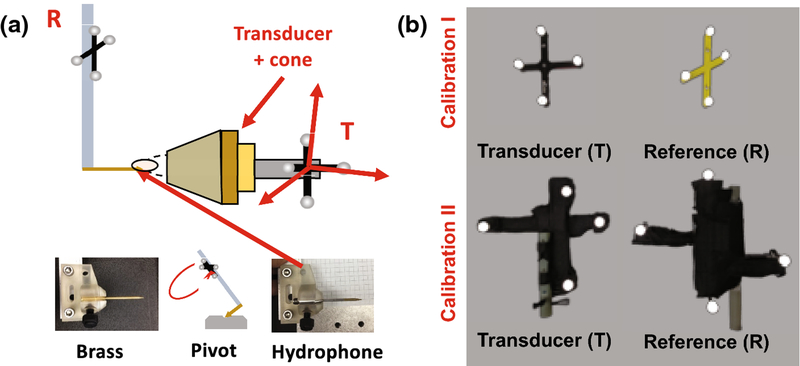
A spherically focused piezo ceramic single-element transducer was used for all experiments (H115MR, Sonic Concepts, Bothell, WA, USA). It has a geometric focus of 64mm and an opening diameter of 63.5 mm, and sonications were performed at its resonance peaks of 250kHz and 802kHz. A custom 3D-printed coupling cone with a 3-cm opening aperture held the transducer. Acoustic data were collected with a needle hydrophone (HNC 0400, Onda Corp., Sunnyvale, CA, USA). A 3D-printed housing adapted the hydrophone for secure mounting to a motion stage (Figure 1a). An NDI Polaris Vicra optical tracking system was used for all optical guidance (Northern Digital Inc., Waterloo, Ontario, CA), with two sets of rigid body trackers. In the first two rounds of calibration experiments, a small 3D-printed tracker and a metal tracker from NDI were used as the reference and target tracker, respectively (Figure 1b top). In the final experiment, two custom trackers were built with LEGO© (Denmark) parts to be MR-compatible and have larger intra-sphere distances (Figure 1b bottom). Rigid body files were created for each tracker configuration with the NDI 6D Architect software. Donut-shaped MR-visible fiducial markers were used for image registration (MM3003, IZI Medical Products). All MR scans were acquired with a 7T Philips Achieva human research MRI scanner (Philips Healthcare, Best, Netherlands), using a single-channel surface coil and threaded housing that attached to the transducer cone at the aperture. All phantom sonications were done in tissue-mimicking agarose phantoms (1% agarose, 4% graphite powder, attenuation ~0.6 dB/cm) [31].
Figure 1 –
(a) Setup used for optically-tracked calibration. The brass tip offset from rigid-body tracker R is measured using a standard pivot test, then replaced with the real hydrophone. Beam mapping is performed with tracker T mounted to the transducer cone, and the hydrophone tip localized in the T coordinate frame. A skull piece appears in the image, but calibration beam maps were collected without the skull. (b) Calibration I used the top set of trackers, and Calibration II used the bottom set, which are larger and MR safe. During MR targeting, the R tracker is used as a global reference. The bottom set were wrapped in black tape to reduce optical reflections.
Calibration Method: Optically Tracked Beam Mapping
The optical tracking system was first set up to measure the relative offset of the hydrophone and transducer during acquisition of 3D pressure maps in a water tank. The hydrophone tip position with respect to the tracked mounting rod was first localized using a standard pivot test (RMSE=0.31mm, Figure 1a). Since needle hydrophone tips are sensitive to damage, a brass facsimile was used for pivoting. Then, the real hydrophone was inserted and the tracked mounting rod (R) was attached to the motion stage. The transducer cone and tracker (T) were mounted to the acoustic window.
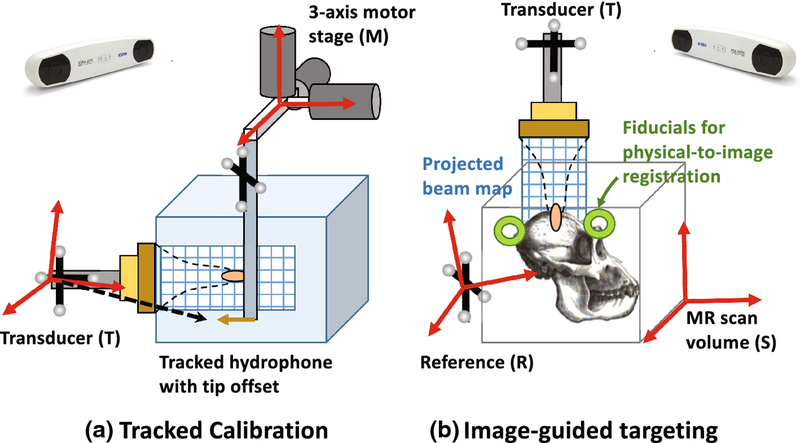
Volumetric pressure maps with step resolution of 0.4mm were collected in degassed water using a needle hydrophone attached to a 3D stage (Figure 2a). Both 250kHz and 802kHz pulses were measured with low duty cycles and low amplitudes (100 cycles every 50 ms, peak focal pressure ~400kPa). The hydrophone signals were digitized and recorded using a PicoScope (Model 5242B, Pico Technology, UK), which was programmed using the pico-python interface (github.com/colinoflynn/pico-python). Signals were pass-band filtered (4th order Butterworth, 3dB band 50kHz – 1600kHz). Positive peak values over 15 cycles were extracted from the hydrophone voltage trace and averaged, giving a measure of the scalar pressure field at each motor position. The final result was a voxelized map of free-field max pressure.
Figure 2 –
Coordinate systems involved in projecting beam voxels into MR image space. Acoustic voxels are defined by the motor stage (M), registered to the tracked position of the hydrophone tip, and converted to transducer coordinates (T). At the scanner these acoustic voxels are projected into MR scan volume (S) after fiducial registration. The reference (R) is used when localizing fiducials in physical space and tracking the transducer.
Detailed equations describing the coordinate transforms to voxelized are given in the appendix, and a brief description is provided here. We first derived an affine matrix relating the voxel indices to the optically tracked coordinates in the transducer frame (T). A voxel affine matrix with motor step sizes along the diagonal was used to convert acoustic voxel index to the motor spatial coordinate. Then, a sparsely sampled grid of motor positions was scanned, with the optical positions of the hydrophone and transducer recorded at each point. RMSE error of the collected positions was ~0.4 mm, and motor precision was ~4 microns. Registering the navigated motor positions to the measured optical positions yielded a motor-to-tracked object transform. Multiplying the voxel affine by this transform produced a new affine transform for converting pressure voxel index to tracked spatial coordinates. Acoustic voxels and this final affine transform were stored in NIFTI format for loading into 3D Slicer for real-time projection [32].
Measuring Error (TRE) in Phantoms
Experimental design
MR thermometry via the proton resonance frequency shift method was used to measure the accuracy of the calibrated FUS probe [33]. An anatomical scan of the agarose phantom with fiducials was initially acquired, and subsequently the phantom was removed from the magnet. The fiducials were then localized in space using a tracked tool, allowing us to compute the physical-to-image transform. The optically tracked ultrasound transducer was manually navigated and secured with thumb screws on the positioning system. With the transducer aimed, the system was placed back in the MRI scanner and MR thermometry images were acquired while the transducer emitted an acoustic pulse sufficient to generate a small temperature rise. Thermometry images were acquired using a standard 2D multislice gradient echo-single-shot echo planar imaging pulse sequence, with imaging parameters: field-of-view 110 mm × 86.5 mm, voxel size 1.7 mm × 1.7 mm, echo time 10 ms, repetition time 25 ms, 5 slices, slice thickness 2 mm, 10° flip angle. Each acquisition lasted about 90 seconds. Three images without heating were acquired to establish a relative baseline temperature for each experiment. Temperature images were reconstructed by phase subtraction of complex MR images acquired during heating (øheat) from the baseline MR image , where α is the PRF change coefficient (−0.01 ppm), γ is the gyromagnetic ratio (42.58 MHz•T−1), B0 is the magnetic field strength, and TE is the echo time. We tested a standard calibration, applied a prospective bias correction to the calibration, and limited motion in one study to isolate sources of error. In all cases, the TRE was computed as the difference in location between the intended and actual heated locations.
Registration and Targeting
Six fiducials were placed around the target volume in a spatially distributed (non-clustered) manner. The fiducial spatial pattern and number of fiducials were similar to prior theoretical and experimental studies on the effects of these parameters on the accuracy of navigation systems [34]. The stereotactic bed held the reference tracker, transducer, and coil. The bed was placed in the magnet for an initial anatomical scan. A 3D T1-weighted turbo field echo (TFE) scan showed the fiducial locations in image space. The bed was then removed, the data was downloaded to the tracking PC, and the fiducial centroids were localized using 3D Slicer software [32].
Tool tracking was initiated with 3D Slicer and the OpenIGTLinkIF module. An NDI-tracked probe with a calibrated tip position was inserted into each fiducial and its position was recorded relative to the reference tracker. Fiducial registration in 3D Slicer solved for the physical-to-image transform. The transform was applied to the tracked transducer, enabling a real-time overlay of the measured free-field beam to be displayed on the guidance image. The transducer was manually positioned so that the maximum of the projected focus from the free-field beam map acquired in water aligned with the target. The location and orientation of the transducer at the targeted position were recorded for error analysis as described in subsequent sections.
Calibration methods
A total of three rounds of experiments were conducted to measure TRE in phantoms. In the first round, we established the image-guided procedure and measured TRE. The second round tested a previously reported bias correction method [20]. In the third round, we fixed the transducer and phantom together to create an idealized scenario that would minimize registration errors that can occur due to motion of the phantom.
In all experiments, continuous wave FUS sonications were performed at either 802kHz or 250kHz for 30 seconds at an input power known to generate several degrees Celsius heating in the phantom (1W for 250 kHz and 2W for 802 kHz). MR Thermometry scans mapped multi-slice volumes with 7 slices angled to lie roughly parallel to the focal plane of the transducer. Scan voxels were 1.5 × 1.5 × 3 mm, with a dynamic scan time of 1 second for the full volume (EPI factor 3). Temperature maps were computed using the proton resonance-frequency shift (PRFS) method, in which temperature change is proportional to phase change from a baseline [33]. Four initial dynamics without FUS were collected as a baseline. Two calibration methods were tested:
-
(1)
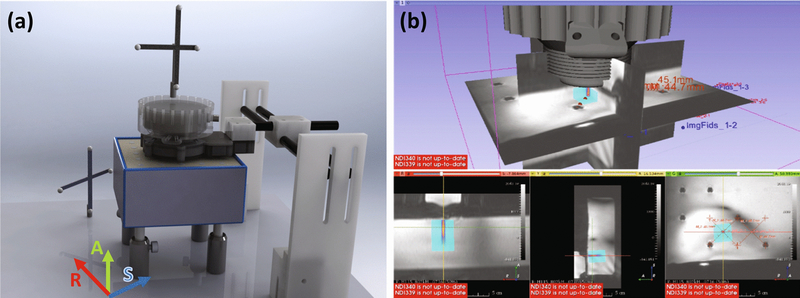
Calibration with no bias correction. In a first round of experiments (N=6) a large rectangular phantom was made with a regular grid of water columns to serve as guides for target selection. After fiducial-based registration, the transducer was pointed directly down and positioned to target the center point of a grid square, moving to a different section in each trial (Figure 4a). After each targeting session, the metal tracker was removed, the table was returned to the magnet, and anatomical scans and thermometry scans were collected.
-
(2)
Bias correction. In the initial round of experiments we observed an error distribution that was larger than expected and biased mainly in one direction by ~2 mm, consistent with Kim et al. [20]. Based on this we applied a bias correction, yielding an approximate shift of (x,y,z) = (1,2,0) mm that could be prospectively applied in the local axes of the transducer. On a different day we performed a second round of trials (N=5) to evaluate this correction. Trials 1–3 used the MR-based bias-correction by prospectively applying it to the beam overlay during targeting. Trials 4–5 used the regular calibration. Positioning of the reference tracker and camera differed between the two days’ experiments. The transducer, phantom, and image fiducials were in approximately the same place.
Figure 4 –
(a) Setup of transducer, reference, phantom and fiducials during targeting. The approximate alignment of MR coordinate axes is drawn for reference. (b) Screenshot showing real-time beam overlay in 3D Slicer on the THRIVE guidance image. Targets were selected as the grid centers and the transducer moved until the beam projected was centered on each target.
Restricting motion
Based on the prior experiments, we hypothesized that motion between the transducer and agarose was likely a source of error, so a third round of experiments was performed with this motion restricted. In this group (N=5), the phantom was coupled directly to the cone in a rigidly attached cylinder and fiducial markers were attached to structures on the plexiglass table. Sonications were performed at 802 kHz only, since no differences in TRE between 250 and 802 kHz were observed in prior experiments. Restricted motion trials also used MR compatible trackers that could be left in place during MR scans unlike commercial trackers, which required removal. In each trial the transducer and phantom assembly was translated and rotated to different angles to simulate targeting around the head.
In Vivo Sonications
Setup and Acoustic Radiation Force Imaging
Calibration II was used to target the somatosensory cortex areas 3a/3b of two macaque monkeys. All procedures were conducted in accordance with National Institutes of Health guidelines and were approved by the Institutional Animal Care and Use Committee of Vanderbilt University. Two adult male macaque monkeys (M. fascicularis) were studied. Animals were initially sedated with ketamine hydrochloride (10 mg/kg) and atropine sulfate (0.05 mg/kg) and then anesthetized with isoflurane (1.0%−1.5%) delivered over oxygen and maintained at a light (0.85–1.0%) and stable level of anesthesia. After intubation, the animal was placed in a custom-designed MR stereotaxic frame with the head secured by ear bars, eye, and mouthpieces. Animals were artificially ventilated throughout the experiment. Rectal temperature was maintained (SA Instruments) between 37.5 °C and 38.5 °C by means of a circulating water blanket. Heart rate and peripheral capillary oxygen saturation (SpO2; Nonin), respiration pattern and end-tidal CO2 (24–32 mmHg; SurgiVet) were continuously monitored and maintained during the entire procedure.
MR imaging preparation was performed as described in [22]. 3D fast spoiled gradient-recalled echo T1-weighted high-resolution isotropic volume examination (THRIVE) images were acquired to localize the fiducial markers placed around the US probe for aligning and localizing the US beam to structural MRI images (TR = 1.89 ms, TR = 4 ms, flip angle 10°, NSA = 1). Four imaging fiducials were placed on the stereotactic frame and two on the head, and the same THRIVE scan was used for localization and targeting of the S1 region. Sonications were performed at 802 kHz at powers below levels expected to generate heat or cavitation within the skull (estimated intracranial MI=0.84, Ispta=85.4 mW/cm2). Beam projections were used to estimate the acoustic axis in MR coordinates and align the MR gradient direction for maximum sensitivity to tissue displacement [35].
Displacement images were acquired using a spin echo 2D MR-ARFI sequence implemented with parameters: FOV/matrix/voxel size 120×120×2 mm3/60×60×1/2 mm3 isotropic; TE/TR 15/1000 ms; 27° flip angle; multishot EPI readout with 5 shots per TR. Repeated unipolar MEGs were used for ARFI encoding, with gradient duration/strength 3 ms/40 mT•m−1. The second MEG was synchronized with an ultrasound emission using TTL outputs sent to the transducer. Sonications were performed at a low duty cycle (4.5 ms every TR or 1000 ms). Displacement images were reconstructed by subtraction of four phase images using opposite MEG polarities with FUS turned on or off: .
Data Analysis
Three independent sets of data were obtained from phantom error studies, with 6, 5, and 5 trials, respectively. Each trial included a target prediction, the quaternion/position of the transducer over the target, a physical-to-image fiducial transform, and temperature mapping. Data were analyzed in an IPython notebook. To calculate TRE, temperature volumes were smoothed with a 0.75 × 0.75 × 1.5 mm3 Gaussian kernel (sigma equal to half the voxel size in each dimension) to filter noise, and linearly interpolated to a resolution of 0.25 mm. Next, acoustic voxel data were linearly interpolated into the subsampled image grid with the same the chain of transforms used during targeting. Finally, TRE was measured by finding the location of maximum 3D cross-correlation between the temperature map and the projected acoustic data, which estimates the spatial lag between the two. Significance between calibrations was evaluated with an independent two-tailed T test.
Results
Beam maps overlaid on pre-acquired MRI
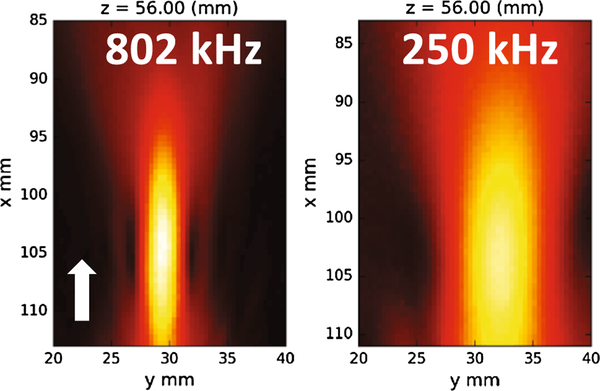
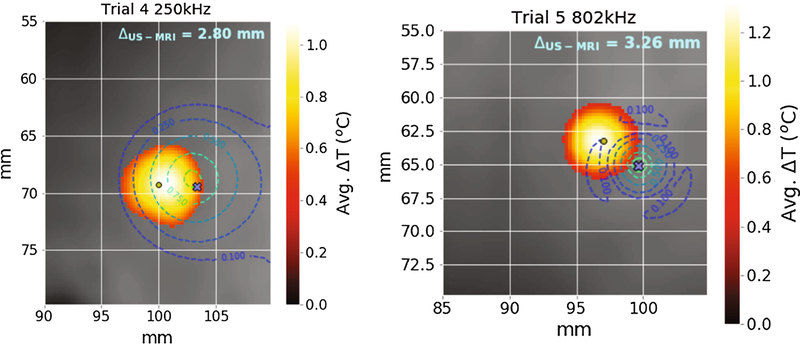
Beam maps (Figure 3) show that the H115 with the coupling cone is focused approximately 1cm beyond the cone aperture. At 802 kHz the focus had a full-width at half-maximum (FWHM) of 2.31 mm in the transverse direction, and at 250 kHz the transverse FWHM was 7.53 mm. Axial focal length was not determined in the same manner because the pre-focal half-maximum occurs behind the coupling membrane inside the cone. Distance from the peak to post-focal half max was 9.1 mm at 802 kHz and 31.5 mm at 250 kHz. Knowing the position of these hydrophone maps relative to the transducer rigid body (T) enabled the beams to be projected onto targets in real-time using 3D Slicer (Figure 4b). Random jitter was observed in the real-time overlay due to statistical localization error of the tracking system. By saving the transducer location during image guidance, the projected beam and subsequently acquired temperature map could be overlaid (Figure 5).
Figure 3 –
Axial slice through beam maps at each frequency showing peak receive voltage. The coupling cone opening is approximately 2mm beyond the bottom of each figure. The white arrow indicates sonication direction. Axes list the motor coordinates. The transducer and motors were not in exactly the same position in each case.
Figure 5 –
Example temperature slices showing the computed error between the hotspot and beam overlay. The blue × marks the desired sonication target. Contours represent the percentiles (10,25,50,75,90) of peak pressure from projected beam maps.
Bias correction did not correct independent trials
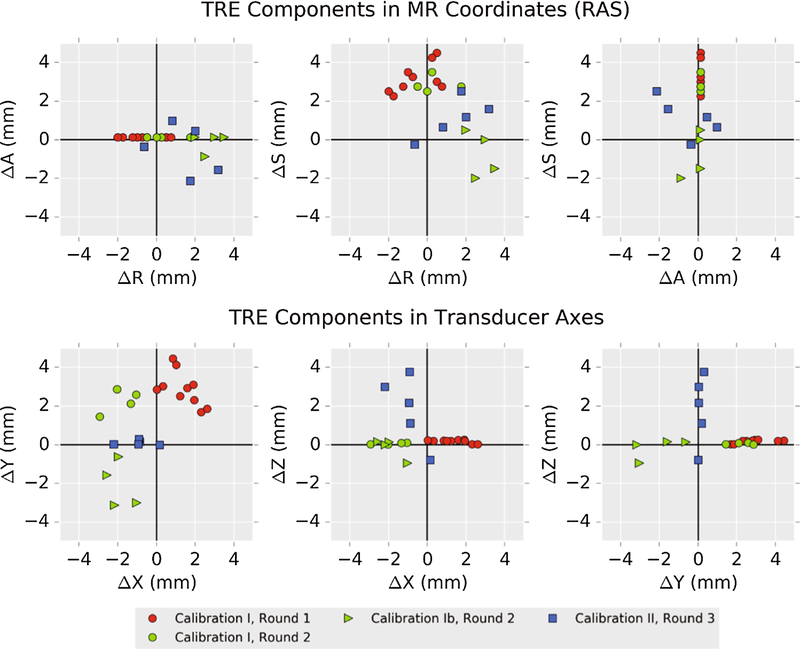
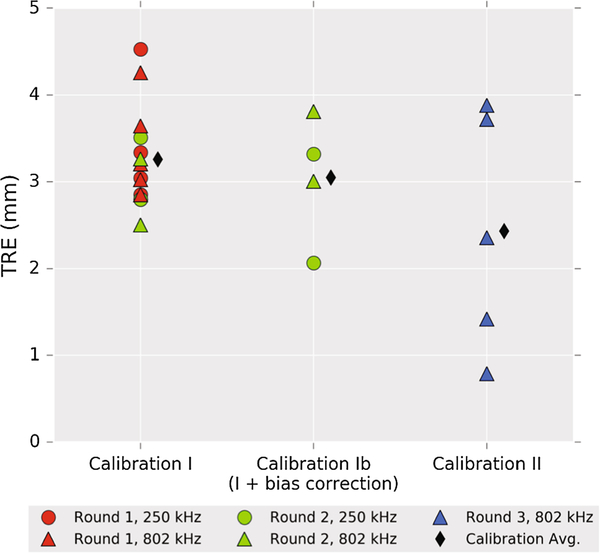
In the first round, Trial 1 was excluded from averaging because of poor coupling that caused surface heating, leaving Trials 2–6 (5 repetitions each) for analysis. The average TRE across the remaining five trials was 3.31 (2.80 – 4.53) mm at 250 kHz and 3.40 (2.85 – 4.26) mm at 802 kHz, where the values are given as “mean (min – max)”. The predicted focus in the axial direction was consistent with the maximum temperature slice (within 0.25 mm) in the smoothed and interpolated data. An apparent bias in the components of TRE was observed in neurological coordinates (R – right, A – anterior, S – superior) (Figure 6, red circles). Using the recorded tracker orientation, this bias was converted to transducer axes to derive an offset correction to the calibration: (x,y,z) = (1,2,0) mm (magnitude 2.2 mm), which was applied prospectively in the second-round trials 1–3 (“Calibration Ib,” green triangles in Figure 6). Surface heating resulted in exclusion of Trial 2. The bias correction did not yield a statistically significantly lower TRE, although the error was rotated to a different axis. Trials 4 and 5 did not use the bias correction and thus are included with Calibration I data. In summary, the average TRE across Calibration I unbiased trials was 3.26 (2.80 – 4.53) mm, and the average TRE across the biased trials was 3.05 (2.06 – 3.81) mm.
Figure 6 –
Vector components of targeting registration error (TRE), computed as measured – predicted (i.e., MR hotspot – overlaid beam). The top row shows errors in MR coordinates using the Right, Anterior, Superior (RAS+) coordinate convention. Bottom row shows the same errors with respect to the calibration axes of the transducer. If there were only statistical error in localizing fiducials, TRE components should be symmetrically distributed about (0,0) in each plot. Comparing Rounds 1 and 2, it is clear that applying an offset in the transducer coordinate frame does not correct bias observed in Round 1.
Restricting motion reduces TRE
In the third round, the phantom was mechanically attached to the transducer and MR compatible trackers were used. With these changes, the TRE in Calibration II was reduced to 2.43 (0.79 – 3.88) mm. The average error from Calibration Ib (n=4) was not significantly different from Calibration I (n=14, p=0.55). Calibration II (n=5) had a more significant reduction vs. Calibration I (p=0.07). Errors are plotted in Figure 7.
Figure 7 –
Summary of targeting error magnitudes observed during phantom trials. Group averages were 3.26 mm (I), 3.05 mm (Ib), 2.43 mm (II). The small improvement between I and Ib was not statistically significant (p=0.55). Improvement between I and II was more significant (p=0.07). See Results and Discussion sessions for detailed analysis.
In vivo ARFI
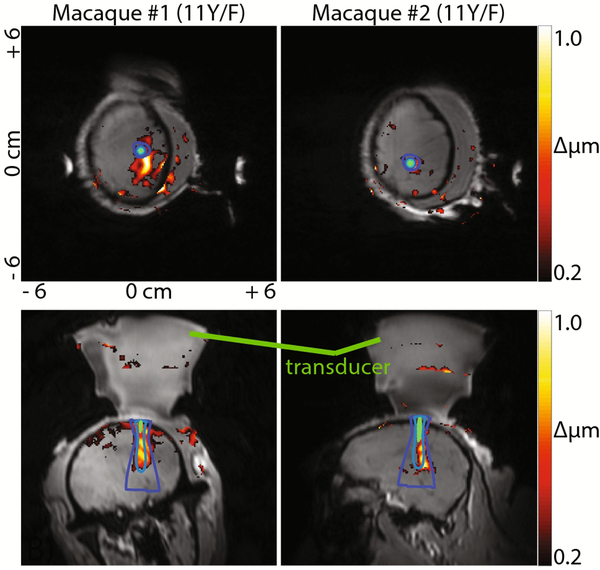
MR-ARFI imaging allowed us to overlay the optically tracked focus onto a spatial map of tissue displaced by the acoustic focus. Considering the TRE of approximately 3mm and the distance from the tracker center to the focus (~120mm), we estimated the uncertainty annulus of the motion encoding gradient direction to have a half-angle θ = 3/120 rad ≈ 1.43°. ARFI localized the acoustic focus in vivo with qualitatively similar overlay between the predicted beam and ARFI focus. Error between the predicted focus and ARFI centroid was on the order of 5 mm, but this value is not quantitative since the ARFI signal was diffuse and only imaged in two orthogonal slices.
Discussion
TRE is comparable to surgical tools
All calibration procedures in our study had error near 3mm, which is comparable to surgical tools with a physical tip. Labadie et al. evaluated several commercial guidance systems in a uniform manner, using common tracked surgical tools and skin-affixed fiducial markers, and showed average TREs between 1.3 – 2.8 mm [36]. Another study using fiducial imaging phantoms and several commercial tracking systems showed average TREs between 1.6 – 3.9 mm [34].
Sources of error and biases
Observed TREs were not distributed in a spatially symmetric manner, which is unexpected since components of TRE along an arbitrary axis should be zero-mean and normally distributed [27, 28]. The presence of a bias during calibration, perhaps due to discrepancy between the brass and needle hydrophone tip, was hypothesized from the initial data set and prospectively applied to the calibration in a second round. Slightly reduced error was observed but appeared offset in a different direction and was not statistically significant. The MR-inferred bias from Calibration I does not seem to be due to an offset that can be trivially corrected during targeting in our study.
Other sources of error may cause an uncorrectable bias, including image distortion, fiducial localization error, or tracker configuration error. Observed bias using Calibration I lay mainly in the ‘S’ direction in RAS patient coordinates (Figure 6), which may suggest distortion in the image volume. Alternatively, bias error when localizing fiducials in physical space might explain TRE bias, since the transducer, phantom and fiducials were in similar locations in both experimental rounds. Several of the donut-shaped fiducials were difficult to access with the tracked probe, perhaps leading to repeated localization errors. Configuration error in one or both of the optically-tracked bodies could also have contributed to the observed bias. The theoretical prediction that TRE components have zero-mean assumes a zero-mean FLE distribution [28, 37]. However, if one or more of the tracked passive spheres is physically offset from what the tracking software expects, the effect is a non-symmetrical FLE distribution that could lead to biased TRE components.
The custom tracker in Calibration I was 3D printed with a mechanical tolerance ~0.08 mm. However, the snap-fit connectors typically used to mount the spheres are metal, so connectors were 3D printed for MR compatibility that resulted in a potentially larger offset. Using the NDI 6D Architect software, we estimated this error could be as large 0.3 mm for 1–2 spheres, which could contribute to the observed bias. Calibration II trackers used LEGO parts which have a tolerance 0.01–0.02 mm. In the third round, the tracked bodies were re-designed to be MR-compatible and we made the following changes, based on the work of Fitzpatrick and West [27, 28]: First, the distance between reflective spheres was increased by several cm, which has the result of reducing TRE due to increased RMS distance of the spheres from each principal axis (fk term in the denominator of equation (4) in [27]). Second, sphere mount spacing was increased and a file describing the geometry of the custom tool was created using NDI 6D Architect to make the optical centroid agree more closely with the design value. In Calibration II we used hard-plastic snap-fit connectors, as opposed to the 3D printed connectors from Calibration I (some of which broke and were reattached with epoxy). These changes reduced possible mis-registration from movement of the phantom and fiducials, and error associated with tracker configuration. Overall, these experiments characterized the effects of design decisions on TRE when using tracked ultrasound.
ARFI confirmed beam placement in vivo
Optical tracking enabled alignment of MR gradients for maximal sensitivity in acoustic radiation force imaging (ARFI) scans. Detection of displacement with MR requires that the motion-encoding gradient be aligned with the principal displacement direction for peak sensitivity [38, 39]. Since displacement occurs mainly along the FUS sonication axis near the focus, ARFI gradient direction was determined by estimating the principal axis of the cigar-shaped focus in MR coordinates via the projected beam.
Study limitations
One limitation of using a tracked hydrophone to generate a beam map relative to the transducer is that it introduces a rigid transform to the registration procedure that would not be present in pivot-based tests. The additional transform could increase the TRE, and it may account for some of the biases observed in our study. We note that the TRE observed in our study was in the range of that reported elsewhere and that pivot-based methods likely suffer from similar errors since they rely on rigidity and accuracy of the pivoting apparatus [40]. Using a tracked hydrophone allows a measured beam map to be directly overlaid on the anatomical guidance image.
A second limitation is that we only acquired MR-ARFI images in 2 orthogonal planes, which prevented us from quantifying the error in vivo. A recent study where the BBB opening was done in a macaque monkey using optically guided ultrasound found a TRE of approximately 2.5 mm between the targeted location and opened BBB region as detected by contrast-enhanced MRI, which is consistent with our phantom measurements [18]. A larger image volume is feasible with MR-ARFI. However, each acquisition of a line of k-space requires two 4.5 ms acoustic pulses in our MR-ARFI imaging scheme, so careful consideration of the overall acoustic duty cycle is required to maintain negligible heating and avoid bioeffects. Our study is the first report of transcranial MR-ARFI imaging of the brain in a survival study and demonstrates that MR-ARFI is feasible method to localize the acoustic beam during MRI.
Conclusions
A novel method for calibration and real time image-guided targeting was presented, and its error assessed via MR thermometry. The initial method was shown to have an error of 3.26 mm with an asymmetric bias of 2.2 mm, similar to previous results. Error was reduced to an average 2.43 mm by minimizing motion and using MR-compatible trackers with a larger spatial footprint. We observed biases in all calibrations that were likely due to a variety of factors, including FLE, tracker configuration, or image distortion. We demonstrated in vivo feasibility of the workflow and MR-ARFI in the macaque brain. The measurements and methods reported here are relevant to the burgeoning field of FUS neuromodulation, where offline image guidance is often desirable to test FUS neuromodulation outside of the imaging environment.
Supplementary Material
Figure 8 –
Displacement maps (ARFI) acquired in several planes in two animals. Gradients were aligned by estimating the focal axis direction from projected beam maps. 802 kHz beam contours are overlaid. The background grayscale is a THRIVE scan taken after targeting and returning the animal to the magnet.
Acknowledgements
This work was funded by National Institutes of Health grants 5T32EB014841, R24 MH109105, and the Focused Ultrasound Foundation. We would also like to acknowledge expert assistance from George Wilson and Chaohui Tang for animal handling support and Tom Manuel for assistance with computer-aided design.
Footnotes
Appendix A
Please find attached appendex.
Conflict of interest statement
V. Chaplin, M.A. Phipps, S.V. Jonathan, W. Grissom, P.F. Yang, L.M. Chen, and C.F. Caskey declare no conflicts of interest associated with the present work.
References
- 1.Hynynen K, Darkazanli A, Unger E, Schenck JF (1993) MRI-guided noninvasive ultrasound surgery. Med Phys 20:107–115. 10.1118/1.597093 [DOI] [PubMed] [Google Scholar]
- 2.Wain H, Vanbaren P, Member S, Ebbini ES, Cain CA (1996) Ultrasound Surgery : Comparison of Strategies Using Phased Array Systerns. 43:1085–1098 [Google Scholar]
- 3.Mestas JL, Fowler RA, Evjen TJ, Somaglino L, Moussatov A, Ngo J, Chesnais S, Rognvaldsson S, Fossheim SL, Nilssen EA, Lafon C (2014) Therapeutic efficacy of the combination of doxorubicin-loaded liposomes with inertial cavitation generated by confocal ultrasound in AT2 Dunning rat tumour model. J Drug Target 22:688–697. 10.3109/1061186X.2014.906604 [DOI] [PubMed] [Google Scholar]
- 4.ter Haar G, Coussios C (2007) High intensity focused ultrasound: Physical principles and devices. Int J Hyperth 23:89–104. 10.1080/02656730601186138 [DOI] [PubMed] [Google Scholar]
- 5.Unga J, Hashida M (2014) Ultrasound induced cancer immunotherapy. Adv Drug Deliv Rev 72:144–153. 10.1016/j.addr.2014.03.004 [DOI] [PubMed] [Google Scholar]
- 6.Hu Z, Yang XY, Liu Y, Morse M a., Lyerly HK, Clay TM, Zhong P (2006) Investigation of HIFU-induced anti-tumor immunity in a murine tumor model. AIP Conf Proc 829:241–245. 10.1063/1.2205474 [DOI] [PMC free article] [PubMed] [Google Scholar]
- 7.Kennedy JE, ter Haar GR, Cranston D (2003) High intensity focused ultrasound: surgery of the future? Br J Radiol 76:590–599. 10.1259/bjr/17150274 [DOI] [PubMed] [Google Scholar]
- 8.McDannold N (2005) Quantitative MRI-based temperature mapping based on the proton resonant frequency shift: review of validation studies. Int J Hyperthermia 21:533–546. 10.1080/02656730500096073 [DOI] [PubMed] [Google Scholar]
- 9.Quesson B, Vimeux F, Salomir R, De Zwart J a., Moonen CTW (2002) Automatic control of hyperthermic therapy based on real-time fourier analysis of MR temperature maps. Magn Reson Med 47:1065–1072. 10.1002/mrm.10176 [DOI] [PubMed] [Google Scholar]
- 10.Clement GT, White PJ, King RL, McDannold N, Hynynen K (2005) A magnetic resonance imaging-compatible, large-scale array for trans-skull ultrasound surgery and therapy. J Ultrasound Med 24:1117–1125. https://doi.org/24/8/1117[pii] [DOI] [PubMed] [Google Scholar]
- 11.Hynynen K, Clement GT, McDannold N, Vykhodtseva N, King R, White PJ, Vitek S, Jolesz FA (2004) 500-Element ultrasound phased array system for noninvasive focal surgery of the brain: A preliminary rabbit study with ex vivo human skulls. Magn Reson Med 52:100–107. 10.1002/mrm.20118 [DOI] [PubMed] [Google Scholar]
- 12.Hand JW, Shaw A, Sadhoo N, Rajagopal S, Dickinson RJ, Gavrilov LR (2009) A random phased array device for delivery of high intensity focused ultrasound. Phys Med Biol 54:5675–5693. 10.1088/0031-9155/54/19/002 [DOI] [PubMed] [Google Scholar]
- 13.Savic LJ, Lin M De, Duran R, Schernthaner RE, Hamm B, Geschwind J-F, Hong K, Chapiro J (2015) Three-Dimensional Quantitative Assessment of Lesion Response to MR-guided High-Intensity Focused Ultrasound Treatment of Uterine Fibroids. Acad Radiol. 10.1016/j.acra.2015.05.008 [DOI] [PMC free article] [PubMed] [Google Scholar]
- 14.King RL, Brown JR, Pauly KB (2014) Localization of Ultrasound-Induced In Vivo Neurostimulation in the Mouse Model. Ultrasound Med Biol 40:1512–1522. 10.1016/j.ultrasmedbio.2014.01.020 [DOI] [PubMed] [Google Scholar]
- 15.Kim H, Chiu A, Lee SD, Fischer K, Yoo SS (2014) Focused ultrasound-mediated non-invasive brain stimulation: Examination of sonication parameters. Brain Stimul 7:748–756. 10.1016/j.brs.2014.06.011 [DOI] [PMC free article] [PubMed] [Google Scholar]
- 16.Ye PP, Brown JR, Pauly KB (2016) Frequency dependence of ultrasound neurostimulation in the mouse brain. Ultrasound Med Biol 42:. 10.1016/j.ultrasmedbio.2016.02.012 [DOI] [PMC free article] [PubMed] [Google Scholar]
- 17.Airan RD, Meyer RA, Ellens NPK, Rhodes KR, Farahani K, Pomper MG, Kadam SD, Green JJ (2017) Noninvasive targeted transcranial neuromodulation via focused ultrasound gated drug release from nanoemulsions. Nano Lett 17:652–659 [DOI] [PMC free article] [PubMed] [Google Scholar]
- 18.Wu S-Y, Aurup C, Sanchez CS, Grondin J, Zheng W, Kamimura H, Ferrera VP, Konofagou EE (2018) Efficient Blood-Brain Barrier Opening in Primates with Neuronavigation-Guided Ultrasound and Real-Time Acoustic Mapping. Sci Rep 8:7978 10.1038/s41598-018-25904-9 [DOI] [PMC free article] [PubMed] [Google Scholar]
- 19.Szablowski JO, Lee-Gosselin A, Lue B, Malounda D, Shapiro MG (2018) Acoustically targeted chemogenetics for the non-invasive control of neural circuits. Nat Biomed Eng 2:475. [DOI] [PubMed] [Google Scholar]
- 20.Kim H, Chiu A, Park S, Yoo SS (2012) Image-guided navigation of single-element focused ultrasound transducer. Int J Imaging Syst Technol 22:177–184. 10.1002/ima.22020 [DOI] [PMC free article] [PubMed] [Google Scholar]
- 21.Lee W, Kim H, Jung Y, Song I-U, Chung YA, Yoo S-S (2015) Image-Guided Transcranial Focused Ultrasound Stimulates Human Primary Somatosensory Cortex. Sci Rep 5:8743 10.1038/srep08743 [DOI] [PMC free article] [PubMed] [Google Scholar]
- 22.Yang P-F, Phipps MA, Newton AT, Chaplin V, Gore JC, Caskey CF, Chen LM (2018) Neuromodulation of sensory networks in monkey brain by focused ultrasound with MRI guidance and detection. Sci Rep 8:. 10.1038/s41598-018-26287-7 [DOI] [PMC free article] [PubMed] [Google Scholar]
- 23.Hinsche AF, Smith RM (2001) Image-guided surgery. Curr Orthop 15:296–303. 10.1054/cuor.2001.0198 [DOI] [Google Scholar]
- 24.Azagury DE, Dua MM, Barrese JC, Henderson JM, Buchs NC, Ris F, Cloyd JM, Martinie JB, Razzaque S, Nicolau S, Soler L, Marescaux J, Visser BC (2015) Image-guided surgery. Curr Probl Surg 52:476–520. 10.1067/j.cpsurg.2015.10.001 [DOI] [PubMed] [Google Scholar]
- 25.Lindseth F, Lang T, Selbekk T, Hansen R, Reinertsen I, Askeland C, Solheim O, Unsgrd G, Mrvik R, Nagelhus Hernes TA (2013) Ultrasound-Based Guidance and Therapy In: Advancements and Breakthroughs in Ultrasound Imaging. InTech [Google Scholar]
- 26.Perrin DP, Vasilyev NV., Novotny P, Stoll J, Howe RD, Dupont PE, Salgo IS, del Nido PJ (2009) Image Guided Surgical Interventions. Curr Probl Surg 46:730–766. 10.1067/j.cpsurg.2009.04.001 [DOI] [PubMed] [Google Scholar]
- 27.West JB, Maurer CR (2004) Designing optically tracked instruments for image-guided surgery. IEEE Trans Med Imaging 23:533–545. 10.1109/TMI.2004.825614 [DOI] [PubMed] [Google Scholar]
- 28.Fitzpatrick JM, West JB, Maurer CR (1998) Predicting error in rigid-body point-based registration. IEEE Trans Med Imaging 17:694–702. 10.1109/42.736021 [DOI] [PubMed] [Google Scholar]
- 29.Miga MI, Roberts DW, Kennedy FE, Platenik LA, Hartov A, Lunn KE, Paulsen KD (2001) Modeling of retraction and resection for intraoperative updating of images. Neurosurgery 49:75–85. 10.1227/00006123-200107000-00012 [DOI] [PubMed] [Google Scholar]
- 30.Conley RH, Meszoely IM, Weis JA, Pheiffer TS, Arlinghaus LR, Yankeelov TE, Miga MI (2015) Realization of a biomechanical model-assisted image guidance system for breast cancer surgery using supine MRI. Int J Comput Assist Radiol Surg 10:1985–1996. 10.1007/s11548-015-1235-9 [DOI] [PMC free article] [PubMed] [Google Scholar]
- 31.Burlew MM, Madsen EL, Zagzebski JA, Banjavic RA, Sum SW (1980) A new ultrasound tissue-equivalent material. Radiology 134:517–520 [DOI] [PubMed] [Google Scholar]
- 32.Fedorov A, Beichel R, Kalpathy-Cramer J, Finet J, Fillion-Robin J-C, Pujol S, Bauer C, Jennings D, Fennessy F, Sonka M (2012) 3D Slicer as an image computing platform for the Quantitative Imaging Network. Magn Reson Imaging 30:1323–1341 [DOI] [PMC free article] [PubMed] [Google Scholar]
- 33.Rieke V, Pauly KB (2008) MR thermometry. J Magn Reson Imaging 27:376–390. 10.1002/jmri.21265 [DOI] [PMC free article] [PubMed] [Google Scholar]
- 34.Steinmeier R, Rachinger J, Kaus M, Ganslandt O, Huk W, Fahlbusch R (2000) Factors influencing the application accuracy of neuronavigation systems. Stereotact Funct Neurosurg 75:188–202. 10.1159/000048404 [DOI] [PubMed] [Google Scholar]
- 35.Jonathan S, Phipps MA, Chaplin VL, Singh A, Yang PF, Newton AT, Gore JC, Chen LM, Caskey CF, Grissom WA (2018) Optical tracking-guided MR-ARFI for targeting focused ultrasound neuromodulationin non-human primates In: Grissom WA, Caskey CF (eds) The 18th International Society of Therapeutic Ultrasound. Nashville, pp 176–178 [Google Scholar]
- 36.Labadie RF, Davis BM, Fitzpatrick JM (2005) Image-guided surgery: what is the accuracy? Curr Opin Otolaryngol Head Neck Surg 13:27–31 [DOI] [PubMed] [Google Scholar]
- 37.Wiles AD, Likholyot A, Frantz DD, Peters TM (2008) A statistical model for point-based target registration error with anisotropic fiducial localizer error. IEEE Trans Med Imaging 27:378–390. 10.1109/TMI.2007.908124 [DOI] [PubMed] [Google Scholar]
- 38.McDannold N, Maier SE (2008) Magnetic resonance acoustic radiation force imaging. Med Phys 35:3748–3758. 10.1118/1.2956712 [DOI] [PMC free article] [PubMed] [Google Scholar]
- 39.Hertzberg Y, Volovick a, Zur Y, Medan Y, Vitek S, Navon G (2010) Ultrasound focusing using magnetic resonance acoustic radiation force imaging: application to ultrasound transcranial therapy. Med Phys 37:2934–2942. 10.1118/1.3395553 [DOI] [PubMed] [Google Scholar]
- 40.Lee W, Kim H-C, Jung Y, Chung YA, Song I-U, Lee J-H, Yoo S-S (2016) Transcranial focused ultrasound stimulation of human primary visual cortex. Sci Rep 6:34026. 10.1038/srep34026 [DOI] [PMC free article] [PubMed] [Google Scholar]
Associated Data
This section collects any data citations, data availability statements, or supplementary materials included in this article.


