Abstract
This study investigated the cytotoxic effects of gemcitabine-loaded solid lipid nanoparticle (Gem-SLN) on the patient-derived primary pancreatic cancer cell lines (PPCL-46) and MiaPaCa-2. Different SLN formulations were prepared from glyceryl monostearate (GMS), polysorbate 80 (Tween® 80) and poloxamer 188 (Pol 188) as surfactants using a cold homogenization method. Gem-SLN was characterized for particle size and charge distribution, entrapment efficiency and loading capacity. Fourier Transform Infra-Red (FTIR) spectroscopy was used to verify Gem and SLN interaction while differential scanning calorimetry (DSC) was used to acquire thermodynamic information on Gem-SLN. Cytotoxicity studies was conducted on PPCL-46 cells and Mia-PaCa-2 cells. Among the different Gem-SLN formulations prepared, Gem-SLN15 was selected based on entrapment efficiency (EE) of Gem, loading efficiency of Gem, cytotoxicity and rate of Gem release. Growth inhibition of Gem-SLN15-treated PPCL-46 culture (IC50 (2D) =27± 5 μM; IC50 (3D) = 66 ± 2 μM) was remarkably higher than gemcitabine hydrochloride (GemHCl)-treated PPCL-46 culture (IC50 (2D) =126±3 μM; IC50 (3D) =241±3 μM). Similar trend of higher Gem-SLN15 inhibition in MiaPaCa-2 culture was found (IC50 (2D) =56±16 μM; IC50 (3D) =127±4 μM) compared with GemHCl-treated Mia-PaCa-2 culture (IC50 (2D) =188±46 μM; IC50 (3D) =254±52 μM). The anticancer activity of Gem-SLN15 was significantly more effective than GemHCl in PPCL-46 compared to Mia-PaCa-2 cancer cells.
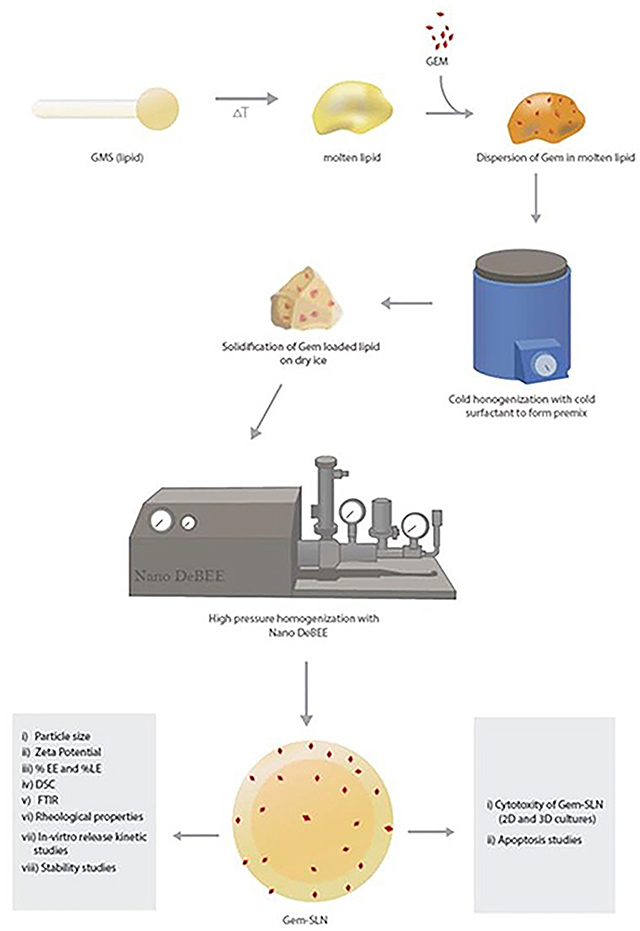
Schematic diagram for preparation of Gem-SLN through cold homogenization and methods for characterization and in-vitro studies
Keywords: Gemcitabine, solid lipid nanoparticle, primary pancreatic cancer, spheroids, in-vitro release kinetics
Graphical Abstract
1. Introduction
Pancreatic cancer (PCa) is projected to be the second leading cause of cancer deaths by 2030 (Rahib et al., 2014). Systemic cytotoxic and kinase-targeted regimen represent the standard of care for most patients presenting with PCa. Most tumors, however, develop rapid resistance to these regimens and continue to progress by unknown mechanisms. (Koay et al., 2014; Moore et al., 2007) As a result, both the median survival and annual death rate for patients with PCa have remained unchanged over the past 20 years (Baxter et al., 2007).
Gemcitabine (Gem) is a nucleoside analog used as a form of chemotherapy for non-small cell lung, pancreatic, bladder and breast cancers (Amrutkar and Gladhaug, 2017). It’s the preferred drug of choice in the treatment of PCa either alone in debilitated PCa patients or in combination with other drugs such as leucovorin, 5-fluorouracil, irinotecan, and oxaliplatin also known as FOLFIRINOX in healthy PCa patients (Gilabert et al., 2017; Kobayashi et al., 2017; Orlandi et al., 2016). However, the significant limitation of Gem is the short half-life of between 8–15 minutes due to rapid metabolism, fast renal clearance and decreased protein binding (Blackstock et al., 2001; Li et al., 2009). Due to the short half-life, the maintenance of therapeutic concentrations of Gem requires a continuous parenteral administration leading to severe side effects such as renal and hematological toxicities (Dorjee and Long, 2018; Kasuya et al., 2012; Muranaka et al., 2017). This inherent drawback has necessitated for an alternative drug delivery system. Solid lipid nanoparticle (SLN) as a drug delivery system offer great promise to improve therapeutic effectiveness and safety profile of conventional form of cancer chemotherapeutic agents (Bakhtiary et al., 2017; Kulkarni et al., 2016). Further, a number of SLNs or SLN based nano-delivery systems have been successfully developed and investigated for the delivery of cytotoxic drugs (Chen et al., 2018; Nandini et al., 2015). The SLNs are nano-sized particles (100–700 nm) that have the ability to diffuse out of the blood vessels and accumulate within the tumor. In fact, compelling evidence has recently been provided to support the view that nanocarriers (such as SLNs, polymeric nanoparticles) can be used to enhance the delivery of chemotherapeutics to the tumor site compared with the free drug in human studies (Clark et al., 2016; Fang et al., 2011).
Using cancer cells that have the capability to generate high-fidelity in-vitro models to explore the efficacy of anticancer drugs is critical toward the development of better therapeutics.
While commercially available PCa cells have widely been used in animal models in the study of PCa for the past 40 years, highly passaged established cells can be of poor predictive value in clinical trials (Pham et al., 2016). Furthermore, significant molecular heterogeneity of pancreatic tumors is absent in established commercial cells and has further prohibited our understanding of patient response to chemotherapy (Pham et al., 2016). To address this limitation, we propose the use of not only established commercially available cell lines, but also patient-derived pancreatic cancer cells (PPCL) to afford researchers an improved preclinical platform as these cells exhibit early genetic stability and patient-specific tumor morphology (Delitto et al., 2015).
The objective of this study was to develop an alternative drug delivery system in the form of SLN prepared by glyceryl monostearate (GMS) and Tween® 80 or poloxamer 188. Herein, we prepared 24 different SLN loaded-Gems (Gem-SLNs) by cold homogenization followed by characterization and determined the in-vitro release kinetics of these formulations. Based on entrapment efficiency, promising formulations of SLNs were selected and cytotoxicity studies conducted, alongside with GemHCl against 2D and 3D Mia-PaCa-2, and PPCL-46 cultures. The present study provides the optimal information needed to conduct future investigations of Gem-SLNs on tumor efficacy in patient derived pancreatic cancer xenograft mouse models, biodistribution and pharmacokinetic parameters, and toxicological studies.
2. Materials and Methods
2.1. Materials
Glyceryl monostearate purified powder (GMS) was purchased from Alfa Aesar (Ward Hill, MA). The surfactants; poloxamer 188 was obtained from Fisher Scientific (Hampton, NH), and polysorbate 80 (Tween® 80) from EMD Chemicals Inc., (Gibbstown, NJ). Gemcitabine was purchased from AK Scientific (Union City, CA). Pancreatic cancer MIA-PaCa-2 cells (K-Ras (G12C)) were bought from American Type Culture Collection (ATCC) (Manassas, VA). PPCL-46 46 is a patient-derived cell line (K-Ras (G12V)) obtained from Dr. Trevino’s lab with methods previously described (Pham et al., 2016). This cell line was derived from a 75-year-old, Caucasian female with a moderately differentiated, T3N1 pancreatic ductal adenocarcinoma who underwent pancreatoduodenectomy for her disease. All solvents used were of analytical grade.
2.2. Preparation of Gem-SLNs using GMS and surfactant poloxamer-188 or Tween 80
The 24 different Gem-SLN formulations were prepared by high pressure cold homogenization technique (Chaudhury and Das, 2011). Briefly, varying amount of GMS was mixed with 15 mg (0.05 %w/v) of Gem and melted on hot plate at a temperature of 75–80 °C. Afterwards, varying amounts of surfactant poloxamer-188 or Tween 80 solution that had been dissolved in distilled water with the aid of a magnetic stirrer and cooled on ice was added (in aliquot fashion) to precooled Gem-melted oil medium followed by intermittent homogenization (10,000 rpm) (Graphical abstract). The obtained microparticulate suspensions were further processed into nanosized forms using Nano DeBEE high pressure homogenizer at a pressure of 3,500 psi through 10 cycles (Graphical abstract). The Gem-SLN nano-suspensions were finally dialyzed overnight against 1.5 liters of phosphate buffer (1× PBS, pH 7.4, stirred) at 4°C by using dialysis-bag of molecular weight cut-off of 3,000 daltons to remove any unentrapped Gem (Das and Chaudhury, 2011). The final product Gem-SLN nanoparticles were lyophilized with 10% mannitol as cryoprotectant for 48 hr, mannitol was used to aid in the dispersion of the nanoparticles.
2.3. Characterization of Gem-SLNs
2.3.1. Particle size and zeta potential determination of Gem-SLNs
The hydrodynamic diameter and zeta potential values of the 24 Gem-SLN formulations were determined by using Particle Sizing Systems (Santa Barbara, CA). Prior to this, the instrument was calibrated with particle size and zeta standard solutions.
2.3.2. Determination of drug entrapment efficiency and drug loading efficiency
The entrapment efficiency (EE) and loading efficiency (LE) of Gem were measured by reverse-phase high-performance liquid chromatographic (RP-HPLC) system (Waters Corporation, Milford, MA) equipped with an auto-sampler, photo diode array (2998 UV/Vis) detector and pumps with reversed-phase column of Zorbrax SB-C18 column 4.6 mm × 250 mm, (5μm). Flow rate and injection volume were kept at 1.0 ml/min and 20 μl respectively at ambient temperature throughout the analysis. The mobile phase consisted of 5% acetonitrile in 10mM dihydrogen phosphate buffer, pH adjusted to 3 with trifluoroacetic acid and detection was performed at wavelength of 266 – 268 nm (Lanz et al., 2007).
2.3.3. Assay validation and recovery
A calibration curve was prepared using peak areas of respective concentrations of Gem. Linear regression analysis of the calibration data was performed by using the equation y = mx + c, where y is the peak area generated by Gem, x is the concentration of Gem, and m and c are the slope and intercept, respectively.
2.3.4. Encapsulation efficiency (EE)
For the determination of EE, 0.5 mL of freshly prepared Gem-SLN was weighed and dissolved in 1.5 mL solution made of a mixture of ethyl acetate and methanol (1:1), vortexed for 30 seconds and centrifuged at 6,000 rpm for 10 min at room temperature. One milliliter (1.0 mL) of the obtained supernatant was reconstituted with 1.0 mL of the mobile phase and centrifuged at 13,500 rpm for 10 min. The final supernatant was filtered through 0.22μm filter membrane and analyzed for the presence of Gem. The EE% was estimated by using equation (1).
2.3.5. Loading efficiency (LE)
Similarly, a drug loading efficiency was calculated by determined the amount of Gem in 0.5 mg of lyophilized Gem-SLN as indicated above. The percentage drug LE was determined using equation (2):
| (1) |
| (2) |
Where AE is the amount of drug entrapped, A| is the initial drug amount, AL is the amount of lipid used and AS is the amount of surfactant used.
2.3.6. Differential scanning calorimetry (DSC)
Interactions between SLN components and loaded Gem were investigated by using DSC. DSC analysis was performed on GMS, pure poloxamer 188, Gem-SLN4, Gem-SLN15 and Gem-SLN21. Prior to DSC analysis, the instrument was equilibrated for 60 min where flow rate was set at 30 mL/min and the pressure was set at 15 psi. Five milligrams (5 mg) of solid or lyophilized sample was weighed into hermetic aluminium pan and carefully sealed with a lid. The nitrogen flow rate was kept at 30 mL/min and temperature was initially increased from room temperature to 60°C at the rate of 5°C/min.
2.3.7. Fourier Transform Infrared (FTIR) spectroscopy
To study the functionalization of Gem-SLN, chemical characterization was done by using FTIR. FTIR analysis was performed on GemHCl, Tween 80, GMS, Gem-SLN4 and Gem-SLN15. About 5 mg of each sample was placed on the sample holder, pressed and scanned over spectral range of 4000 – 550 cm−1 at a best spectral resolution of 0.5 cm−1 (PerkinElmer Spectrum 100 FT-IR Spectrometer)
2.3.8. Determination of rheological properties of Gem-SLNs
Rheological studies were conducted on Gem-SLN4, Gem-SLN15 and Gem-SLN21 at 37°C with AR 1500ex rheometer (New Castle, DE). At a cone angle of 1.0° and cone diameter of 20.0 mm, 500 μL of formulation was applied at loading gap of 1000.0 μm. The shear stress as a function of shear rate was determined and the data fitted into the Power law model (provided below) to determine the viscosity and type of flow of the formulations.
| (3) |
Where σ is the shear stress, k is the consistency coefficient, γ is the shear rate and n is the flow behavior index. A plot of log γ against log σ was used to determine whether the formulations would exhibit a Newtonian or Non-Newtonian flow.
2.4. In-vitro release studies
Free GemHCl and all SLN formulations that entrapped 50% or more of Gem (Gem-SLN4, Gem-SLN10, Gem-SLNn, Gem-SLN13, Gem-SLN15, Gem-SLN16, Gem-SLN17, Gem-SLN20, Gem-SLN21) were used to conduct in-vitro Gem release studies at 37 ± 0.5 °C. Briefly, an amount of i50 mg of lyophilized Gem-SLN sample was suspended in i.0 mL of PBS, pH 7.4 and placed in a dialysis bag (MWCO = 3,500 Da, diameter = 29.0 mm) and clamped both ends. The dialysis bag containing Gem-SLN suspension was submerged in 5.0 mL PBS (pH 7.4) release volume (receiver chamber) and rotated at 200 rpm. To maintain sink condition, every i.0 mL of aliquot removed from the receiver chamber was subsequently replaced with i.0 mL of fresh PBS at the same temperature. For the control, 1.0 mg of GemHCl was dissolved in 2.0 mL PBS, pH 7.4, and 1.0 mL of this solution (equivalent to 0.05 w/v % GemHCl, Tables 1 and 2) was placed in a dialysis bag and determined Gem diffusion across the dialysis membrane using the dialysis method described. Samples were removed from the receiver chamber according to the following time points 0.083, 0.167, 0.25, 0.5, 1, 2, 4, 6, 12, 24, 48 and 72 hr.
Table 1:
Solid lipid nanoparticles (SLN) with Poloxamer 188 as surfactant
| Formulation | GMS (w/v%) | Poloxamer 188 (w/v%) | GemHCl (w/v%) |
|---|---|---|---|
| Gem-SLN1 | 1.0 | 1.5 | 0.05 |
| Gem-SLN2 | 1.0 | 2.5 | 0.05 |
| Gem-SLN3 | 1.0 | 3.5 | 0.05 |
| Gem-SLN4 | 1.0 | 4.5 | 0.05 |
| Gem-SLN5 | 1.5 | 1.5 | 0.05 |
| Gem-SLN6 | 1.5 | 2.5 | 0.05 |
| Gem-SLN7 | 1.5 | 3.5 | 0.05 |
| Gem-SLN8 | 1.5 | 4.5 | 0.05 |
| Gem-SLN9 | 1.5 | 1.5 | 0.05 |
| Gem-SLN10 | 2.0 | 2.5 | 0.05 |
| Gem-SLN11 | 2.0 | 3.5 | 0.05 |
| Gem-SLN12 | 2.0 | 4.5 | 0.05 |
Table 2:
Solid lipid nanoparticles (SLN) with Tween 80 as surfactants
| Formulation | GMS (w/v%) | Tween 80 (w/v%) | GemHCl (w/v%) |
|---|---|---|---|
| Gem-SLN13 | 1.0 | 1.5 | 0.05 |
| Gem-SLN14 | 1.0 | 2.5 | 0.05 |
| Gem-SLN15 | 1.0 | 3.5 | 0.05 |
| Gem-SLN16 | 1.0 | 4.5 | 0.05 |
| Gem-SLN17 | 1.5 | 1.5 | 0.05 |
| Gem-SLN18 | 1.5 | 2.5 | 0.05 |
| Gem-SLN19 | 1.5 | 3.5 | 0.05 |
| Gem-SLN20 | 1.5 | 4.5 | 0.05 |
| Gem-SLN21 | 2.0 | 1.5 | 0.05 |
| Gem-SLN22 | 2.0 | 2.5 | 0.05 |
| Gem-SLN23 | 2.0 | 3.5 | 0.05 |
| Gem-SLN24 | 2.0 | 4.5 | 0.05 |
2.4.1. Kinetic modeling
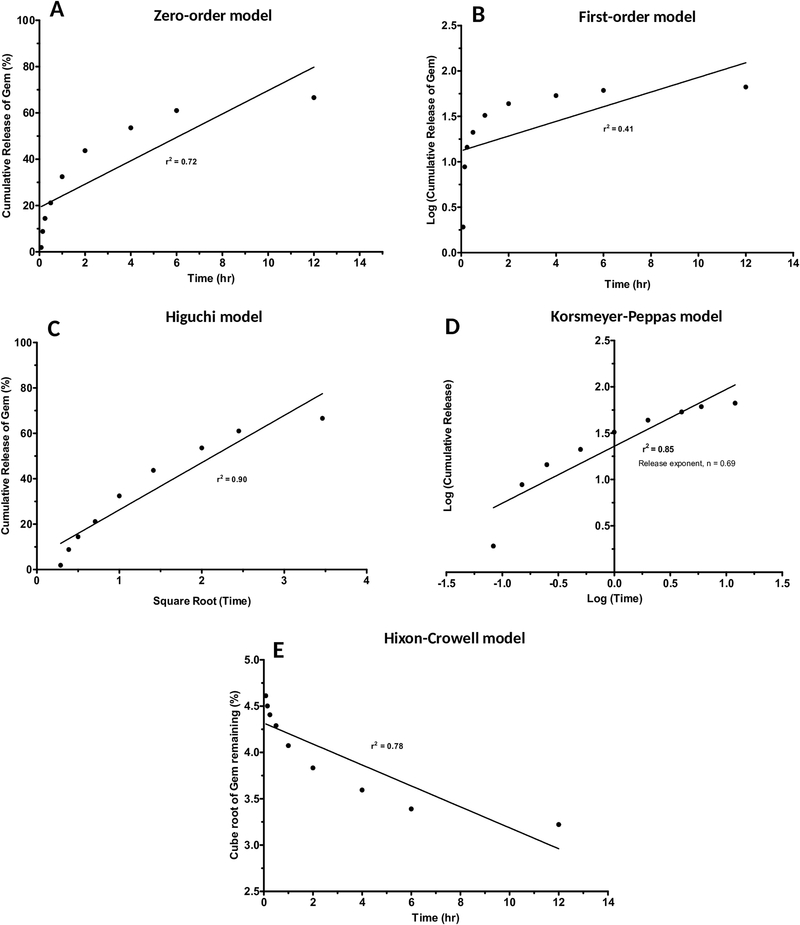
After in-vitro release studies of Gem from SLN15, data was fitted in various kinetic models and best fitting model was determined by correlation coefficient (R2) value. The highest r2 value indicates the best-fit model. The different models applied for Gem release from SLNs were zero- order release, first-order release, Higuchi’s model, Korsmeyer–Peppas model and Hixon–Crowell model. The data were analyzed using mathematical model equations as provided below.
Zero-order kinetics
| (4) |
Where Co is the initial amount of drug, C is the cumulative amount Gem released at time “t” and Ko is zero-order release constant (Siepmann and Siepmann, 2013). For zero-order kinetics, data obtained from Gem in-vitro release was plotted as percent cumulative of Gem released (% C) versus time.
First-order kinetics
| (5) |
Where Co is the initial amount of drug, C is the cumulative amount of Gem released at time “t” and K1 is the first order release constant (Dash et al., 2010). For First-order kinetics, data obtained from Gem in-vitro release was plotted as log percent cumulative of Gem released (% C) versus time.
Higuchi’s Model
A Higuchi model was used to determine whether the Gem release mechanism followed Fickian type of diffusion as shown below (Siepmann and Peppas, 2011):
| (6) |
Where C is the cumulative amount of Gem release at time, t and KH is the Higuchi constant. Data obtained from Gem in-vitro release was plotted as percent cumulative of Gem released (% C) versus square root of time.
Korsemeyer-Peppas Model
The Korsmeyer-Peppas model was used to model ≤ 60% of the cumulative drug release data to determine the existence of an anomalous type of release.
| (7) |
Where C is the cumulative amount of Gem released at the time t, KKP is the Korsmeyer-Peppas constant and n is release exponent, which was used to describe the release mechanism (Siepmann and Siepmann, 2013). To study the release kinetics, data obtained from in-vitro Gem release studies were plotted as log cumulative percentage of Gem released versus log time.
Hixson-Crowell Model
A Hixson-Crowell model was applied to investigate whether Gem release was by dissolution and change in carrier surface area or diameter (Tığlı Aydin and Pulat, 2012):
| (8) |
Where Co is the initial amount of Gem and C is the cumulative amount of Gem released at time ‘t’ and KHC is the Hixson-Crowell constant. To study Hixson-Crowell model, a cube root of the initial amount minus the cube root of percent remaining was plotted against time, t.
2.5. Transmission electron microscopy (TEM) measurement
The morphology of Gem-SLN15 was observed by TEM (JEOL) at 120 kV. A drop of the Gem-SLN15 suspension was placed on a carbon-coated copper grid and was negatively stained by 1% ammonium molybdate and allowed to dry and viewed by JEM-ARM200cF TEM.
2.6. In-vitro cytotoxicity studies
2.6.1. Cytotoxicity of Gem-SLNs against 2D Mia-PaCa-2 and PPCL-46 cultures
MIA-PaCa-2 or PPCL-46 cells were plated in 96-well plates at a seeding density of 1.2 × 10³ per well with DMEM enriched with10% fetal bovine serum (FBS). Mia-PaCa-2 and PPCL-46 cells were incubated at 5% CO2 and temperature of 37°C. At 70–75% confluency, the 2D Mia-PaCa-2 or 2D PPCL-46 cultures were treated with GemHCl, Gem-SLN4, Gem-SLN15 and Gem-SLN21 at 10, 20, 40, 80 and 120 μM. Equivalent Gem concentrations of Gem-SLN4, Gem-SLN15 and Gem-SLN21 were used and diluted with culture medium. While 2D Mia-PaCa-2 and PPCL-46 controls were exposed to drug free culture medium. After 48 hr of incubation period, the spent media were removed and the wells washed (x3) with PBS. Next, 20 μL of 0.05% of Alamar® blue solution was added to each well containing and incubated for 4 hr. After 4 hr, fluorescence intensity per well was determined on the fluorimeter at an excitation wavelength of 560/580 nm and emission wavelength of 590/610 nm and percentage viability calculated from the fluorescence measured (Diaz Osterman et al., 2016). To evaluate the cytotoxic effects of blank SNL15 against 2D and 3D models of MiaPaCa-2 and PPCL-46 cultures, freshly prepared blank SNL15 formulation was exposed to the 2D and 3D MiaPaCa-2 and PPCL-46 cultures in mixed medium made up of a growth medium (GM) and blank SNL15 formulation in a ratio of 2:1 or 1:1 respectively.
2.6.2. Cytotoxicity of Gem-SLNs against 3D (spheroids) MIA-PaCa-2 and PPCL-46 cultures
For spheroid formation, Mia-PaCa-2 and PPCL-46 cells were seeded in Nunclon Spera® (promote cancer 3D spheroid formation) 96-well plates at a cell density of 5.0 × 10⁴ and 2.0 × 10⁴ in 200 μL/well respectively and incubated at optimum growth conditions (5% CO2 and 37°C) for 72 hr to allow formation of spheroids. For drug induced cytotoxicity studies, similar concentrations of free GemHCl, Gem-SLN4, Gem-SLN15 or Gem-SLN21 were used to treat MIA-PaCa-2 and PPCL-46 spheroids as described above (Wen et al., 2013). After 48hr of incubation period, 50 μL of 0.05% Alamar® blue was added to each well and spheroid dispersed gently followed by 4 hr incubation. The fluorescence intensities were measured as described under 2D viability studies section above (Diaz Osterman et al., 2016; Wen et al., 2013). In all, the most effective Gem-SLN formulation, Gem-SLN15, was used for apoptosis studies.
The IC50 values (i.e. concentration resulting in 50% growth inhibition) of GemHCL and Gem-SLN15 were graphically calculated from concentration-effect curves, considering the optical density of the control well as 100%.
2.7. Apoptosis studies
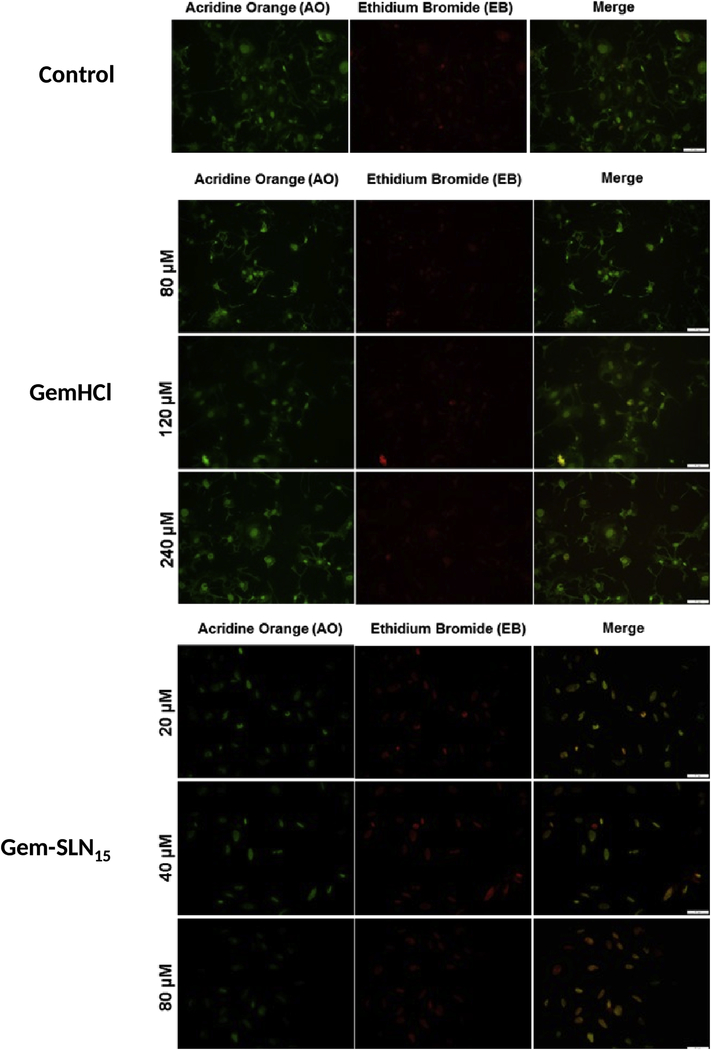
In apoptotic studies, PPCL-46 cells were treated with free GemHCl at concentrations of 80, 120 and 240 μM whereas; 20, 40 and 80 μM of Gem equivalent of Gem-SLN15 were used. More importantly, Gem concentrations for the apoptosis studies were based on the IC50 values previously determined. Prior to treatment, MIA-PaCa-2 or PPCL-46 cells were seeded at a density of 1.2 × 10³ per well in 96-well plates and allowed to reach a confluence of about 70–75% followed by GemHCl or Gem-SLN15 exposure for 24 hr. After 24 hr period of incubation, MIA-PaCa-2 or PPCL-46 cells were washed 3 times with sterile PBS, fixed with 4 % formalin for 20 min at room temperature. Finally, the formalin-treated cells were permeated with 0.1% Triton-X. Next, cells were incubated with 20 μL mixture of acridine orange (AO)/ethidium bromide (EB) (ratio 1:1) for 30 min and washed 3 times with sterile PBS (pH 7.4). Plates were examined under an Olympus fluorescence microscope.
2.8. Stability studies
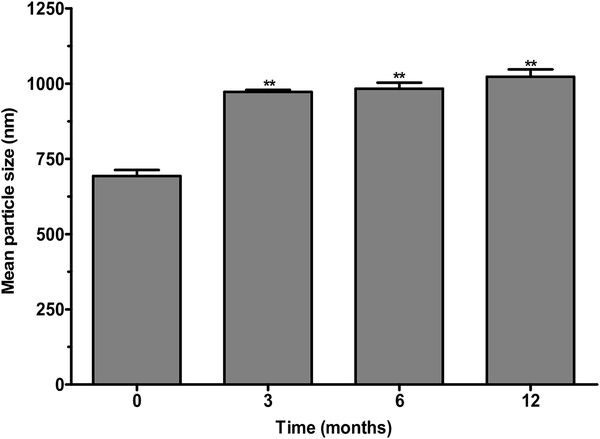
Stability of Gem-SLN15 was performed after storage at a temperature of 4°C. Prior to storage, freshly prepared Gem-SLN15 was lyophilized with mannitol and sealed in vials for storage at a temperature of 4°C. Sampling frequency was 3, 6 and 12 months of storage. At these time points, Gem-SLN15 was dispersed in PBS and analyzed for particle size and percent Gem release.
For particle size determination, 10 mg of lyophilized sample was weighed and dispersed in PBS by vortexing for 5 min. Gem-SLN15 particle size was determined as described under the particle size and zeta potential determination of Gem-SLNs.
For Gem release, 15 mg of the sample was weighed and dispersed in 1 mL of PBS (1x). One milliliter (1 mL) of a mixture ethyl acetate and isopropanol (1:1) was added to the dispersed solution to yield 2 mL of total volume and then centrifuged at 3000 rpm for 3 min. After, 1 mL of supernatant was filtered through filter membrane (0.8 μm) and diluted to 2 mL with mobile phase for HPLC analysis. HPLC analysis was performed in a similar manner as described under in-vitro release studies.
2.9. Statistical analysis
Data was presented as means ± standard deviation and statistical difference between GemHCl and Gem-SLNs was determined by using one-way ANOVA with Tukey comparisons, student’s t-test and considered significant at p < 0.05. All experiments were performed at least in triplicate and analyzed using GraphPad Prism software (GraphPad Software, Inc., La Jolla, CA, USA).
3. Results and Discussion
3.1. Characterization of Gem-SLNs
3.1.1. GMS and poloxamer effects on Gem-SLN particle size and drug entrapment
For poloxamer-188 made Gem-SLNs, varying poloxamer-188 amount (1.5–4.5 w/v %), while maintaining GMS amount at 1.0 w/v %, the particle size of the formulations (Gem-SLN1 to Gem-SLN4) was found between 565 nm to 684 nm. Whereas, the estimated percent Gem entrapment ranged from 16.5 to 56.6 % (Tables 1 and 3).
Table 3:
Mean particle size, polydispersity index, mean, entrapment efficiency (%EE) and loading efficiency (% LE) of Poloxamer 188
| Formulation | Mean Particle size (nm) | Polydispersity index | Mean Zeta Potential (mV) | % Entrapment Efficiency (% EE) | % Loading Efficiency (% LE) |
|---|---|---|---|---|---|
| Gem-SLN1 | 565 ± 66 | 0.197 ± 0.03 | −27.1 ± 0.5 | 16.5 ± 0.1 | 0.77 |
| Gem-SLN2 | 676 ± 69 | 0.134 ± 0.01 | −25.1 ± 1.3 | 43.5 ± 2.2 | 0.86 |
| Gem-SLN3 | 584 ± 16 | 0.352 ± 0.12 | −23.6 ± 0.2 | 20.0 ± 1.0 | 0.69 |
| Gem-SLN4 | 684 ± 49 | 0.146 ± 0.03 | −22.1 ± 0.9 | 56.6 ± 5.4 | 0.84 |
| Gem-SLN5 | 264 ± 2 | 0.204 ± 0.02 | −29.9 ± 0.9 | ND | NA |
| Gem-SLN6 | 279 ± 8 | 0.192 ± 0.01 | −33.3 ± 0.4 | 47.0 ± 3.6 | 0.85 |
| Gem-SLN7 | 228 ± 5 | 0.109 ±0.01 | −31.4 ± 0.7 | ND | NA |
| Gem-SLN8 | 334 ± 6 | 0.191 ± 0.01 | −29.1 ± 0.3 | ND | NA |
| Gem-SLN9 | 545 ± 20 | 0.395 ± 0.07 | −24.9 ± 0.2 | ND | NA |
| Gem-SLN10 | 470 ± 3 | 0.218 ± 0.04 | −25.0 ± 1.4 | 53.2 ± 2.8 | 0.86 |
| Gem-SLN11 | 518 ± 22 | 0.252 ± 0.01 | −22.4 ± 0.4 | 51.1 ± 2.2 | 0.82 |
| Gem-SLN12 | 459 ± 12 | 0.236 ± 0.11 | −25.8 ± 0.9 | ND | NA |
Data represents mean ± SD, n = 3.
ND = Gem was not detected
In the next batch of formulations, Gem-SLN5 to Gem-SLN8, where GMS amount was kept at 1.5 w/v % and poloxamer-188 amount was varied from 1.5 to 4.5 w/v %, we found the particle sizes to range from 264 to 334 nm. However, we were disappointed to find that none of these formulations was able to entrap any detectable amount of Gem except SLN6 that entrapped 47 % of Gem.
In another batch of formulations, GMS amount was maintained at 2.0 w/v % and varied poloxamer-188 amount (1.5 to 4.5 w/v %); the obtained formulations, Gem-SLN9 to Gem-SLN12, had particle sizes ranging from 459 to 545 nm. Among this group, only formulations Gem-SLN10 and Gem-SLN11 entrapped 53.2 and 51.1 % of Gem respectively. The others failed to entrap any detectable amount of Gem (Tables 1 and 3).
3.1.2. GMS and Tween 80 effects on Gem-SLN particle size and drug entrapment
While maintaining GMS amount at 1.0w/v % and varying Tween 80 amount (1.5–4.5 w/v %), particle sizes observed for formulations Gem-SLN13 to Gem-SLN16 was between 481 nm to 603 nm with estimated Gem entrapment ranging from 46.5 to 68.3 % (Tables 2 and 4). In the next 2nd batch, GMS amount was kept at 1.5 w/v % and Tween 80 amount was varied (1.5 – 4.5 w/v %), we found the particle sizes of formulations Gem-SLN17 to Gem-SLN20 to range from 510 to 581 nm with entrapment of Gem ranging from 36.1 to 60.3 %. Only one formulation, Gem-SLN19, appeared to contain undetectable amount of Gem.
Table 4:
Mean particle size, polydispersity index, mean, entrapment efficiency (%EE) and loading efficiency (% LE) of Tween 80
| Formulation | Mean Particle size (nm) | PI | Mean Zeta Potential (mV) | % Entrapment Efficiency (% EE) | % Loading Efficiency |
|---|---|---|---|---|---|
| Gem-SLN13 | 481 ± 62 | 0.153 ± 0.04 | −23.0 ± 0.3 | 55.8 ± 4.2 | 1.20 |
| Gem-SLN14 | 538 ± 18 | 0.171 ± 0.02 | −24.3 ± 2.1 | 46.5 ± 9.4 | 0.66 |
| Gem-SLN15 | 603 ± 19 | 0.266 ± 0.07 | −24.9 ± 0.2 | 68.3 ± 4.8 | 0.75 |
| Gem-SLN16 | 548 ± 22 | 0.201 ± 0.02 | −12.4 ± 0.1 | 55.2 ± 6.9 | 0.49 |
| Gem-SLN17 | 514 ± 0.71 | 0.151 ± 0.06 | −28.5 ± 0.2 | 60.3 ± 7.4 | 0.99 |
| Gem-SLN18 | 510 ± 2 | 0.157 ± 0.01 | −25.0 ± 0.8 | 36.1 ± 4.2 | 0.45 |
| Gem-SLN19 | 559 ± 10 | 0.219 ± 0.04 | −28.8 ± 0.4 | ND | NA |
| Gem-SLN20 | 581 ± 11 | 0.137 ± 0.02 | −27.6 ± 0.2 | 50.8 ± 1.8 | 0.42 |
| Gem-SLN21 | 387 ± 25 | 0.118 ± 0.04 | −34.1 ± 0.5 | 57.8 ± 3.5 | 0.82 |
| Gem-SLN22 | 390 ± 21 | 0.088 ± 0.06 | −29.4± 0.2 | 35.6 ± 0.6 | 0.39 |
| Gem-SLN23 | 512 ± 16 | 0.132 ± 0.08 | −27.9 ± 1.0 | 27.7 ± 0.1 | 0.25 |
| Gem-SLN24 | 531 ± 29 | 0.115 ± 0.03 | −28.9 ± 0.5 | ND | NA |
Data represents mean ± SD, n = 3.
ND = Gem was not detected
In the last batch of formulations (Gem-SLN21 and Gem-SLN24), we increased the GMS amount to 2.0 w/v % and varied Tween 80 amount. The observed particle sizes ranged from 387 to 531 nm while the estimated Gem entrapment was between 27.7 to 57.8 % (Tables 2 and 4).
Overall, Gem-SLN15 had the highest % EE as shown in Tables 3 and 4. While varying amount of GMS did not appear to have any significant influence on particle size and Gem entrapment, type of surfactant and amount used remarkably influenced Gem-SLN particle size and entrapment efficiency. Tween 80 made Gem-SLNs appeared to have larger particle size (390–603 nm) and higher entrapment efficiency (27.7 to 68.3 %) compared with poloxamer-188 made Gem-SLNs which seemed to have relatively smaller particle sizes (228 nm to 264 nm). In addition, the findings seemed to suggest that entrapment of Gem by SLN was largely influenced by poloxamer-188 (Ekambaram and Abdul, 2011). Based on the overall findings on particle size, cytotoxicity and entrapment efficiency (Tables 1, 2, 3 and 4), Gem-SLN15 exhibited the highest Gem entrapment and most cytotoxicity activity.
3.1.3. Differential scanning calorimetry (DSC)
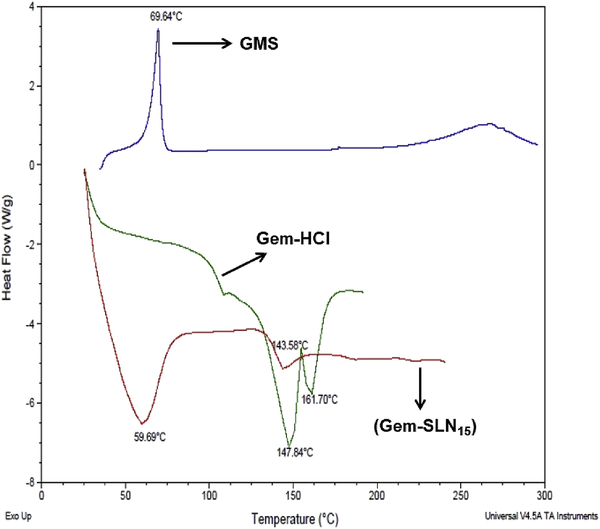
Thermal investigation of GMS and Gem-SLN15 via DSC analysis was used to study the drug-lipid interaction. It is important to emphasize that Gem-SLN15 was selected based on its high Gem entrapment. The DSC spectrum of Tween 80 Gem-SLN15 showed a broad melting point (Tm) at a temperature of 59.69 °C (Figure 1) while GemHCl melting peak occurred at 143.58 °C. The broad endothermic transition observed at 59.69 °C may be attributed to the large surface area of the dispersed nano-size particles. Based on the DSC data, we further suggested that the formation of SLN may require less energy hence the lower melting point (Patel et al., 2014). The observed thermogram was consistent with thermogram obtained in other studies involving the combination of Tween 80 and GMS (Lv et al., 2009; Patel et al., 2014).
Figure 1:
DSC thermograms of pure GMS, Gem (GemHCl) and Tween containing Gem-SLN15.
3.1.4. FTIR Analysis
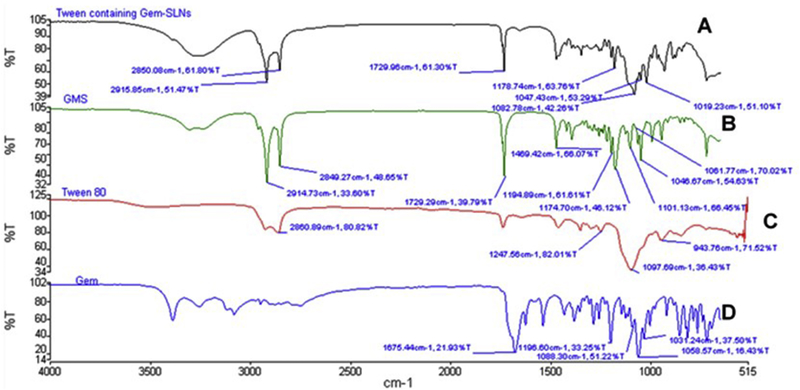
Gem-lipid interaction in the SLN was further investigated by using FTIR spectroscopy. The spectrum of Gem-SLN15 (Tween containing formulation) exhibited prominent peaks of GMS at 2850 cm−1 and 2915 cm−1 while peaks characteristic of Tween 80 occurred at 1729 cm−1 and 1469 cm−1 Figure 2A. As observed in the IR spectrum, characteristic peaks of Gem occurred at 1675.44 cm−1 and 1660 cm−1 possibly due to amine bending vibrations (Khare et al., 2016). Other characteristic peaks of Gem occurred at 3300–3500 cm−1 (single sharp peak), and 3000 – 3200 cm−1 (two sharp peaks). These peaks may be attributed to the −OH stretching and −NH2 stretching vibrations in the formulation (Dora et al., 2017).
Figure 2:
FTIR spectra of Tween 80 containing Gem-SLN15 (A), GMS (B), Tween 80 (C) and Gem (GemHCl).
The unique sharp peaks of Gem observed between 3000 and 3500 cm−1 in Figure 2D were not significantly visible in Tween 80 containing Gem-SLN15 spectrum which displayed wide broad band between 3000 and 3500 cm−1 with no distinct sharp peaks (Figure 2A). This is probably due to the interaction between Gem and SLN15. In comparison of GMS and Tween 80 containing Gem-SLN15 spectra, we found that the Gem-SLN15 band between 3000 and 3500 cm−1 had a broader and deeper trough than that of GMS band; however, the GMS shape peaks at 2642 cm−1 and 2914 cm−1 appeared to be present but reduced in the Gem-SLN15 spectrum. It is important to point out that the interaction between Gem and SLN15 could influence the release behavior and extent of Gem release from the SLN delivery system (Patel et al., 2014).
3.1.5. Rheological properties of Gem-SLN
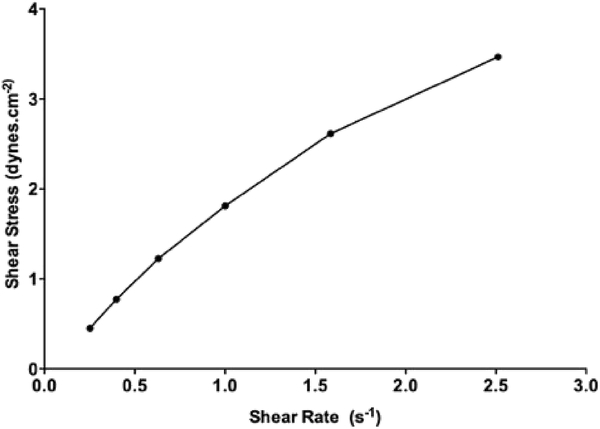
Among the 24 different formulations, only Gem-SLN15 was selected for rheological analysis because of its remarkable Gem entrapment efficiency and significant anticancer activity. Shear stress as a function of shear rate was measured to determine the viscosity and type of flow. Rheogram of Gem-SLN15 depicted a linear relationship between the shear rate and the shear stress as shown Figure 3. Further, Power Law model which is used to determine flow behavior index (n), was used to analysis the flow behavior of Gem-SLN15. Based on the model, the obtained n-value for Gem-SLN15 was determined to be less than 1.0 an indicative of a pseudoplastic behavior (Table 5) (Mady et al., 2009).
Figure 3:
Rheogram of shear stress against shear rate of Gem-SLN4, Gem-SLN15 and Gem-SLN21. Data represented as mean ± S.D, n = 3
Table 5:
Rheological properties of Gem-SLN4, Gem-SLN15 and Gem-SLN21
| Formulation | Viscosity (dynes.cm−2s) | Flow behavior index, n | Flow Type |
|---|---|---|---|
| Gem-SLN15 | 1.33 ± 0.03 | 0.88 ± 0.01 | Pseudoplastic |
Data represents mean ± SD, n = 3.
3.2. In-vitro release kinetics
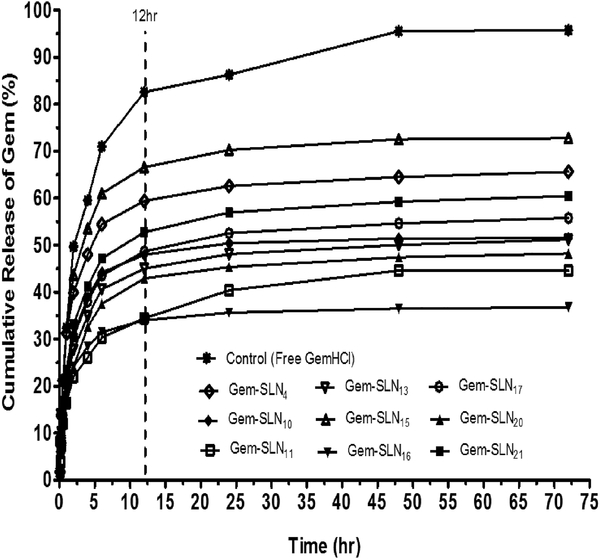
Prior to the selection of the most effective formulation, formulations with more than 50% entrapment of Gem were initially selected for in-vitro release kinetics. In general, all the selected formulations (Gem-SLN4, Gem-SLN10, Gem-SLN11, Gem-SLN13, Gem-SLN15, Gem-SLN16, Gem-SLN17, Gem-SLN20 and Gem-SLN21) exhibited initial burst release of Gem within the first 12 h followed by fairly constant Gem release in the next 60 hr period as shown in Figure 4.
Figure 4:
In-vitro percent cumulative Gem release versus time profiles of free GemHCl and Gem-SLN formulations that entrapped at least 50% of Gem (Gem-SLN4, Gem-SLN10, Gem-SLN11, Gem-SLN13, Gem-SLN15, Gem-SLN16, Gem-SLN17, Gem-SLN20 and Gem-SLN21).
Despite the burst release, only Gem-SLN4, Gem-SLN15 and Gem-SLN21 were able to release 65.63%, 72.78% and 60.49 % of Gem in the first 12 hr respectively compared with the others that released less than 50% (Figure 4). There are number of factors that may account for burst release such as the nature of the delivery system and the percent of drug on the surface of the delivery system; however, the most critical factor was to determine the release mechanism of the delivery system (Geszke-Moritz and Moritz, 2016).
To determine the release mechanism of Gem from SLN delivery system, we chose the SLN formulation with the highest in-vitro Gem release which was Gem-SLN15 and performed in-vitro release kinetics. For the release kinetic studies, zero-order, firstorder, Higuchi plot, Korsemeyer-Peppas plot and Hixson Crowell plot were used as models to investigate the release mechanism (Figure 5). The best-fit model was determined by comparing the correlation coefficients (r2) of the all models. Only models with r2 values equal to or greater than 0.9 (r2 ≥ 0.9) were considered. Based on r2 values, only Higuchi plot was deemed to exhibit a high degree of linearity as observed in Figure 5 (r2 = 0.90), an indicative of diffusional mechanism as postulated by the Higuchi plot (Vaghasiya et al., 2013). This model is based on hypothesis that drug diffusion takes place only in one dimension and that swelling of matrix and dissolution are considered to be less or negligible while maintaining sink condition (Tiyaboonchai et al., 2007).
Figure 5:
In-vitro Gem release kinetics models by SLN: Zero-order (A), First-order (B), Higuchi plot (C), Korsemeyer-Peppas plot (D) and, Hixson-Crowell plot (E).
3.3. Transmission electron microscopy (TEM) measurement
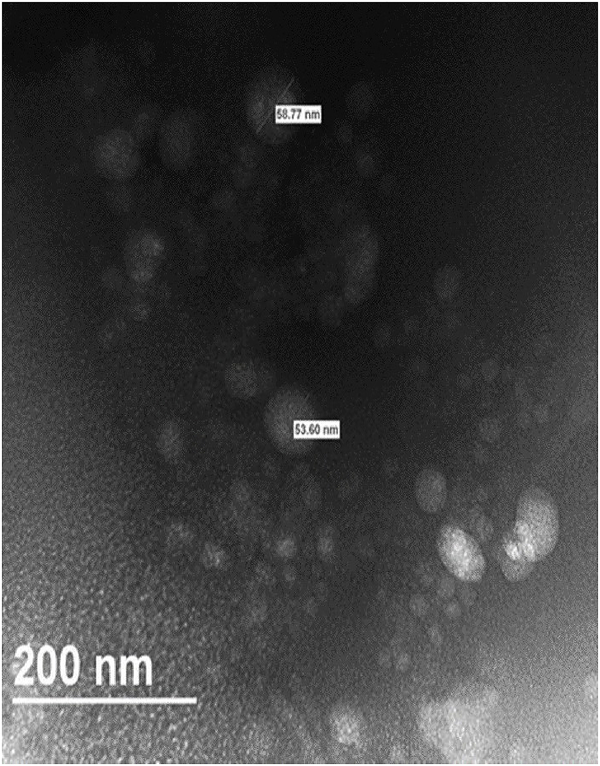
TEM image of Gem-SLN15 suspension evidently showed spherical nanoparticles with sizes significantly smaller than the hydrodynamic (Figure 6). As expected, average particle size obtained by TEM was significantly smaller than the average size obtained by using dynamic light scattering (DLS) as shown in Table 4. The difference in size could be ascribed to the principle involved in the analysis of particle size in both DLS and TEM techniques as well as sample preparation. The principle for DLS determination is based on the light scattering effect rather than “measuring” the actual particle size (Zheng et al., 2013). This implies that larger particles in the suspension may increase light scattering more than smaller particles hence shifting the particle size measurement towards larger values (Souza et al., 2016). Contrary, TEM analysis is strongly inclined towards smaller particle size determination as larger particles have dimensions that may exceed the thickness of the thin film applied to the grid. Another difference between the two techniques is that, DLS measures hydration sphere diameter of the particle while TEM measures naked particle (dry form). It is therefore important that DLS and TEM particle sizes comparison and interpretation be done with great caution (Jores et al., 2004).
Figure 6:
TEM micrograph of Gem-SLN15. The nanoparticle was counterstained with 1% ammonium molybdate
3.4. In-vitro cytotoxicity studies in 2D and 3D cultures
3.4.1. Viability studies of MiaPaCa-2 and PPCL-46 cells
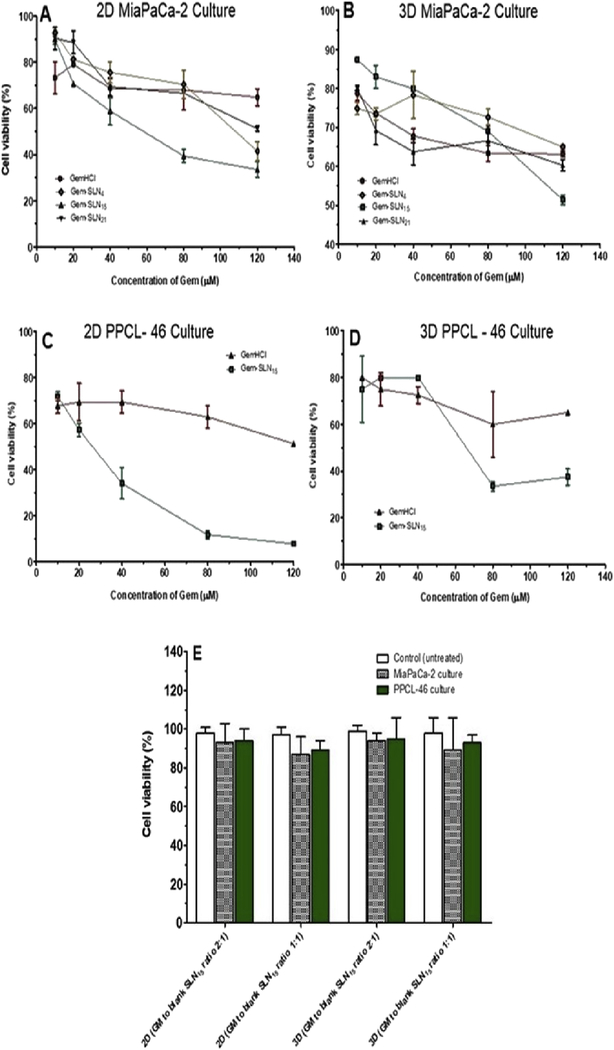
Based on in-vitro Gem release profiles of Gem-SLN4, Gem-SLN10, Gem-SLN11, Gem-SLN13, Gem-SLN15, Gem-SLN16, Gem-SLN17, Gem-SLN20 and Gem-SLN21 (Figure 4), the first 3 formulations with highest Gem release (Gem-SLN4, Gem-SLN15 and Gem-SLN21) including GemHCl were selected and tested on 2D and 3D MiaPaCa-2 cells which we used as our reference cells (Figure 7A and B). MiaPaCa-2 cells were chosen as reference cells because of their survival under continuous exposure to gemcitabine. Among the 3 Gem-SLN formulations tested against MiaPaCa-2 cells, Gem-SLN15 proved to be the most effective one (Figure 7A and B, and Table 6A). Based on this, we proceeded to investigate anticancer activities of Gem-SLN15 and GemHCI against 2D and 3D PPCL-46 cultures. As expected, Gem-SLN15 treated 2D and 3D PPCL-46 cultures were significantly inhibited compared with 2D and 3D GemHCl treated cultures (Figure 7C and D). This suggests that Gem-SLN15 is more efficacious than GemHCl. In all our cytotoxicity studies, GemHCl was compared with Gem-SLN formulations because GemHCl is considered to be the main chemotherapy drug used to treat pancreatic cancer patients either alone or with other chemotherapy drugs.
Figure 7:
Cytotoxicity of GemHCl and Gem-SLN formulations against Mia-PaCa-2 cells and PPCL-46 cells at different concentrations. GemHCl, Gem-SLN4, Gem-SLN15 and Gem-SLN21 anticancer activities against 2D Mia-PaCa-2 culture (A); GemHCl, Gem-SLN4 Gem-SLN15 and Gem-SLN21 anticancer activities against 3D Mia-PaCa-2 culture (B); GemHCl and Gem-SLN15 anticancer activities against 2D PPCL-46 culture (C); GemHCl and Gem-SLN15 anticancer activities against 3D PPCL-46 culture (D), and cytotoxic effects of blank SNL15 against 2D and 3D MiaPaCa-2 and PPCL-46 cultures (E). GM = growth medium.
Table 6A:
Cytotoxicity activity of GemHCl and Gem-SLNs against 2D and 3D MIA-PaCa-2 and PPCL-46 cultures
| Formulation | IC50 (2D MIA-PaCa-2 Culture) (μM) | IC50 (3D MIA-PaCa-2 Culture) (μM) |
| GemHCl | 188 ± 46 | 254 ± 52 |
| Gem-SLN4 | 103 ± 3 | 194 ± 24 |
| Gem-SLN15 | 56 ± 16 | 127 ± 4 |
| Gem-SLN21 | 122 ± 6 | 220 ± 52 |
| IC50 (2D PPCL-46 Culture) (μM) | IC50 (3D PPCL-46 Culture) (μM) | |
| GemHCl | 126 ± 3 | 241 ± 3 |
| Gem-SLN15 | 27 ± 5 | 66 ± 2 |
While Gem-SLN15 has proven to be more effective against MiaPaCa-2 and PPCL-46 cells, blank SLN15 effects on 2D and 3D MiaPaCa-2 and PPCL-46 cells were investigated. The results demonstrated that cellular viability was over 86% after incubation with the blank SLN15 for 72 hr (Figure 7E). There was no significant difference between the controls (untreated 2D and 3D MiaPaCa-2 and PPCL-46) and blank SLN15 treated 2D and 3D MiaPaCa-2 and PPCL-46 (Figure 7E). This suggests that blank SLN15 exhibited no significant cytotoxicity and as such it could be used as carriers of antitumor drugs.
The IC50 values for GemHCl treated 2D and 3D Mia-PaCa-2 cultures ((2D)188 ± 46 μM and (3D) 254 ± 52 μM) were significantly higher than the IC50 values for the 3 Gem-SLN formulations as shown in Figure 7(A and B) and Table 6A and B. Among the Gem-SLN formulations IC50 values, only Gem-SLN15 had the lowest IC50 value against Mia-PaCa-2 cultures ((2D) 56 ±16 μM vs (3D)127 ± 4 μM) (Tables 6A and B).
Table 6B:
Comparison of IC50 values of GemHCl and Gem-SLN15 treated MiaPaCa-2 and PPCL-46 groups based on one-way ANOVA followed by Turkey post-test
| Group comparison | P-value | Significant? |
|---|---|---|
| Gem-SLN15 treated-2D MiaPaCa-2 vs GemHCl treated-2D MiaPaCa-2 | 0.026 | Yes |
| Gem-SLN15 treated-3D MiaPaCa-2 vs GemHCl treated-3D MiaPaCa-2 | 0.025 | Yes |
| Gem-SLN15 treated-2D PPCL-46 vs GemHCl treated-2D PPCL-46 | 0.001 | Yes |
| Gem-SLN15 treated-3D PPCL-46 vs GemHCl treated-3D PPCL-46 | 0.001 | Yes |
The IC50 values of Gem-SLN15 treated cancer cells were significantly lower than GemHCl treated cancer cells.
P< 0.05
P< 0.01
P< 0.001
Based on the significant anticancer activity of Gem-SLN15 against Mia-PaCa-2 culture, GemHCl and Gem-SLN15 were chosen to treat 2D and 3D PPCL-46 cultures and compared their IC50 values (Tables 6A and B).
The IC50 values of Gem-SLN15 treated 2D and 3D PPCL-46 cultures ((2D) 27 ± 5 μM vs (3D) 66 ± 2 μM)) were remarkably lower than that of the IC50 values for GemHCl treated 2D and 3D PPCL-46 cultures (Tables 6A and B).
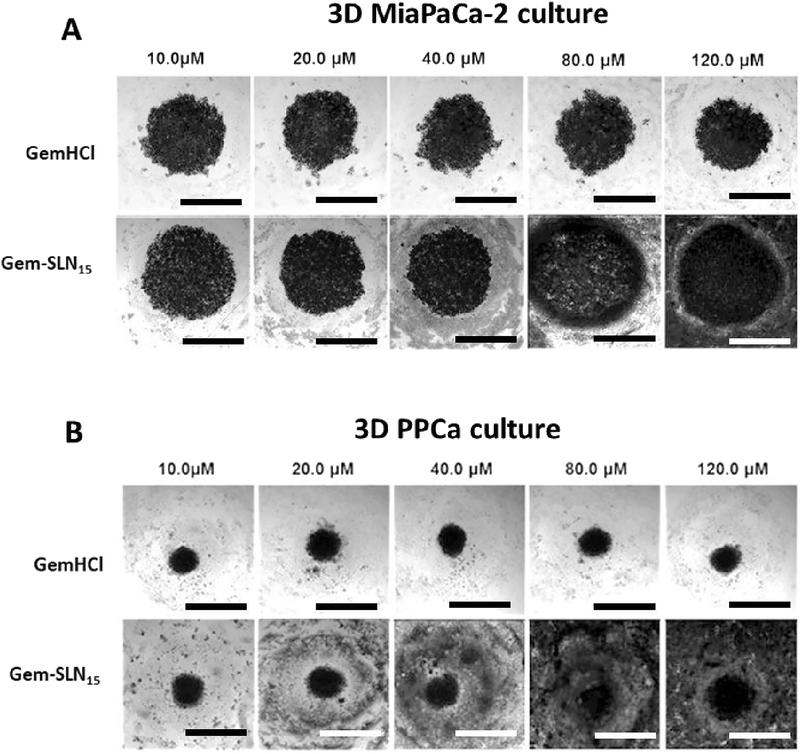
In Figure 8A and B, a general trend was observed where increasing concentration of Gem-SLN15 (Gem equivalent dose) was associated with increased spheroid surface area, increased spheroid volume and accompanied irregular or non-spheroid shapes. This is indicative of perturbed growth of spheroids and weak cell-cell adhesion. We suggest that these significant structural changes in the Gem-SLN15 treated MiaPaCa-2 and PPCL-46 spheroids may be attributed to enhance Gem antitumor activity by SLN15 (Figure 8A and B).
Figure 8:
Images of 3D MiaPaCa-2 (A) and 3D PPCL-46 (B) cultures after exposure to different concentrations (10 –120 μM) of GemHCl and Gem-SLN15 (at Gem equivalent dose). GemHCl or Gem-SLN15 treated 3D MiaPaCa-2 culture (immortalized established cells) appeared to increase in spheroid volume and surface area compared with 3D PPCL-46 culture (primary patient-derived pancreatic cells). Scale bar = 400 μm. Patient derived pancreatic cancer (PPCa) cells as seen in figure represents PPCL-46.
On the contrary, no significant structural changes were observed in GemHCl treated PPCL-46 spheroids (Figure 8B) suggesting that biological barriers developed by PPCL-46 spheroids might have restricted the intratumoral penetration and uptake of these polar drug molecules by the cancer cells (Kanat and Ertas, 2018). It therefore stands to reason that entrapping Gem into SLN would most likely improve the anticancer activity of the Gem by protecting it against rapid metabolism and improving its cellular uptake. In addition, 3D MiaPaCa-2 culture (immortalized established cancer cells) appeared to be significantly perturbed in the presence of GemHCl or Gem-SLN15 compared with 3D PPCL-46 culture (patient-derived pancreatic cancer cells).
3.5. Apoptosis studies via florescence microscopy
Acridine orange/ethidium bromide staining of Gem-SLN15 treated PPCL-46 cells revealed an induced apoptosis with a significant decline in cell viability in comparison with GemHCl as evident in Figure 9. In Figure 9, a significant number of viable cells were observed in a uniformly green color in the control (untreated) cells; while GemHCl treated PPCL-46 showed a high number of viable cells (in green). Further examination revealed that a few number of the treated PPCL-46 cells showed signs of cellular damage or stress as characterized by orange fluorescence (Merged image) especially at GemHCl concentrations of 120 μM and 240 μM (Figure 9). This is an indicative of fragmented nuclei and apoptosis.
Figure 9:
Acridine orange-ethidium bromide staining of PPCL-46 cells after exposure to different concentrations of GemHCl and Gem-SLN15 (at Gem equivalent dose). Early apoptotic cells: the nuclei of cells showed yellow-green fluorescence. Late apoptotic cells: the nuclei of cells showed orange fluorescence by EB staining. Necrotic cells: cells showed orange-red fluorescence. Scale bar = 400 μm (Magnification = 20x).
While GemHCl treated PPCL-46 cells experienced cellular damage/stress at higher concentration (120 μM or more), Gem-SLN15 treated PPCL-46 cells at lower concentrations of 40 μM and 80 μM (3 times lower than that of GemHCl concentration) experienced extreme cellular damage/stress. In addition, a careful examination of Gem-SLN15 treated PPCL-46 cells at lower concentrations showed a significant number of cells in intense orange fluorescence (merged image). This clearly suggests a late apoptosis phase with a possible loss of membrane integrity coupled with condensed nuclei fragmentation (Elmore, 2007). Given that Gem-SLN15 treated-PPCL-46 cells were significantly apoptotic at lower concentrations (20, 40 and 80 μM; at Gem equivalent dose) compared with GemHCl concentrations (80, 120 and 240 μM), we could suggest that SLN15 may have delivered Gem efficiently into the cancer cells leading to immense damage to the DNA.
3.6. Stability Studies
In this study, we focused on the particle size and Gem release as parameters to evaluate the stability of Gem-SLN15. Particle size measurement of lyophilized Gem-SLN15 revealed a significant increase in size (**p < 0.01) after 3, 6 and 12 month period (stored at 4°C) compared with the freshly prepared Gem-SLN15 (month = 0) (Figure 10). We should mention here that freshly prepared Gem-SLN15 solution was not lyophilized prior to particle size measurement. Although the lyophilized Gem-SLN15 size increased by an average of 1.3 folds over the 12 months period, lyophilization per se did not affect the release profile of Gem loaded SLN15 (Table 7). Employing 10% mannitol, as cryoprotectant, might have increased the dispersion of Gem-SLN15 (Nandini et al., 2015). It has been reported that slow transition of dispersed lipids from metastable to stable form and the contribution of emulsifiers are likely to cause drug loss from SLN during storage (Venkateswarlu and Manjunath, 2004). However, our formulation did not experience any significant loss when stored at 4°C
Figure 10:
Particle size measurement at different time periods during storage of lyophilized Gem-SLN15 at 4°C. Data expressed as mean ± S.D, n = 3, **p <0.01
Table 7:
In-vitro release profile of Gem from freshly prepared and lyophilized Gem-SLN15 at 37°C
| Number of months | 0 (freshly prepared) | 3 | 6 | 12 |
|---|---|---|---|---|
| % Gem released | 68.3 ± 4.8 | 67.3 ± 2.5 | 64.9 ± 1.8 | 63.3 ± 1.6 |
SLN15 over period of 12 months.
4. Conclusion
The anticancer activity of Gem-SLN15 was more effective than GemHCl. Also, PPCL-46 was significantly more sensitive to Gem-SLN15 than Mia-PaCa-2 cancer cells. These effects may involve, in part, the ability of SLN15 to enhance the delivery of Gem and improve its anticancer activity. While this might seem a modest result amongst two different pancreatic cancer cell lines, the heterogeneity of pancreatic cancer cells is present herein this study. Thus, emphasizing the importance of personalized approaches toward resilient cancers such as pancreatic cancer. Our study provides a platform to fully evaluate the cytotoxicity profiles of our formulations. It is worth noting that Gem-SLN15 would be PEGylated for all our future animal studies. It is also important to mention that the overarching goal is to pursue further studies in the tumor efficacy of Gem-SLN15 on PCa with patient-derived tumor xenografts with intact tumor microenvironment as a more representative model of PCa.
Acknowledgments
This research was supported by the National Cancer Institute (NIC) of the National Institutes of Health (NIH) under Award Numbers U54CA233396-01 and 5P20CA192990-04. The content is solely the responsibility of the authors and does not necessarily represent the official views of the National Institutes of Health. We thank Dr. Ebesoh Dexter Nkwenya of ED Illustrations, New York City, NY for assistance with graphic design.
Footnotes
Declaration of Interest: The authors report no conflict of interest and are solely responsible for the content and writing of this project.
The authors declare that they have no known competing financial interests or personal relationships that could have appeared to influence the work reported in this paper.
Competing Interests: The authors have declared that no competing interests exist.
Publisher's Disclaimer: This is a PDF file of an unedited manuscript that has been accepted for publication. As a service to our customers we are providing this early version of the manuscript. The manuscript will undergo copyediting, typesetting, and review of the resulting proof before it is published in its final form. Please note that during the production process errors may be discovered which could affect the content, and all legal disclaimers that apply to the journal pertain.
References
- 1.Amrutkar M, Gladhaug IP, 2017. Pancreatic Cancer Chemoresistance to Gemcitabine. Cancers (Basel) 9. [DOI] [PMC free article] [PubMed] [Google Scholar]
- 2.Bakhtiary Z, Barar J, Aghanejad A, Saei AA, Nemati E, Ezzati Nazhad Dolatabadi J, Omidi Y, 2017. Microparticles containing erlotinib-loaded solid lipid nanoparticles for treatment of non-small cell lung cancer. Drug development and industrial pharmacy 43, 1244–1253. [DOI] [PubMed] [Google Scholar]
- 3.Baxter NN, Whitson BA, Tuttle TM, 2007. Trends in the treatment and outcome of pancreatic cancer in the United States. Annals of surgical oncology 14, 1320–1326. [DOI] [PubMed] [Google Scholar]
- 4.Blackstock AW, Lightfoot H, Case LD, Tepper JE, Mukherji SK, Mitchell BS, Swarts SG, Hess SM, 2001. Tumor uptake and elimination of 2’,2’-difluoro-2’-deoxycytidine (gemcitabine) after deoxycytidine kinase gene transfer: correlation with in vivo tumor response. Clinical cancer research : an official journal of the American Association for Cancer Research 7, 3263–3268. [PubMed] [Google Scholar]
- 5.Chaudhury A, Das S, 2011. Recent advancement of chitosan-based nanoparticles for oral controlled delivery of insulin and other therapeutic agents. AAPS PharmSciTech 12, 10–20. [DOI] [PMC free article] [PubMed] [Google Scholar]
- 6.Chen Z, Zheng Y, Shi Y, Cui Z, 2018. Overcoming tumor cell chemoresistance using nanoparticles: lysosomes are beneficial for (stearoyl) gemcitabine-incorporated solid lipid nanoparticles. Int J Nanomedicine 13, 319–336. [DOI] [PMC free article] [PubMed] [Google Scholar]
- 7.Clark AJ, Wiley DT, Zuckerman JE, Webster P, Chao J, Lin J, Yen Y, Davis ME, 2016. CRLX101 nanoparticles localize in human tumors and not in adjacent, nonneoplastic tissue after intravenous dosing. Proceedings of the National Academy of Sciences of the United States of America 113, 3850–3854. [DOI] [PMC free article] [PubMed] [Google Scholar]
- 8.Das S, Chaudhury A, 2011. Recent advances in lipid nanoparticle formulations with solid matrix for oral drug delivery. AAPS PharmSciTech 12, 62–76. [DOI] [PMC free article] [PubMed] [Google Scholar]
- 9.Dash S, Murthy PN, Nath L, Chowdhury P, 2010. Kinetic modeling on drug release from controlled drug delivery systems. Acta Poloniae Pharmaceutica - Drug Research 67, 217–223. [PubMed] [Google Scholar]
- 10.Delitto D, Pham K, Vlada AC, Sarosi GA, Thomas RM, Behrns KE, Liu C, Hughes SJ, Wallet SM, Trevino JG, 2015. Patient-derived xenograft models for pancreatic adenocarcinoma demonstrate retention of tumor morphology through incorporation of murine stromal elements. Am J Pathol 185, 1297–1303. [DOI] [PMC free article] [PubMed] [Google Scholar]
- 11.Diaz Osterman CJ, Gonda A, Stiff T, Sigaran U, Valenzuela MM, Ferguson Bennit HR, Moyron RB, Khan S, Wall NR, 2016. Curcumin Induces Pancreatic Adenocarcinoma Cell Death Via Reduction of the Inhibitors of Apoptosis. Pancreas 45, 101–109. [DOI] [PMC free article] [PubMed] [Google Scholar]
- 12.Dora CP, Kushwah V, Katiyar SS, Kumar P, Pillay V, Suresh S, Jain S, 2017. Improved metabolic stability and therapeutic efficacy of a novel molecular gemcitabine phospholipid complex. Int J Pharm 530, 113–127. [DOI] [PubMed] [Google Scholar]
- 13.Dorjee P, Long ZW, 2018. A mixed treatment comparison of toxicity of gemcitabine combined with different targeted drugs in the treatment of advanced or metastatic pancreatic cancer. Cancer biology & therapy 19, 497–506. [DOI] [PMC free article] [PubMed] [Google Scholar]
- 14.Ekambaram P, Abdul HS, 2011. Formulation and evaluation of solid lipid nanoparticles of ramipril. J Young Pharm 3, 216–220. [DOI] [PMC free article] [PubMed] [Google Scholar]
- 15.Elmore S, 2007. Apoptosis: a review of programmed cell death. Toxicol Pathol 35, 495–516. [DOI] [PMC free article] [PubMed] [Google Scholar]
- 16.Fang J, Nakamura H, Maeda H, 2011. The EPR effect: Unique features of tumor blood vessels for drug delivery, factors involved, and limitations and augmentation of the effect. Adv Drug Deliv Rev 63, 136–151. [DOI] [PubMed] [Google Scholar]
- 17.Geszke-Moritz M, Moritz M, 2016. Solid lipid nanoparticles as attractive drug vehicles: Composition, properties and therapeutic strategies. Mater Sci Eng C Mater Biol Appl 68, 982–994. [DOI] [PubMed] [Google Scholar]
- 18.Gilabert M, Chanez B, Rho YS, Giovanini M, Turrini O, Batist G, Kavan P, Raoul JL, 2017. Evaluation of gemcitabine efficacy after the FOLFIRINOX regimen in patients with advanced pancreatic adenocarcinoma. Medicine 96, e6544. [DOI] [PMC free article] [PubMed] [Google Scholar]
- 19.Jores K, Mehnert W, Drechsler M, Bunjes H, Johann C, Mader K, 2004. Investigations on the structure of solid lipid nanoparticles (SLN) and oil-loaded solid lipid nanoparticles by photon correlation spectroscopy, field-flow fractionation and transmission electron microscopy. Journal of controlled release : official journal of the Controlled Release Society 95, 217–227. [DOI] [PubMed] [Google Scholar]
- 20.Kanat O, Ertas H, 2018. Shattering the castle walls: Anti-stromal therapy for pancreatic cancer. World J Gastrointest Oncol 10, 202–210. [DOI] [PMC free article] [PubMed] [Google Scholar]
- 21.Kasuya K, Tsuchida A, Nagakawa Y, Suzuki Y, Suzuki M, Aoki T, Abe Y, Shimazu M, Itoi T, Sofuni A, 2012. Prediction of a side effect and efficacy of adjuvant chemotherapy with gemcitabine for post operative patient of pancreatic cancer by a genetic polymorphism analysis. Hepato-gastroenterology 59, 1609–1613. [DOI] [PubMed] [Google Scholar]
- 22.Khare V, Sakarchi WA, Gupta PN, Curtis ADM, Hoskins C, 2016. Synthesis and characterization of TPGS-gemcitabine prodrug micelles for pancreatic cancer therapy. RSC Adv. 6, 60126–60137. [Google Scholar]
- 23.Koay EJ, Truty MJ, Cristini V, Thomas RM, Chen R, Chatterjee D, Kang Y, Bhosale PR, Tamm EP, Crane CH, Javle M, Katz MH, Gottumukkala VN, Rozner MA, Shen H, Lee JE, Wang H, Chen Y, Plunkett W, Abbruzzese JL, Wolff RA, Varadhachary GR, Ferrari M, Fleming JB, 2014. Transport properties of pancreatic cancer describe gemcitabine delivery and response. The Journal of clinical investigation 124, 1525–1536. [DOI] [PMC free article] [PubMed] [Google Scholar]
- 24.Kobayashi N, Shimamura T, Tokuhisa M, Goto A, Endo I, Ichikawa Y, 2017. Effect of FOLFIRINOX as second-line chemotherapy for metastatic pancreatic cancer after gemcitabine-based chemotherapy failure. Medicine 96, e6769. [DOI] [PMC free article] [PubMed] [Google Scholar]
- 25.Kulkarni P, Haldar MK, Katti P, Dawes C, You S, Choi Y, Mallik S, 2016. Hypoxia Responsive, Tumor Penetrating Lipid Nanoparticles for Delivery of Chemotherapeutics to Pancreatic Cancer Cell Spheroids. Bioconjugate chemistry 27, 1830–1838. [DOI] [PMC free article] [PubMed] [Google Scholar]
- 26.Lanz C, Fruh M, Thormann W, Cerny T, Lauterburg BH, 2007. Rapid determination of gemcitabine in plasma and serum using reversed-phase HPLC. J Sep Sci 30, 1811–1820. [DOI] [PubMed] [Google Scholar]
- 27.Li JM, Chen W, Wang H, Jin C, Yu XJ, Lu WY, Cui L, Fu DL, Ni QX, Hou HM, 2009. Preparation of albumin nanospheres loaded with gemcitabine and their cytotoxicity against BXPC-3 cells in vitro. Acta pharmacologica Sinica 30, 1337–1343. [DOI] [PMC free article] [PubMed] [Google Scholar]
- 28.Lv Q, Yu A, Xi Y, Li H, Song Z, Cui J, Cao F, Zhai G, 2009. Development and evaluation of penciclovir-loaded solid lipid nanoparticles for topical delivery. Int J Pharm 372, 191–198. [DOI] [PubMed] [Google Scholar]
- 29.Mady MM, Darwish MM, Khalil S, Khalil WM, 2009. Biophysical studies on chitosan-coated liposomes. Eur Biophys J 38, 1127–1133. [DOI] [PubMed] [Google Scholar]
- 30.Moore MJ, Goldstein D, Hamm J, Figer A, Hecht JR, Gallinger S, Au HJ, Murawa P, Walde D, Wolff RA, Campos D, Lim R, Ding K, Clark G, Voskoglou-Nomikos T, Ptasynski M, Parulekar W, National Cancer Institute of Canada Clinical Trials, G., 2007. Erlotinib plus gemcitabine compared with gemcitabine alone in patients with advanced pancreatic cancer: a phase III trial of the National Cancer Institute of Canada Clinical Trials Group. J Clin Oncol 25, 1960–1966. [DOI] [PubMed] [Google Scholar]
- 31.Muranaka T, Kuwatani M, Komatsu Y, Sawada K, Nakatsumi H, Kawamoto Y, Yuki S, Kubota Y, Kubo K, Kawahata S, Kawakubo K, Kawakami H, Sakamoto N, 2017. Comparison of efficacy and toxicity of FOLFIRINOX and gemcitabine with nab-paclitaxel in unresectable pancreatic cancer. Journal of gastrointestinal oncology 8, 566–571. [DOI] [PMC free article] [PubMed] [Google Scholar]
- 32.Nandini PT, Doijad RC, Shivakumar HN, Dandagi PM, 2015. Formulation and evaluation of gemcitabine-loaded solid lipid nanoparticles. Drug Deliv 22, 647–651. [DOI] [PubMed] [Google Scholar]
- 33.Orlandi A, Calegari MA, Martini M, Cocomazzi A, Bagala C, Indellicati G, Zurlo V, Basso M, Cassano A, Larocca LM, Barone C, 2016. Gemcitabine versus FOLFIRINOX in patients with advanced pancreatic adenocarcinoma hENT1-positive: everything was not too bad back when everything seemed worse. Clinical & translational oncology : official publication of the Federation of Spanish Oncology Societies and of the National Cancer Institute of Mexico 18, 988–995. [DOI] [PubMed] [Google Scholar]
- 34.Patel MN, Lakkadwala S, Majrad MS, Injeti ER, Gollmer SM, Shah ZA, Boddu SH, Nesamony J, 2014. Characterization and evaluation of 5-fluorouracil-loaded solid lipid nanoparticles prepared via a temperature-modulated solidification technique. AAPS PharmSciTech 15, 1498–1508. [DOI] [PMC free article] [PubMed] [Google Scholar]
- 35.Pham K, Delitto D, Knowlton AE, Hartlage ER, Madhavan R, Gonzalo DH, Thomas RM, Behrns KE, George TJ Jr., Hughes SJ, Wallet SM, Liu C, Trevino JG, 2016. Isolation of Pancreatic Cancer Cells from a Patient-Derived Xenograft Model Allows for Practical Expansion and Preserved Heterogeneity in Culture. Am J Pathol 186, 1537–1546. [DOI] [PMC free article] [PubMed] [Google Scholar]
- 36.Rahib L, Smith BD, Aizenberg R, Rosenzweig AB, Fleshman JM, Matrisian LM, 2014. Projecting cancer incidence and deaths to 2030: the unexpected burden of thyroid, liver, and pancreas cancers in the United States. Cancer research 74, 2913–2921. [DOI] [PubMed] [Google Scholar]
- 37.Siepmann J, Peppas NA, 2011. Higuchi equation: derivation, applications, use and misuse. Int J Pharm 418, 6–12. [DOI] [PubMed] [Google Scholar]
- 38.Siepmann J, Siepmann F, 2013. Mathematical modeling of drug dissolution. Int J Pharm 453, 12–24. [DOI] [PubMed] [Google Scholar]
- 39.Souza TGF, Ciminelli VST, Mohallem NDS, 2016. A comparison of TEM and DLS methods to characterize size distribution of ceramic nanoparticles. Journal of Physics: Conference Series 733, 012039. [Google Scholar]
- 40.Tığlı Aydin RS, Pulat M, 2012. 5-Fluorouracil Encapsulated Chitosan Nanoparticles for pH-Stimulated Drug Delivery: Evaluation of Controlled Release Kinetics. Journal of Nanomaterials 2012, 1–10. [Google Scholar]
- 41.Tiyaboonchai W, Tungpradit W, Plianbangchang P, 2007. Formulation and characterization of curcuminoids loaded solid lipid nanoparticles. Int J Pharm 337, 299–306. [DOI] [PubMed] [Google Scholar]
- 42.Vaghasiya H, Kumar A, Sawant K, 2013. Development of solid lipid nanoparticles based controlled release system for topical delivery of terbinafine hydrochloride. Eur J Pharm Sci 49, 311–322. [DOI] [PubMed] [Google Scholar]
- 43.Venkateswarlu V, Manjunath K, 2004. Preparation, characterization and in vitro release kinetics of clozapine solid lipid nanoparticles. Journal of controlled release : official journal of the Controlled Release Society 95, 627–638. [DOI] [PubMed] [Google Scholar]
- 44.Wen Z, Liao Q, Hu Y, You L, Zhou L, Zhao Y, 2013. A spheroid-based 3D culture model for pancreatic cancer drug testing, using the acid phosphatase assay. Braz J Med Biol Res 46, 634–642. [DOI] [PMC free article] [PubMed] [Google Scholar]
- 45.Zheng M, Falkeborg M, Zheng Y, Yang T, Xu X, 2013. Formulation and characterization of nanostructured lipid carriers containing a mixed lipids core. Colloids and Surfaces A: Physicochemical and Engineering Aspects 430, 76–84. [Google Scholar]


