Abstract
Introduction:
At ultra high field, local susceptibility induced hyperintensities are pronounced in brain areas close to air-tissue boundaries in the inferior frontal lobe and temporal lobes on T1w MPRAGE images. Resulting from incomplete inversion, these artefacts can introduce biases in brain volumetry and erroneously suggest the existence of local tissular anomaly. We propose a straightforward approach to eliminate these artefacts by applying a shift (ΔfIR) to the center frequency of the adiabatic inversion pulse while widening the bandwidth of the latter by shortening the pulse duration (ΔtIR).
Methods:
An MPRAGE sequence was customized allowing to change the duration (standard: 10240us) and center frequency of the hyperbolic secant inversion RF pulse (IR). All measurements were performed on a 7T whole body scanner (Siemens, Erlangen, Germany). 13 healthy volunteers (7 female and 6 male, average age (SD) = 38±15 yrs) were recruited for the study, 3 of which were scanned for protocol optimization and the rest for performance evaluation. ΔB0 was mapped through the brain with a gradient echo sequence. The effects of ΔfIR and ΔtIR were studied separately and jointly to determine optimal parameter combinations to achieve the largest spatial extent of complete inversion throughout the brain.
Results:
Applying a positive ΔfIR restored inversion efficiency in the inferior frontal and temporal lobes, but also introduced undesired hyperintensities in the anterior temporal lobes. Widening the bandwidth alone could also partially reduce hyperintensities in the frontal area but with a limited efficiency. By simultaneously applying a positive ΔfIR of 300 Hz and shortening ΔtIR by 40%, these artefacts were eliminated across the whole cerebrum.
Conclusion:
A robust elimination of susceptibility induced hyperintensities near air-tissue boundaries in T1w MPRAGE 7T brain images is demonstrated. This technique only requires limited MR sequence modifications.
1. Introduction:
Ultrahigh field MRI at 7T, with higher intrinsic signal to noise ratio and a broader distribution of longitudinal relaxation times through brain tissues[1], enables very high resolution T1-weighted anatomical images of the human brain, allowing for the visualization of certain brain structures that could not be well delineated at standard clinical field strength (≤3T)[2]’[3]’[4]. However, at 7T, strong local susceptibility can induce large static field variation (ΔB0) in brain areas close to air-tissue boundaries, resulting in incomplete inversion in MPRAGE (Magnetization-prepared rapid gradientecho)[5] acquisition, manifested as local hyperintensities with a loss of T1 contrast in the Tlw images, most frequently seen in the medial inferior frontal and temporal lobes. These artefacts, which could not be retrospectively corrected for, can be a significant source of bias in brain structure analysis such as cortical thickness determination[6] and voxel-based morphometry[7], in studies dedicated to local brain areas such as the gyrus rectus which has been found to be associated with depression[8]’[9], as well as in establishing clinical diagnosis on cortical malformation.
Several approaches can be considered to mitigate local susceptibility induced hyperintensities in T1w MPRAGE images, including, as proposed earlier by Wiggins[10], shifting the center frequency of the adiabatic inversion pulse by 200Hz. The drawback of this approach is that it may induce undesired hyperintensities in brain areas subjected to local frequency offsets with opposite polarity. Alternatively, it has been proposed to improve the inversion efficiency in the presence of large static field inhomogeneities by altering the inversion adiabatic pulse design[11]’[12]. However, with the latter approach, developed mostly to target cerebellum and brain stem, unsatisfactory results have been reported regarding the mitigation of hyperintensities in the inferior frontal cortex[11]. Another group of methods aiming at directly reducing B0 inhomogeneities are using advanced shimming techniques[13], but these approaches typically require cutting edge hardware and resources that are not readily available to many end users.
In this study, expanding on Wiggins’ earlier approach which was found insufficient when applied alone, we demonstrate a straightforward approach to eliminate these artefacts by combining frequency offset and bandwidth widening onto the hyperbolic secant inversion pulse of a standard MPRAGE sequence.
2. Methods:
2.1. Hardware:
All image acquisitions were performed on a 7T whole body scanner (Siemens, Erlangen, Germany) equipped with a single-channel transmit and 32-channel receive head coil (Nova Medical, Wilmington, MA) and a S720 gradient coil that includes four 3rd order term B0 shimming coils additionally to the 2nd order.
2.2. Study design and subject recruitment:
A standard MPRAGE sequence was customized to allow for: 1) applying a shift ΔfIR to the center frequency, and 2) changing the duration ΔtIR (standard: 10240 us) of the hyperbolic secant inversion pulse. Widening the bandwidth BWIR was achieved by shortening ΔtIR while increasing the voltage of the inversion pulse to preserve adiabatic inversion.
The study was divided into two parts. In the first part, three healthy subjects were recruited to determine an optimal parameter combination of ΔfIR and ΔtIRfor the customized MPRAGE sequence. Three types of changes to the protocol were applied. First, ΔfIR was added incrementally to examine its impact on the inversion efficiency across the whole brain. Second, ΔtIR was shortened to test the impact of a wider bandwidth. Finally, ΔfIR and ΔtIR were changed simultaneously to determine the optimal combination. The combinations of ΔfIR and ΔtIR tested on different subjects are listed in table 1. In one subject, the optimized ΔfIR was further shifted by +/− 60Hz to evaluate the robustness of the technique against different ΔB0 distributions.
Table 1.
The combinations of frequency shift (ΔfIR) and duration (ΔtIR) of the inversion pulse applied on the three subjects for protocol optimization
| Pulse parameter | Combination 1 | Combination 2 | Combination 3 | Combination 4 |
|---|---|---|---|---|
| Subject 1 | ||||
| ΔfIR (Hz) | 0 | 125 | 180 | 250 |
| ΔtIR (us) | 10240 | 10240 | 10240 | 10240 |
| Subject 2 | ||||
| ΔfIR (Hz) | 0 | 300 | 300 | 300 |
| ΔtIR (us) | 10240 | 10240 | 8192 | 6144 |
| Subject 3 | ||||
| ΔfIR (Hz) | 0 | 0 | 300 | |
| ΔtIR (us) | 10240 | 6144 | 6144 | |
In the second part, 10 additional healthy subjects were recruited to evaluate the performance of the parameter combination determined in the first part. Informed consent approved by a local IRB was obtained from all the subjects recruited for the study.
2.3. Imaging parameters:
For all recruited subjects, standard B0 shimming up to the 3rd order spherical harmonics was applied, using vendor standard adjustment routine, to reduce static field inhomogeneities. ΔB0 maps were then obtained using a vendor-provided gradient echo field mapping sequence (TE1/TE2 = 4.08ms/5.10ms, TR = 800ms, bandwidth = 1502Hz/pixel, pixel size = 1.7 × 1.7 mm2, FoV = 190 × 218 mm2, slice thickness = 1.7mm, 86 slices). The customized MPRAGE sequence was used with the following parameters: TR/TI/TE = 3100ms/1500ms/3.5ms, flip angle = 6°, FoV = 230×210×256mm3, voxel size = 0.6×0.6×0.6mm3, TA = 6:51min, GRAPPA ×2. The specific absorption rate (SAR) was continuously monitored by the console. To correct for receive B1 field bias[14], proton density weighted (PDw) images were acquired with the same parameters but without inversion pulse (TR/TI = 2160ms/0ms, TA = 4:55min) and with a flip angle of 4°.
2.4. Image evaluation:
B0 maps were visually examined on the console during each scanning session, particularly for brain areas known to be subjected to large local ΔB0. To better assess the distribution of ΔB0, the B0 maps generated by the console were exported on an external computer where they were unwrapped[15] and masked, using a brain mask derived from the magnitude images of the first echo using BET brain extraction[16].
T1w MPRAGE images were coregistered to PDw images using SPM12 (http://www.fil.ion.ucl.ac.uk/spm/software/spml2/) before generating the ratio images Tlw/PDw. Both Tlw and ratio images were visually examined to evaluate artifact reduction across the whole brain for all subjects. To further quantify the artefact elimination, we performed the following analysis on the ratio images.
For each subject, a region of interest (ROI) was drawn and used as a mask to extract the upper part of rectus from an axial slice positioned right above the sinus area.
The normalized histogram of the values of Tlw/PDw signal intensity within the mask was generated.
For the first group of subjects tested to optimize the parameters, the ROIs were first drawn on the images without hyperintensity. The masks were then applied on the images with and without hyperintensity.
The value T1w/PDw provides a normalized measurement of T1w signal regardless of receive coil sensitivity[14], providing histograms that are comparable across all subjects.
3. Results:
B0 maps crossing brain areas with large frequency offset are shown in Fig. 1(a) for a typical subject. Positive frequency offsets are observed in the inferior frontal lobe and the posterior inferior temporal lobe while negative offsets are seen in the anterior inferior temporal lobe. The histograms of ΔB0 (in Hz) within the brain from all subjects are plotted in Fig. 1(b) (top). A clear asymmetric distribution between positive and negative offset becomes visible when zooming in on a histogram including only voxels with relatively large ΔB0 (|ΔB0| >200Hz) (bottom chart, same figure).
Fig. 1.
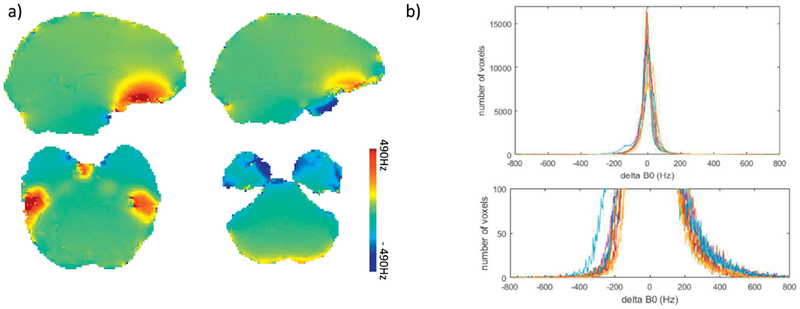
a) B0 map (in Hz) of brain areas with large ΔB0; b) the histogram of ΔB0for all recruited subjects (top), with the distribution of voxels with large ΔB0 zoomed in and displayed at the bottom.
The effect of shifting ΔfIR on the brain regions with large ΔB0 could be seen in Fig. 2 In the medial inferior frontal area right above the sinus (top row), where ΔB0 > 400Hz, local susceptibility induced hyperintensity was reduced when increasing ΔfIR. Even when ΔfIR =250Hz, residual hyperintensities were still observed, but increasing further ΔfIR would not have yielded acceptable solutions because, at the same time, signal hyperintensities became apparent in the infero-anterior part of the temporal lobe where the average ΔB0 amplitude is not as high as in the frontal lobe but is of opposite polarity (Fig. 2, bottom row).
Fig. 2.
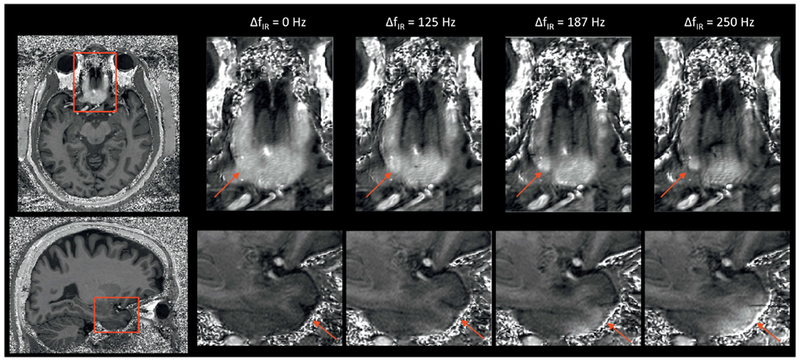
The effects of applying ΔfIR alone on the inferior frontal lobe (top, ΔB0 >>0) and anterior temporal lobes (bottom, ΔB0 <<0) shown on the T1w/PDw images. By increasing ΔfIR alone, the hyperintensity on the areas with ΔB0 >>0 is reduced with more structural information revealed. However, undesired hyperintensity starts to appear on the areas with ΔB0 <<0 when ΔfIR is increased to 187 Hz and becomes stronger when ΔfIR reaches 250 Hz. The red arrows indicate the brain areas with the artefacts.
The efficacy of widening the inversion pulse to improve artifact reduction when applying ΔfIR>0HZ can be appreciated in Fig. 3. Signal hyperintensities that appear in the temporal lobe (bottom row) when only applying ΔfIR =300Hz were partially mitigated when shortening ΔtIR by 20% and completely disappeared when shortening ΔtIR by 40%. In this particular subject, residual hyperintensity in the frontal area (top row) were still observed when only applying ΔfIR =300Hz, but were ultimately eliminated after also shortening ΔtIR by 40%. The actual peak voltage delivered to the inversion pulse, when shortened by 40%, varied between 500V and 540V (the maximum available peak voltage was 540V). Further widening of the inversion pulse was not considered, as it would have required inversion pulse voltage exceeding safety limits imposed by the console. The SAR reading on the console was below 40% for all MPRAGE acquisitions.
Fig. 3.
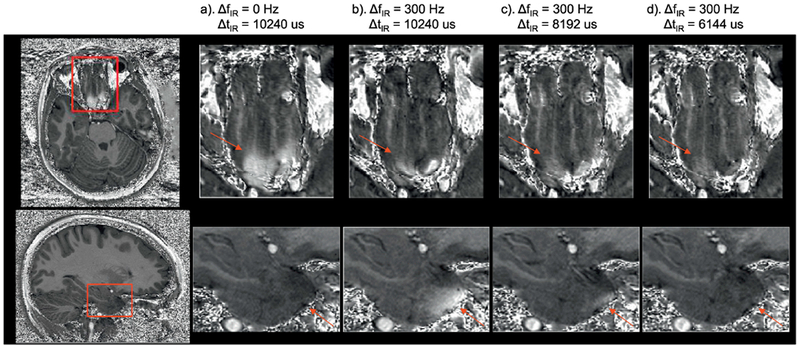
The effects of b) applying ΔfIR alone and c) - d) both applying ΔfIR and changing ΔtIR of the adiabatic inversion pulse on the artefact reduction compared to a) the original parameters from MPRAGE in inferior frontal area (top, ΔB0 >>0) and anterior temporal lobes (bottom, ΔB0 <<0) shown on the T1w/PDw images. The hyperintensities seen on the frontal lobe in a) and temporal lobe in (b) are largely reduced in c) and eliminated in d). The red arrows indicate the brain areas with the artefacts.
Shortening ΔtIR by 40% by itself can largely reduce signal hyperintensities in the inferior frontal area, as can be seen in Fig. 4., but with some local brightness still observed. The latter disappeared when also applying ΔfIR = 300Hz. An optimal parameter combination was empirically found to be ΔtIR = 6144 μs and ΔfIR = 300 Hz. It should be clarified here that according to our experience with in vivo T1w MPRAGE and B0 mapping acquisitions at 7T, local frequency offsets in the gyrus rectus and/or the infero-temporal lobe can in some subjects reach very high values. As a result, the value of ΔfIR considered optimal was conservatively chosen to be relatively high (300 Hz) to eliminate signal hyperintensity in the frontal and temporal lobes for even in those particular subjects.
Fig. 4.
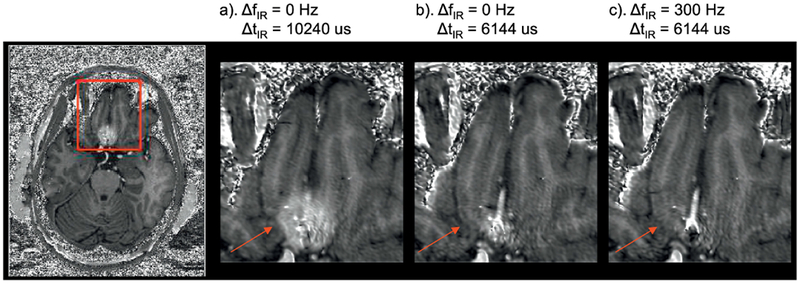
The effects of b) changing ΔtIR alone and c) both applying ΔfIR and changing ΔtIR on the artefact reduction compared to a) the original parameters from MPRAGE in inferior frontal area (ΔB0 >>0) shown on the T1w/PDw images. Residual hyperintensity is still visible in a) but vanishes in b) and c). The red arrows indicate the brain areas with the artefacts.
Anticipating the fact that even larger ΔB0 offsets could be observed in a larger population, the robustness of the proposed approach was tested by shifting ΔfIR by ±60Hz. As shown in Fig.5, no visible difference in image quality was observed compared with the predetermined optimal parameter set.
Fig. 5.
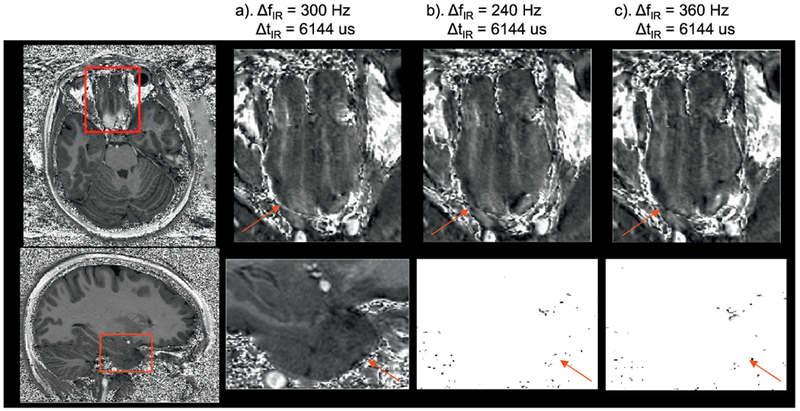
The robust elimination of the hyperintensities with different ΔfIR in inferior frontal area (top, ΔB0 >>0) and anterior temporal lobes (bottom, ΔB0 <<0) shown on the T1w/PDw images. No difference in image quality is observed among the three scenarios with different ΔfIR. The red arrows indicate the brain areas with the artefacts generally shown with standard ΔfIRand ΔtIR.
Across all subjects scanned with ΔtIR= 6144 us and ΔfIR = 300 Hz, signal hyperintensities commonly seen in the inferior frontal and temporal lobe with the native MPRAGE sequence were not identified. While in one subject a very small amount of residual hyperintensity persisted at the bottom of rectus gyrus, the corresponding ΔB0 map revealed a local B0 field deviation exceeding 800Hz, which was not observed in other measured data sets. The signal intensity distribution from T1w/PDw ratio images plotted as the normalized histograms restricted to a masked brain area from rectus gyrus of each subject are shown in Fig. 6. An example of the selected brain area is displayed in Fig. 6(a) and (b) for the signal with and without applying the corrected acquisition to address hyperintensities, respectively. The image without hyperintensity was acquired with ΔtIR = 6144 us and ΔfIR = 300 Hz. The histograms from these two data sets are shown in Fig. 6(c). As can be seen from (b) and (c), a secondary peak corresponding to signal hyperintensity is centered on a range of T1w/PDw values contained between 1 and 1.5 (blue line). This can be explained using the similar principles described in ref [14]. With our parameter settings (FA = 4° for PDw images and FA = 6° for T1w images), in an extreme case where one considers the inversion pulse being completely absent, the unit-less signal ratio of T1w/PDw approaches 1.5 using a small flip angle approximation. Therefore, the spins that are experiencing an incomplete of absent inversion have a ratio values on the histogram between the values of 1.0 and 1.5. In the absence of correction, these pixels are sufficiently numerous to form a secondary broad peak. After applying the change in ΔtIR and ΔfIR, the ratio values of these voxels (red line) fall back into the expected range of ratio values in brain tissues in the presence of inversion pulse, i.e. lower than 1. For all the subjects tested with the optimized parameter set, the vast majority of the ratio values were smaller than 1.0, closely coinciding with the distribution of voxels plotted with the red line, i.e. without hyperintensity, shown in (c).
Fig. 6.
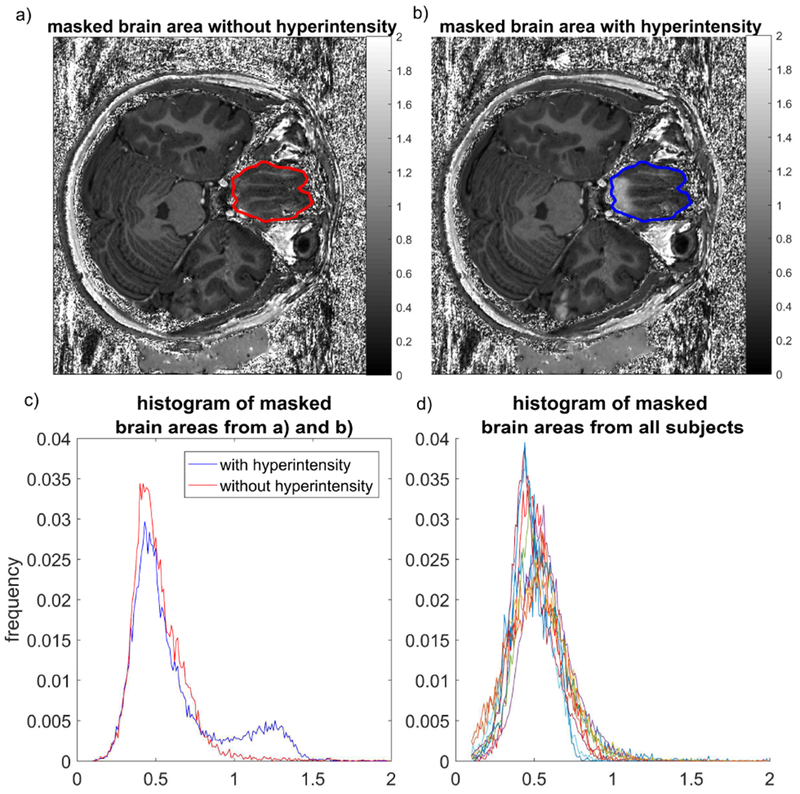
The histograms of T1w/PDw values from rectus gyrus area. An example of the ROI defined for generating the mask is shown on an image a) without and b) with hyperintensity. The masks from a) and b) are identical as the images are from the same subject. The corresponding histograms of pixel values are displayed in c) for the case with (blue) and without (red) hyperintensity. Histograms generated with the same method for all subjects with ΔtIR= 6144 us and ΔfIR = 300 Hz are displayed in d).
4. Discussion:
In this study, by shifting the central frequency of the inversion pulse during the magnetic preparation stage by 300Hz and shortening the pulse duration by 40%, the hyperintensities in brain tissues commonly observed in T1w MPRAGE images were largely mitigated and, in most cases eliminated without causing additional incomplete inversion in brain areas with large ΔB0 of the opposite polarity.
The B0 measurements in this study showed that the majority of brain voxels experienced ΔB0 values within ±200Hz after static B0 shimming, in accordance with what was reported in an earlier study[17]. However, local brain areas with larger positive ΔB0 (>300 Hz), located at the bottom of frontal and temporal lobe, were observed in all subjects. A much smaller number of voxels experienced large negative ΔB0 values, as shown in Fig. 1 b), although with a maximum ΔB0amplitude smaller than that in areas with positive ΔB0 values. This asymmetric frequency pattern of ΔB0 explains why a positive shift of the central frequency has to be applied to the inversion pulse, given the fact that the bandwidth of the latter could not be indefinitely widened, as demonstrated by the partial inversion failure still observed in the frontal area when only shortening the inversion pulse.
It should be mentioned that other methods exploiting multi-channel transmission, such as universal pulses[18], can successfully eliminate these artifacts, however, the vast majority of clinical studies rely on single channel transmit RF coils, incompatible with these approaches. Our proposed solution, with a straightforward implementation, serves as a more practical candidate for these studies.
Acknowledgments
Grant support:
This work was supported by the National Institutes of Health (NIH) [P41 EB015894 ‘Biotechnology Research Center’; P30 NS076408 ‘Institutional Center Cores for Advanced Neuroimaging’]; National Science Foundation (NSF) [Award ID 1607835 ‘US-French Research Proposal: Hippocampal Layers: Advanced Computational Anatomy Using Very High Resolution MRI at 7 Tesla in Humans’].
Footnotes
Publisher's Disclaimer: This is a PDF file of an unedited manuscript that has been accepted for publication. As a service to our customers we are providing this early version of the manuscript. The manuscript will undergo copyediting, typesetting, and review of the resulting proof before it is published in its final citable form. Please note that during the production process errors may be discovered which could affect the content, and all legal disclaimers that apply to the journal pertain.
References:
- [1].Rooney WD, Johnson G, Li X, Cohen ER, Kim SG, Ugurbil K, et al. Magnetic field and tissue dependencies of human brain longitudinal 1H2O relaxation in vivo. Magn Reson Med 2007;57:308–18. doi: 10.1002/mrm.21122. [DOI] [PubMed] [Google Scholar]
- [2].Keuken MC, Bazin P-L, Schafer A, Neumann J, Turner R, Forstmann BU. Ultra-High 7T MRI of Structural Age-Related Changes of the Subthalamic Nucleus. J Neurosci 2013;33:4896–900. doi: 10.1523/JNEUROSCI.3241-12.2013. [DOI] [PMC free article] [PubMed] [Google Scholar]
- [3].Solano-Castiella E, Schäfer A, Reimer E, Türke E, Pröger T, Lohmann G, et al. Parcellation of human amygdala in vivo using ultra high field structural MRI. Neuroimage 2011;58:741–8. doi: 10.1016/j.neuroimage.2011.06.047. [DOI] [PubMed] [Google Scholar]
- [4].Derix J, Yang S, Lüsebrink F, Fiederer LDJ, Schulze-Bonhage A, Aertsen A, et al. Visualization of the amygdalo-hippocampal border and its structural variability by 7T and 3T magnetic resonance imaging. Flum Brain Mapp 2014;35:4316–29. doi: 10.1002/hbm.22477. [DOI] [PMC free article] [PubMed] [Google Scholar]
- [5].Mugler JP, Brookeman JR. Rapid three-dimensional Tl-weighted MR imaging with the MP-RAGE sequence. J Magn Reson Imaging 1991;1:561–7. doi: 10.1002/jmri.1880010509. [DOI] [PubMed] [Google Scholar]
- [6].Lüsebrink F, Wollrab A, Speck O. Cortical thickness determination of the human brain using high resolution 3T and 7T MRI data. Neuroimage 2013;70:122–31. doi: 10.1016/j.neuroimage.2012.12.016. [DOI] [PubMed] [Google Scholar]
- [7].Seiger R, Hahn A, Hummer A, Kranz GS, Ganger S, Küblböck M, et al. Voxel-based morphometry at ultra-high fields. A comparison of 7T and 3T MRI data. Neuroimage 2015;113:207–16. doi: 10.1016/j.neuroimage.2015.03.019. [DOI] [PMC free article] [PubMed] [Google Scholar]
- [8].Grieve SM, Korgaonkar MS, Koslow SH, Gordon E, Williams LM. Widespread reductions in gray matter volume in depression. Neuroimage Clin 2013;3:332–9. doi: 10.1016/j.nicl.2013.08.016. [DOI] [PMC free article] [PubMed] [Google Scholar]
- [9].Accolla EA, Aust S, Merkl A, Schneider GH, Kühn AA, Bajbouj M, et al. Deep brain stimulation of the posterior gyrus rectus region for treatment resistant depression. J Affect Disord 2016;194:33–7. doi: 10.1016/j.jad.2016.01.022. [DOI] [PubMed] [Google Scholar]
- [10].Wiggins CJ. A Simple Method Of Improving MPRAGE Inversion Coverage at 7T. Proc Inti Soc Mag Reson Med 2007;15:3448. [Google Scholar]
- [11].Wrede KH, Johst S, Dammann P, Umutlu L, Schlamann MU, Sandalcioglu IE, et al. Caudal Image Contrast Inversion in MPRAGE at 7 Tesla. Problem and Solution. Acad Radiol 2012;19:172–8. doi: 10.1016/j.acra.2011.10.004. [DOI] [PubMed] [Google Scholar]
- [12].O’Brien KR, Magill AW, Delacoste J, Marques JP, Kober T, Fautz HP, et al. Dielectric Pads and Low-B<inf>1</inf><inf>+</inf> Adiabatic Pulses: Complementary Techniques to Optimize Structural T<inf>1</inf>w Whole-Brain MP2RAGE Scans at 7 Tesla. J Magn Reson Imaging 2013;40:804–12. doi: 10.1002/jmri.24435. [DOI] [PubMed] [Google Scholar]
- [13].Stockmann JP, Wald LL. In vivo B0 field shimming methods for MRI at 7T. Neuroimage 2017:1–17. doi: 10.1016/j.neuroimage.2017.06.013. [DOI] [PMC free article] [PubMed] [Google Scholar]
- [14].Van de Moortele PF, Auerbach EJ, Olman C, Yacoub E, Uğurbil K, Moeller S. T1 weighted brain images at 7 Tesla unbiased for Proton Density, T2* contrast and RF coil receive B1 sensitivity with simultaneous vessel visualization. Neuroimage 2009;46:432–46. doi: 10.1016/j.neuroimage.2009.02.009. [DOI] [PMC free article] [PubMed] [Google Scholar]
- [15].Spottiswoode B 2D phase unwrapping algorithms. MATLAB Cent File Exch 2008;December 2. [Google Scholar]
- [16].Smith SM. Fast robust automated brain extraction. Hum Brain Mapp 2002;17:143–55. doi: 10.1002/hbm.10062. [DOI] [PMC free article] [PubMed] [Google Scholar]
- [17].Juchem C, Nixon TW, McIntyre S, Boer VO, Rothman DL, de Graaf RA. Dynamic multi-coil shimming of the human brain at 7T. J Magn Reson 2011;212:280–8. doi: 10.1016/j.jmr.2011.07.005. [DOI] [PMC free article] [PubMed] [Google Scholar]
- [18].Gras V, Vignaud A, Amadon A, Le Bihan D, Boulant N. Universal pulses: A new concept for calibration-free parallel transmission. Magn Reson Med 2017;77:635–43. doi: 10.1002/mrm.26148. [DOI] [PubMed] [Google Scholar]


