

Abstract
Allopurinol, which lowers uric acid (UA) concentration, is increasingly being recognized for its benefits in cardiovascular and renal disease. However, response to allopurinol is variable. We gathered samples from 4,446 multiethnic subjects for a genome-wide association study of allopurinol response. Consistent with previous studies, we observed that the Q141K variant in ABCG2 (rs2231142), which encodes the efflux pump breast cancer resistance protein (BCRP), associated with worse response to allopurinol. However, for the first time this association reached genome-wide level significance (P = 8.06 × 10⁻¹¹). Additionally, we identified a novel association with a variant in GREM2 (rs1934341, P = 3.22 × 10⁻⁶). In vitro studies identified oxypurinol, the active metabolite of allopurinol, as an inhibitor of the UA transporter GLUT9, suggesting that oxypurinol may modulate UA reabsorption. These results provide strong evidence for a role of BCRP Q141K in allopurinol response, and suggest that allopurinol may have additional hypouricemic effects beyond xanthine oxidase inhibition.
INTRODUCTION
Gout is an inflammatory arthritis caused by the deposition of uric acid in the synovial fluid of the joints. These attacks are typically caused by chronically high concentrations of serum uric acid (SUA), or hyperuricemia, and are characterized by the extreme pain and discomfort they cause for patients.1 The painful and debilitating attacks associated with this disease as well as the underlying hyperuricemia have been shown to be risk factors for various diseases, including coronary heart disease, stroke, and especially chronic kidney disease, which represents the greatest comorbidity risk for gout patients.2–6 Thus, management of gout and hyperuricemia has become increasingly important in the prevention of life-threatening cardiac and renal diseases. Currently, allopurinol is the first-line treatment for chronic gout. The major mechanism of action of allopurinol is reduction in uric acid synthesis through inhibition of xanthine oxidase, the major enzyme for the production of uric acid.7 Response to allopurinol is highly variable, with as few as 21% of subjects maintaining the rheumatologist-recommended SUA concentration of < 6 mg/dL for three consecutive months in a prospective clinical trial.8 While poor adherence is a commonly cited problem for allopurinol, inadequate dosing as well as interindividual differences in pharmacokinetics or pharmacodynamics are also major factors for suboptimal response. This leaves a large number of hyperuricemic patients at an increased risk for developing life-threatening comorbidities, even those who are adherent to treatment.9 To identify factors involved in the response to allopurinol, our laboratory previously performed a genome-wide association study (GWAS) on allopurinol-induced change in SUA. Using a multiethnic cohort of 2,027 subjects taking allopurinol, we identified genetic variants in ABCG2, which encodes the efflux transporter breast cancer resistance protein (BCRP), as determinants of allopurinol response, and showed that oxypurinol, the active metabolite of allopurinol, is a substrate of BCRP. While one noncoding region variant in ABCG2, rs10011796, associated with poor response to allopurinol at a genome-wide level of significance, several observations about the role of ABCG2 in allopurinol response were puzzling. First, the association of the strongest associated single-nucleotide polymorphism (SNP) in ABCG2, rs10011796, weakened from P = 2.0 × 10⁻⁸ to P = 6.9 × 10⁻⁴ in the transethnic meta-analysis. Second, though the common missense variant of ABCG2, BCRP Q141K (rs2231142), associated with worse response, the association was not significant at a genome-wide level.10 Finally, the direction of the association was contradictory to the expected interaction between allopurinol concentration and BCRP function. That is, the reduced function variant associated with worse response to allopurinol. A reduced function variant in a renal (or intestinal) secretory transporter for allopurinol may be expected to be associated with higher systemic concentrations of oxypurinol and allopurinol, and therefore, better response to the drug, yet that is not the association we observed. These enigmatic observations led us to our current study. Here, we aimed to discover novel genetic determinants of allopurinol response and provide evidence to support our previous observations. Specifically, we considered the following questions: (i) Does BCRP Q141K associate with worse response to allopurinol at genome-wide significance? (ii) Does this variant appear to be the causal variant for the association? (iii) What mechanisms can explain the association of a reduced function variant in ABCG2 with poor response to allopurinol? To address these questions, we expanded our previous cohort to perform the largest GWAS on allopurinol response to date. In addition to the expanded cohort, we analyzed two independent cohorts to validate our top associated loci. Finally, we performed in vitro studies to unravel the mechanisms responsible for the association between BCRP Q141K and poor response to allopurinol.
RESULTS
The basic characteristics of the study populations are described in Table 1 and Table S5, and more detail is provided in the Methods section. In brief, samples from a total of 3,517 subjects on allopurinol were gathered for genome-wide analysis, and samples from a total of 4,446 subjects on allopurinol were used for validation and replication. ALLO1 and ALLO2 represent cohorts from the same clinical site and only differ in the time that their DNA was genotyped. ALLO1 was genotyped as a part of a larger cohort, the Genetic Epidemiology Research on Adult Health and Aging (GERA) cohort.11 ALLO1 contains the cohort analyzed in Wen et al.,10 although since that analysis has been completed more subjects that had already been genotyped met inclusion criteria due to longitudinal follow up that was recorded in updated electronic health record data and have been included in this analysis. Samples from qualified subjects in BioVU12 and MARSH13 were gathered and genotyped as independent replication cohorts. The major phenotype assessed in this study was initial uricemic response to allopurinol, which was defined as the change in SUA (treated– untreated) at the first follow-up appointment. Untreated SUA concentrations were defined as any SUA concentration within 1.5 years of starting allopurinol treatment. Treated SUA concentrations were recorded at least 4 days after starting allopurinol and no more than 7 days after stopping allopurinol. A single treatment period was used for each subject, to minimize confounding by nonadherence and dose changes. Using change in SUA from baseline as the primary phenotype, we performed a GWAS in ALLO1 and ALLO2 in each separate ethnic group, and combined results using inverse-variance weighted meta-analysis (Figure 1). Any ethnic group with fewer than 50 people was not included for analysis because of overfitting. In the largest ethnic cohort, the non-Hispanic white population, the top SNP associated with worse response to allopurinol (rs45499402, C allele β = 0.323 ± 0.06, P = 4.5 × 10⁻⁹). This SNP is found in the ABCG2 locus and is in perfect linkage disequilibrium (LD, r2 = 1)14 with rs2231142 (Table 2, β = 0.323 ± 0.06, P = 4.7 × 10⁻⁹, unadjusted P = 7.3 × 10⁻⁴), which encodes a glutamine to lysine change in the efflux transporter BCRP (BCRP Q141K) that reduces cell membrane expression, thereby reducing transport function. The transethnic meta-analysis (Figure 1b) showed a strong association with this same missense variant (Table 3, β = 0.29 ± 0.05, P = 5.4 × 10⁻⁹, unadjusted P = 6.7 × 10⁻⁴). Conditional analysis in the non-Hispanic white cohort, which included rs2231142 genotype as a covariate, reduced the P value of the next strongest association within the ABCG2 locus to P = 0.03, suggesting that either BCRP Q141K or an SNP in high LD is the causal SNP for the association with worse response to allopurinol (Table S1). SNPs in the intronic region of GREM2, a secreted antagonist of the bone monomorphic protein (BMP), associated with better response to allopurinol with suggestive significance (rs77567654, G allele β = −0.232 ± 0.04, P = 1.4 × 10⁻⁷). This SNP is in strong LD (r2 = 0.71)14 with rs1934341, also in the intron of GREM2, which is the top associated genotyped variant within this region (Table 3, β = −0.216 ± 0.04, P = 4.0 × 10⁻⁷, unadjusted P = 5.3 × 10⁻⁴).
Table 1:
Study Cohorts
Four cohorts were gathered for analysis. ALLO1 and ALLO2 represent multiethnic cohorts from the Kaiser Permanente Research Program on Genes Environment and Health (RPGEH) and were genotyped on genome-wide platforms. They differ only in their genotyping platform and the time of data gathering. MARSH and BioVU were gathered as replication cohorts from Marshfield Clinic and Vanderbilt University Medical Center, respectively, and genotyped for top loci.
| ALLO1 | ALLO2 | MARSH | BioVU | ||
|---|---|---|---|---|---|
| Subjects | 2,769 | 748 | 328 | 601 | |
| Genotyping | Genome-wide | Genome-wide | ABCG2 | ABCG2, GREM2 | |
| Percent | |||||
| Gender | Males | 74.4 | 73 | 65.9 | 63.7 |
| Females | 25.6 | 27 | 34.1 | 36.3 | |
| Ethnicities | Non-Hispanic Whites | 78.3 | 87.2 | 97.0 | 83.5 |
| East Asians | 12.1 | 6.4 | 0.3 | 1.8 | |
| African Americans | 4.4 | 2.7 | 0.3 | 11.8 | |
| Latinos | 4.5 | 2 | 0.6 | 0 | |
| Other | 0.7 | 1.7 | 1.2 | 2.8 | |
| Mean ± Std. Dev | |||||
| Measurements | Age at Treatment | 68.6 ± 10.7 | 68.9 ± 10.0 | 66.7 ± 13.2 | 53.4 ± 20.4 |
| Baseline SUA (mg/dL)* | 9.1 ± 2.0 | 9.1 ± 1.9 | 8.3 ± 2.1 | 7.2 ± 2.8 | |
| Post SUA (mg/dL)* | 6.5 ± 1.8 | 6.6 ± 1.7 | 6.2 ± 1.8 | 5.5 ± 2.4 | |
| SUA Change (mg/dL)* | −2.6 ± 2.0 | −2.6 ± 1.9 | −2.1 ± 1.8 | −1.8 ± 2.2 | |
| Allopurinol Dose (mg/day) | 196 ± 106 | 196 ± 96 | 209 ± 99 | 212 ± 102 | |
| Nonadherent Days (percent) | 0.28 ± 1.7 | 0.26 ± 1.4 | NA | NA | |
| eGFR** at Treatment | 59.3 ± 20.4 | 59.3 ± 20.0 | NA | NA | |
| Time to post SUA (days) | 109 ± 235 | 113 ± 283 | NA | NA | |
eGFR=estimated glomerular filtration rate, SUA= serum uric acid
1 mg/dL is equivalent to 59.5 μmol/L SUA
eGFR was calculated from serum creatinine levels using CKD-EPI equation
Figure 1.
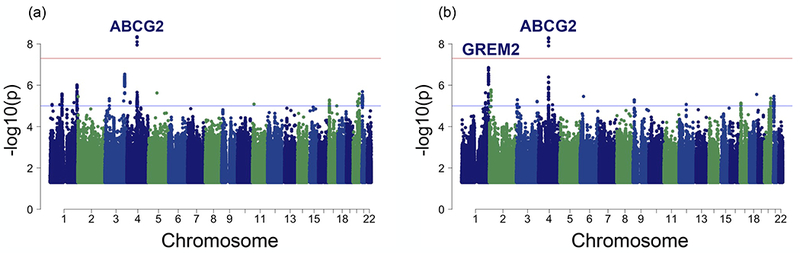
Manhattan plot of associations with change in serum uric acid following allopurinol initiation in (a) 2,647 non-Hispanic white subjects and (b) transethnic meta-analysis, including 2,647 non-Hispanic whites, 303 Asians, 115 African Americans, and 114 Latinos. Genome-wide significance (5 × 10⁻⁸) and suggestive significance (5 × 10⁻⁶) have been marked. P values > 0.05 are not graphed.
Table 2:
Top SNPs Associated with Allopurinol Response in Non-Hispanic White Cohort
Top associations from the genome-wide association studies in 2,647 Non-Hispanic Whites. To avoid reporting multiple SNPs in linkage disequilibrium, imputed data was filtered based on SNPs on the Affymetrix Axiom World genotyping platform and top 10 SNPs are shown. A1 represents the allele that the effect size is based on. Effect is defined as change in SUA (treated-untreated), therefore positive betas represent worse response to allopurinol.
| SNP | CHR | BETA | SE | P | GENE | TYPE | A1 |
|---|---|---|---|---|---|---|---|
| rs2231142 | 4 | 0.323 | 0.055 | 4.74 × 10⁻⁹ | ABCG2 | missense | T |
| rs4148155 | 4 | 0.321 | 0.055 | 7.94 × 10⁻⁸ | ABCG2 | intron | G |
| rs57449396 | 3 | 0.606 | 0.12 | 4.80 × 10⁻⁷ | TBL1XR1,NAALADL2 | intergenic | T |
| rs10802887 | 1 | −0.222 | 0.046 | 1.24 × 10⁻⁶ | GREM2 | intron | G |
| rs4148157 | 4 | 0.290 | 0.061 | 2.20 × 10⁻⁶ | ABCG2 | intron | A |
| rs61816456 | 1 | −0.226 | 0.048 | 3.31 × 10⁻⁶ | NTNG1, AMY1A | intergenic | A |
| rs79663562 | 2 | 0.446 | 0.096 | 3.55 × 10⁻⁶ | MYT1L | intron | C |
| rs1934341 | 1 | −0.212 | 0.046 | 5.04 × 10⁻⁶ | GREM2 | intron | T |
| rs10011796 | 4 | 0.188 | 0.041 | 5.06 × 10⁻⁶ | ABCG2 | intron | T |
| rs2725215 | 4 | 0.288 | 0.063 | 5.71 × 10⁻⁶ | PKD2 | intron | T |
Table 3:
Top SNPs Associated with Allopurinol Response in Trans-Ethnic Meta-Analysis
Top associations from the genome-wide association studies in trans-ethnic meta-analysis including 2,647 Non-Hispanic Whites, 303 Asians, 115 African-Americans and 114 Latinos. To avoid reporting multiple SNPs in linkage disequilibrium, imputed data was filtered based on SNPs on the Affymetrix Axiom World genotyping platform and top 10 SNPs are shown. A1 represents the allele that the effect size is based on. Effect is defined as change in SUA (treated-untreated), therefore positive betas represent worse response to allopurinol.
| SNP | CHR | BETA | SE | P | GENE | TYPE | A1 |
|---|---|---|---|---|---|---|---|
| rs2231142 | 4 | 0.290 | 0.050 | 5.36 × 10⁻⁹ | ABCG2 | missense | T |
| rs4148155 | 4 | 0.289 | 0.050 | 7.89 × 10⁻⁹ | ABCG2 | intron | G |
| rs1934341 | 1 | −0.216 | 0.043 | 4.03 × 10⁻⁷ | GREM2 | intron | T |
| rs10802887 | 1 | −0.207 | 0.042 | 7.17 × 10⁻⁷ | GREM2 | intron | G |
| rs10011796 | 4 | 0.191 | 0.039 | 7.45 × 10⁻⁷ | ABCG2 | intron | T |
| rs4148157 | 4 | 0.257 | 0.054 | 2.31 × 10⁻⁶ | ABCG2 | intron | A |
| rs10193126 | 2 | −0.183 | 0.039 | 3.23 × 10⁻⁶ | TRIB2, FAM84A | intergenic | C |
| rs9366772 | 6 | −0.265 | 0.057 | 3.47 × 10⁻⁶ | HLA-C, HCG27 | intergenic | A |
| rs76979899 | 4 | 0.249 | 0.055 | 4.92 × 10⁻⁶ | ABCG2 | intron | T |
| rs4659982 | 1 | −0.179 | 0.039 | 5.82 × 10⁻⁶ | GREM2 | intron | C |
Because variants in ABCG2 were previously identified as determinants of allopurinol response, we gathered two independent replication cohorts and genotyped them for ABCG2 variants identified in our analysis. The association with the reduced function BCRP Q141K was strengthened with the addition of these replication cohorts (Figure 2a, β = 0.293 ± 0.05, P = 8.1 × 10⁻¹¹) strongly supporting a role for the efflux transporter in allopurinol’s uric acid–lowering effects. We gathered genotypic data from 355 BioVU subjects to replicate our suggestive association with variants in GREM2. In fact, rs1934341 associated with improved response in all of our cohorts as well as BioVU (Figure 2b, β = −0.162 ± 0.035, P = 3.2 × 10⁻⁶). Although the association was not genome-wide significant, it was consistent across multiple cohorts and ethnicities. To further explore the effects of these SNPs on clinically meaningful outcomes, we explored additional phenotypes. In particular, in the largest cohort, the non-Hispanic whites, we explored the effect of the top SNPs in ABCG2 and GREM2 on the ability to reach and maintain the rheumatologist-recommended SUA < 6 mg/day while adherent to allopurinol. We found that 26.1% of 1,316 non-Hispanic white subjects were able to reach and maintain rheumatologist-recommended SUA concentrations, with an average time to SUA reading of 502 days and a range of 0–19 years. Logistic regression analysis revealed that subjects carrying at least one BCRP Q141K allele were at a greater risk of not meeting the clinical endpoint, even when controlling for the covariates of dose, gender, and baseline SUA (Figure 3a, OR = 0.71 ± 0.14, P = 0.02). In contrast, subjects carrying at least one allele of the GREM2 variant rs1934341 were more likely to achieve and maintain target SUA concentrations (Figure 3b, OR = 1.35 ± 0.11, P = 0.009). Previously, we showed that BCRP transports oxypurinol and allopurinol, so with a reduced function variant we would expect less efflux of oxypurinol by BCRP, thereby increasing plasma concentrations of the drug but decreasing luminal concentrations. Thus, we hypothesized that oxypurinol may have a secondary mechanism of action as an inhibitor of uric acid reabsorption. GWAS have shown that genetic variants in GLUT9 and URAT1 significantly affect SUA concentrations, suggesting an important role of uric acid reabsorption in the determination of systemic uric acid concentrations.15 In Xenopus laevis oocytes, we found that oxypurinol can indeed inhibit the uptake of uric acid via GLUT9 more potently than its inhibition of either OAT4 or URAT1 (Figure 4, IC50 = 108 ± 17 µM for GLUT9, and IC50 > 1 mM for URAT1 and OAT4, Figure S1 and Text S1).16 Though further work is clearly needed, the data suggest that oxypurinol may inhibit GLUT9 in the proximal tubule.
Figure 2.
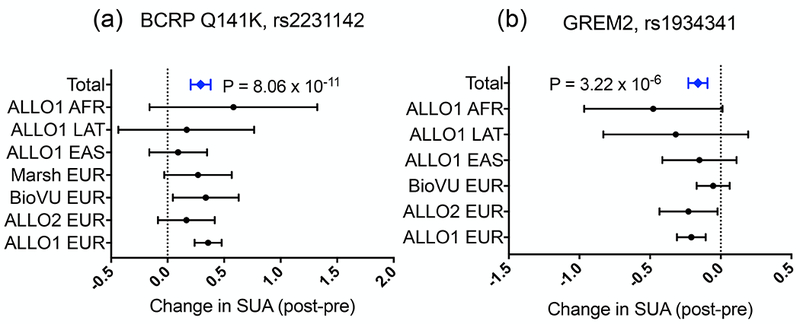
Forest plot representing the 95% confidence interval for effects of (a) BCRP Q141K and (b) GREM2 rs1934341 on allopurinol response. Effect is change in serum uric acid (SUA) (postallopurinol – preallopurinol), meaning that positive effect sizes represent less change in SUA and worse response. Zero represents the average change in SUA for subjects with the reference allele. “Total” values represent the 95% confidence interval of inverse-variance weighted meta-analysis. BCRP, breast cancer resistance protein; SUA, serum uric acid.
Figure 3.
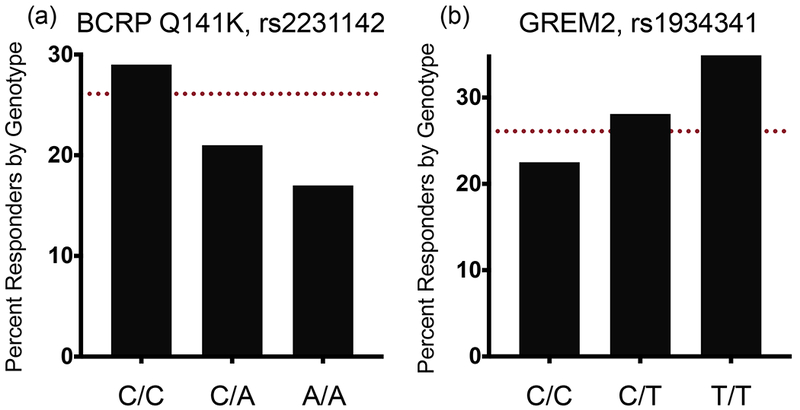
Non-Hispanic white subjects were defined as responders or nonresponders based on their ability to reach and maintain the rheumatologist-recommended serum uric acid (SUA) concentration < 6 mg/dL while on allopurinol treatment. Response rate by (a) BCRP Q141K genotype (rs2231142) or (b) GREM2 rs1934341 are shown, compared with the response of the overall cohort (red dashed line). Logistic regression reveals that independent of dose, gender, and baseline SUA, these variants are predictors of a subject’s likelihood of reaching and maintaining healthy SUA concentrations. BCRP, breast cancer resistance protein.
Figure 4.
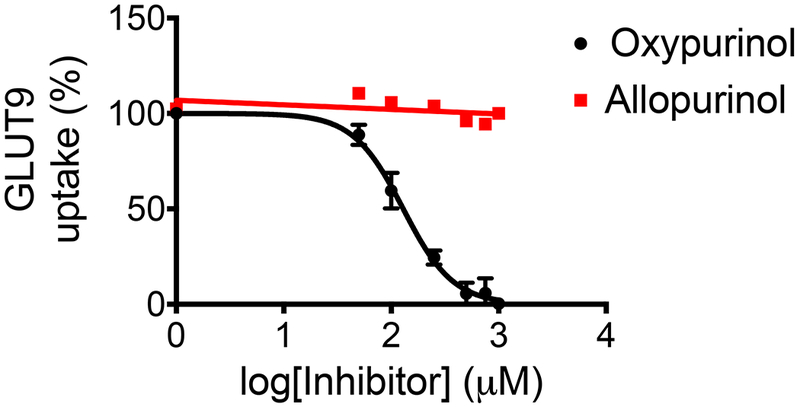
Xenopus laevis oocytes injected with GLUT9 mRNA were incubated with [14C]-uric acid and increasing amounts of allopurinol (red) and oxypurinol (black). Oxypurinol was able to inhibit GLUT9-mediated uptake of uric acid with an half maximal inhibitory concentration (IC50) of 108 ± 17 μM, while allopurinol showed little to no inhibition of GLUT9.
DISCUSSION
This study represents the largest genetic analysis of allopurinol response to date, and the first to show genome-wide level significance of the reduced function variant, BCRP Q141K, with hypouricemic response to allopurinol. Previously, in a smaller cohort, we showed that the reduced function variant BCRP Q141K associated with worse response to allopurinol, at near genome-wide levels. In this study, with an expanded cohort and several new cohorts, we replicated our finding that this variant is associated with poor response to allopurinol with genome-wide significance (Figures 1 and 2 and S2). Importantly, we conducted conditional analyses, which suggest that BCRP Q141K is causal for poor response to allopurinol. The inclusion of two independent replication cohorts strengthened the association between the variant and response to allopurinol. Other groups have replicated this association as well, although these studies were not able to adjust for differences in baseline SUA and used a response variable rather than linear change in SUA.17,18 Allopurinol, an older drug, remains first-line therapy for gout. In fact, though newer drugs have been developed and marketed, many of these are associated with serious adverse effects. For example, in a recent multicenter noninferiority trial in patients with gout and cardiovascular disease, febuxostat was associated with higher overall all-cause mortality and cardiovascular mortality than allopurinol.19 Furthermore, first-in- class drugs developed to target reabsorptive uric acid transporters such as lesinurad have been associated with kidney stones and other sequelae. Conversely, allopurinol seems to have beneficial effects on renal function, slowing disease progression in patients with chronic kidney disease.20 Thus, there has been increasing interest in allopurinol, as the drug appears to be beneficial for the treatment of gout as well as its sequelae. Unfortunately, many patients fail to achieve acceptable responses to the drug, even when adherent. Importantly, individuals with the BCRP Q141K variant were found to be less likely to achieve and maintain the rheumatologist-recommended SUA concentration of 6 mg/dL or less (Figure 3), putting them at an increased risk for developing comorbidities. Furthermore, this finding was significant despite including covariates such as gender, dose, and baseline SUA. Collectively, these studies suggest that patients with the BCRP Q141K variant either need to be on a higher dose of allopurinol or perhaps be prescribed concomitant or other medications for the treatment of gout (Figure S3). Our transethnic meta-analysis not only supported the association of BCRP Q141K with poor response to allopurinol in multiple ethnic groups but revealed a novel (P < 5 × 10⁻⁶) association with genetic variants in GREM2. For GREM2, subjects carrying the minor allele had a greater change in SUA on allopurinol and were significantly more likely to reach and maintain rheumatologist-recommended SUA concentrations (Figure 3). GREM2 is a secreted antagonist of BMP that has been shown to play a role in cell differentiation and limit inflammation after myocardial infarctions in mice.21–23 GREM2 has been previously shown to be upregulated in glomeruli of rats with diabetic kidney disease, and dysregulation of its target, BMP, has been linked to diabetic kidney nephropathy and cardiovascular disease,24,25 suggesting a role for GREM2 in the development of common gout sequelae. Interestingly, GREM2 has not been shown to associate with baseline SUA or gout, suggesting that its role in improving allopurinol response is pharmacologic, related to allopurinol’s effects on uric acid lowering. Further research is needed to determine the mechanism by which these SNPs alter GREM2 expression and function, and allopurinol’s hypouricemic response. The finding that oxypurinol potently inhibited GLUT9-mediated uric acid uptake is an important addition to understanding the potential mechanisms of action of allopurinol and oxypurinol. In particular, we found that oxypurinol inhibited GLUT9-mediated uptake of uric acid with an half maximal inhibitory concentration (IC50) of 108 μM, suggesting that oxypurinol may have a secondary mechanism of action as a uricosuric. Plasma oxypurinol concentrations on a typical 300 mg dose of allopurinol range from approximately 30–80 μM, and it is possible that renal concentrations of oxypurinol26,27 may be comparable and inhibit GLUT9. In this scenario, BCRP Q141K could indeed cause worse response to allopurinol because of the decreased secretion of oxypurinol and therefore reduced concentration in the renal tubule resulting in decreased inhibition of GLUT9. In the intestine, GLUT9 is expressed with a high expression level on the basolateral membrane of enterocytes, and appears to participate in intestinal excretion of uric acid.28 A reduced function variant of BCRP, also expressed in enterocytes,29 would result in higher concentrations of allopurinol and oxypurinol within the enterocyte, and potentially increased inhibition of intestinal GLUT9-mediated intestinal excretion of uric acid. Both the renal and intestinal mechanisms are speculative and need further investigation. There are limitations to our findings in addition to those previously addressed. First, as BCRP Q141K is associated with higher baseline SUA and gout,15,30 it is possible that the variant associated with allopurinol response by increasing plasma concentrations of uric acid, or that patients carrying this variant have a worse disease overall and therefore do not respond as well. However, we adjusted for baseline SUA in our model to adjust for the effects of the variant on SUA concentration. Furthermore, genetic variants in other renal uric acid transporters, including GLUT9 and URAT1 did not associate with allopurinol response adjusted for baseline SUA. This is also true of many other genes that associate with SUA concentration that we do not see in our results (Table S2). In fact, BCRP Q141K does not associate with baseline SUA in our cohort at genome-wide significance (Table S3). These data support an independent association of ABCG2 with response to allopurinol. Second, adherence to allopurinol is a large problem and one that could also cause nonresponse. To address this, we have accounted for nonadherence using prescription refills and only allowed subjects included in the analysis to go one week in between prescriptions. Finally, we are limited by data available for our cohort, which does not include oxypurinol concentrations or concomitant drugs other than diuretics that may affect SUA through off-target effects. With the growing prevalence of gout, there has been a resurgence of interest in its treatment. Allopurinol is first-line treatment, but inadequate response and hypersensitivity reactions continue to be a concern for its use. With the higher rate of all-cause mortality in gout patients associated with febuxostat therapy when compared with allopurinol,19 the potential problems with the development of kidney stones for lesinurad, and higher costs for new drugs, there remains high interest in characterizing the factors that predict improved response to allopurinol. Our data pave the way to using genetic information to better predict response to allopurinol and select optimal therapy for gout.
METHODS
Study cohorts
ALLO1 and ALLO2.
Data from the Kaiser Permanente Research Program on Genes, Environment and Health were gathered for analysis. ALLO1 is made up of subjects gathered as a part of the GERA Cohort, while ALLO2 is made up of subjects whose DNA was genotyped as a part of this project and not the GERA cohort. Subjects with both treated and baseline SUA readings were included in the final study population. Baseline readings were considered any SUA reading within 1.5 years before allopurinol initiation and treated readings were considered any reading after 4 days of allopurinol initiation but no more than 7 days after termination. Treatment periods were defined as the length of time a subject remained adherent to allopurinol, as determined by medication refills. If multiple baseline SUA readings existed, the closest to allopurinol initiation was chosen. If multiple treated readings or treatment periods met inclusion criteria, the first was chosen. The study population consisted of 3,517 subjects, 2,820 of which were non-Hispanic whites. The average age of the cohort was approximately 67 years old at the time of sample collection for genotyping.
BioVU.
Data from BioVU (Vanderbilt University Medical Center Biorepository12) meeting inclusion criteria were gathered for analysis as a part of the Pharmacogenomics Research Network (PGRN) PGPop (PharmacoGenomic discovery and replication in very large patient POPulations) collaboration. Inclusion criteria were identical to those of ALLO1, except that if multiple treated readings existed, the median was taken. Information from 601 subjects was gathered for analysis, 481 of which were non-Hispanic whites. The average age of the cohort was approximately 53 years old at the time of baseline SUA reading.
MARSH.
Data from Marshfield Personalized Medicine Research Project13 meeting inclusion criteria were gathered for analysis as a part of the PGRN PGPop collaboration. Inclusion criteria were identical to those of ALLO1. Information from 328 subjects was gathered for analysis, 312 of which were non-Hispanic whites. The average age of the cohort was approximately 67 years old at the time of baseline SUA reading.
Genotyping and imputation
Detailed methods on the genotyping and imputation of ALLO1 can be found in Kvale et al.31 Briefly, subjects were genotyped on ethnic-specific Affymetrix Axiom World Arrays. For subjects in ALLO2, DNA extracted from saliva or blood was sent to RIKEN Institute for genotyping on the Illumuna Infinium OmniExpressExome chip according to standard protocol. Samples with a call rate < 0.98 were excluded. After reclustering without these samples, SNPs with a call rate < 0.99 were excluded from analysis. Four parameters were examined to determine and exclude ambiguous calls: cluster separation score, mean fluorescence difference, mean fluorescence angle, and frequency of excess heterozygotes. Post–Quality Control genotyped data for ALLO1 and ALLO2 were imputed using the 1000 Genomes Project32 as a cosmopolitan reference panel. As a quality control, we used the r2 info metric, which estimates the correlation of the true genotype to the imputed genotype, and set a cutoff of r2 > 0.3 for inclusion in our analyses. Subjects from BioVU and MARSH were genotyped at top loci in ABCG2 using Sequenom MassARRAY genotyping platform according to protocol. A call rate of 90% was used as a quality control cutoff for both SNPs and subjects. No SNPs showed evidence of HapMap Mendelian Errors and Concordance with HapMap samples was 100%. Samples from a subset of subjects from BioVU were also used to replicate the association with SNPs in GREM2. These samples were genotyped as a part of the BioVU program, described in more detail in Roden et al.12 Briefly, samples were genotyped across four Illumina platforms (MEGeX, OMNI-Quad, OMNI5M, 660w). Post–Quality Control genotype data were imputed using the HRCv1.133 reference panel, and any SNP with info metric r2 < 0.5 was excluded from analysis. Of the BioVU cohort, 355 subjects had been genotyped as a part of this effort, and data for rs1934341 were gathered for replication analysis.
Genetic ancestry
Detailed methods on the computation of principal components for ALLO1 can be found in Banda et al.34 Plink v1.9035 was used to compute principal components for ALLO2. Subjects were split by ethnicity and due to small sample size, each ethnic group was combined with appropriate ancestral ethnicities from the Human Genome Diversity Project36 to calculate principal components. These were used in GWAS to adjust for genetic ancestry.
Genome-wide association study and meta-analyses
Association analysis was conducted using a linear regression model in PLINK v1.90 on autosomal chromosomes.35 The phenotype was calculated as the change in SUA (treated-baseline). Covariates were added to the model in a stepwise fashion and models were evaluated against the baseline model using ANOVA with a cutoff of P < 0.05. This generated the final model (Table S4): The top 10 principal components were included for the non-Hispanic white subjects, and the top 6 for all other ethnicities to correct for population stratification. Variants with greater than 10% missing genotypes or less than 0.01 minor allele frequency were filtered from analysis. Regression was done in each individual ethnic group and cohort, then results were combined via fixed effects inverse-variance weighted meta-analysis using Genome-Wide Association Meta Analysis software (University of hits were evaluated for extreme departure from Hardy-Weinberg equilibrium. R v3.4.0 38 was used for phenotype generation and visualization. Analysis on baseline SUA was performed in a similar manner, using the following model:
Baseline SUA~Age + Concomitant Diuretics + Gender + eGFR + BMI + Principal Components
Conditional analysis
Analysis was performed in the same manner as for allopurinol response GWAS, including the genotype for rs2231142 as an additional covariate. Linear regression was performed in non-Hispanic white population of both ALLO1 and ALLO2 separately and combined via inverse-variance weighted meta-analysis.
Logistic regression analysis on maintaining SUA < 6 mg/dL
Information from each subject’s treatment period was gathered for analysis, and 1,316 non-Hispanic white subjects with more than one treated reading were gathered for analysis. Subjects were defined as having complete (all treated readings below the recommended 6 mg/dL) or inadequate (no or some readings below this threshold) clinical response to allopurinol. Covariates were tested in a similar manner to uric acid change, generating the final model:
Clinical Response~Baseline SUA + Gender + Dose
Logistic regression was performed using R v3.4.038 on this model with the genotype for BCRP Q141K (rs2231142) and GREM2 rs1934341.
X. laevis oocyte GLUT9 inhibition studies
A pOX-hGLUT9b plasmid, which contains the sequence of human GLUT9 (hGLUT9b, NM_001001290.1) cloned into pOX vector (https://www.addgene.org/vector-database/3780/), was used to generate hGLUT9b capped cRNA. pOX-hGLUT9b plasmid was linearized using NotI restriction enzyme and cRNA generated using the mMessage mMachine T7 kit (Thermo Fisher Scientific, Waltham, MA). Ecocyte Bio Science LLC (Austin, TX) provided stage VI, defollicuted oocytes along with oocyte injection services. Five to ten oocytes were selected per condition and each oocyte was injected with 50 nL of saline or hGLUT9b cRNA (40 ng per oocyte). Oocytes were incubated on a shaker at 18°C in Modified Barth’s solution with gentamicin (NaCl 88 mM, KCl 1 mM, MgSO4 1 mM, HEPES 5 mM, NaHCO3 2.5 mM, CaCl2 0.7 mM, Gentamicin 100 μg/mL) that was replenished every 24 hours. Forty-eight hours post-injection, 20-minute uptake assays were performed. Modified Barth’s solution containing trace amount of labeled [14C]-uric acid (American Radiolabeled Chemicals, ARC 0513A, St. Louis, MO) (10 μM total of uric acid) with increasing concentrations of oxypurinol or allopurinol (0–1 mM dissolved in 0.1 M sodium hydroxide) was used as the uptake buffer. After uptake, oocytes were washed five times in ice-cold buffer then lysed in 0.5 mL of 1% sodium dodecyl sulfate solution for at least 1 hour. Radioactivity (disintegrations per minute) was measured using a liquid scintillation counter. IC50 values for oxypurinol and allopurinol were calculated by non-linear regression using GraphPad Prism 7 (La Jolla, CA). Figures are representative of three experiments using 5-10 oocytes per condition per experiment.
Supplementary Material
Figure S1. Inhibition of URAT1 by allopurinol and oxypurinol.
Figure S2. Associations of top loci within subgroups of ALLO1.
Figure S3. Dose response to allopurinol by BCRP Q141K genotype.
Text S1. HEK293 URAT1 inhibition studies.
Table S1. Summary statistics for ALLO1 and ALLO2 cohorts, split by ethnicity.
Table S2. Conditional analysis of allopurinol response.
Table S3. Genetic variants previously associated with SUA concentration and their effects on allopurinol response.
Table S4. Genetic variants previously associated with SUA.
Table S5. Nongenetic factors associated with allopurinol response.
STUDY HIGHLIGHTS.
WHAT IS THE CURRENT KNOWLEDGE ON THE TOPIC?
There has been one genome-wide association study on allopurinol response performed previously. While variants in ABCG2 were shown to associate with worse response, the association with breast cancer resistance protein (BCRP) Q141K was not genome-wide significant. URAT1 and BCRP have been shown to transport oxypurinol, but any interactions between oxypurinol and GLUT9 are unknown.
WHAT QUESTION DID THIS STUDY ADDRESS?
What are the genetic factors that associate with allopurinol-induced change in serum uric acid, and how do these factors affect long-term control of serum uric acid?
WHAT DOES THIS STUDY ADD TO OUR KNOWLEDGE?
We identified BCRP Q141K as a risk factor for worse response to allopurinol and long-term inadequate control of serum uric acid. Genetic variants in GREM2 associated with better response with suggestive significance. Furthermore, this is the first study to show that oxypurinol inhibits uric acid uptake by GLUT9, suggesting a secondary mechanism of action.
HOW MIGHT THIS CHANGE CLINICAL PHARMACOLOGY OR TRANSLATIONAL SCIENCE?
This study adds to the mounting evidence that oxypurinol and allopurinol may have secondary mechanisms in addition to xanthine oxidase inhibition. The study supports the development and implementation of precision dosing models of allopurinol incorporating the BCRP Q141K genotype.
ACKNOWLEDGMENTS
Great appreciation to the RIKEN Institute for Integrative Medical Sciences, the PGRN-RIKEN collaboration, and PGRN PGPop collaboration for their donated time and resources. Special thanks to John Witte and Rada Savic for their support and insight in the data analysis.
FUNDING
This study was funded by NIH R01DK103729 and UCSF Discovery Fellowship.
Footnotes
SUPPORTING INFORMATION
Supplementary information accompanies this paper on the Clinical Pharmacology & Therapeutics website (www.cpt-journal.com).
CONFLICTS OF INTEREST
K.M.G. and S.W.Y. are co-founders of Apricity Therapeutics, a transporter-based biotechnology company. All other authors declared no competing interests for this work.
References
- 1.Kuo CF, Grainge MJ, Zhang W & Doherty M Global epidemiology of gout: prevalence, incidence and risk factors. Nat. Rev. Rheumatol. 11, 649–662 (2015). [DOI] [PubMed] [Google Scholar]
- 2.Essex MN, Hopps M, Bienen EJ, Udall M, Mardekian J & Makinson GT Evaluation of the relationship between serum uric acid levels and cardiovascular events in patients with gout: a retrospective analysis using electronic medical record data. J. Clin. Rheumatol. 23, 160–166 (2017). [DOI] [PubMed] [Google Scholar]
- 3.Paul BJ, Anoopkumar K & Krishnan V Asymptomatic hyperuricemia: is it time to intervene? Clin. Rheumatol. 36, 2637–2644 (2017). [DOI] [PubMed] [Google Scholar]
- 4.Bardin T & Richette P Impact of comorbidities on gout and hyperuricaemia: an update on prevalence and treatment options. BMC Med. 15, 123 (2017). [DOI] [PMC free article] [PubMed] [Google Scholar]
- 5.Roughley MJ, Belcher J, Mallen CD & Roddy E Gout and risk of chronic kidney disease and nephrolithiasis: meta-analysis of observational studies. Arthritis Res. Ther. 17, 90 (2015). [DOI] [PMC free article] [PubMed] [Google Scholar]
- 6.Kuo CF, Grainge MJ, Mallen C, Zhang W & Doherty M Comorbidities in patients with gout prior to and following diagnosis: case-control study. Ann. Rheum. Dis. 75, 210–217 (2016). [DOI] [PMC free article] [PubMed] [Google Scholar]
- 7.Graham GG, Stocker SL, Kannangara DRW & Day RO Predicting response or non-response to urate-lowering therapy in patients with gout. Curr. Rheumatol. Rep. 20, 47 (2018). [DOI] [PubMed] [Google Scholar]
- 8.Becker MA et al. Febuxostat compared with allopurinol in patients with hyperuricemia and gout. N. Engl. J. Med. 353, 2450–2461 (2005). [DOI] [PubMed] [Google Scholar]
- 9.Stamp LK et al. Impaired response or insufficient dosage? Examining the potential causes of “inadequate response” to allopurinol in the treatment of gout. Semin. Arthritis Rheum. 44, 170–174 (2014). [DOI] [PMC free article] [PubMed] [Google Scholar]
- 10.Wen CC, Genome-wide association study identifies ABCG2 (BCRP) as an allopurinol transporter and a determinant. [DOI] [PMC free article] [PubMed]
- 11.Resource for Genetic Epidemiology Research on Adult Health and Aging (GERA). dbGaP study Accession: phs000674.v1p1. [Google Scholar]
- 12.Roden DM et al. Development of a large-scale de-identified DNA biobank to enable personalized medicine. Clin. Pharmacol. Ther. 84, 362–369 (2008). [DOI] [PMC free article] [PubMed] [Google Scholar]
- 13.McCarty CA, Wilke RA, Giampietro PF, Wesbrook SD & Caldwell MD Marshfield Clinic Personalized Medicine Research Project (PMRP): design, methods and recruitment for a large population-based biobank. Per. Med. 2, 49–79 (2005). [DOI] [PubMed] [Google Scholar]
- 14.Ward LD & Kellis M HaploReg: a resource for exploring chromatin states, conservation, and regulatory motif alterations within sets of genetically linked variants. Nucleic Acids Res. 40, D930–D934 (2012). [DOI] [PMC free article] [PubMed] [Google Scholar]
- 15.Kottgen A et al. Genome-wide association analyses identify 18 new loci associated with serum urate concentrations. Nat. Genet. 45, 145–154 (2013). [DOI] [PMC free article] [PubMed] [Google Scholar]
- 16.Iwanaga T, Kobayashi D, Hirayama M, Maeda T & Tamai I Involvement of uric acid transporter in increased renal clearance of the xanthine oxidase inhibitor oxypurinol induced by a uricosuric agent, benzbromarone. Drug Metab. Dispos. 33, 1791–1795 (2005). [DOI] [PubMed] [Google Scholar]
- 17.Roberts RL et al. ABCG2 loss-of- function polymorphism predicts poor response to allopurinol in patients with gout. Pharmacogenomics J. 17, 201–203 (2017). [DOI] [PubMed] [Google Scholar]
- 18.Wallace MC et al. Association between ABCG2 rs2231142 and poor response to allopurinol: replication and meta-analysis. Rheumatology 57, 656–660 (2018). [DOI] [PubMed] [Google Scholar]
- 19.White WB et al. Cardiovascular safety of febuxostat or allopurinol in patients with gout. N. Engl. J. Med. 378, 1200–1210 (2018). [DOI] [PubMed] [Google Scholar]
- 20.Panchapakesan U & Pollock C Drug repurposing in kidney disease. Kidney Int. 94, 40–48 (2018). [DOI] [PubMed] [Google Scholar]
- 21.Sanders LN et al. BMP antagonist gremlin 2 limits inflammation after myocardial infarction. Circ. Res. 119, 434–449 (2016). [DOI] [PMC free article] [PubMed] [Google Scholar]
- 22.Nolan K & Thompson TB The DAN family: modulators of TGF-beta signaling and beyond. Protein Sci. 23, 999–1012 (2014). [DOI] [PMC free article] [PubMed] [Google Scholar]
- 23.Li W et al. Gremlin2 regulates the differentiation and function of cardiac progenitor cells via the notch signaling pathway. Cell. Physiol. Biochem. 47, 579–589 (2018). [DOI] [PubMed] [Google Scholar]
- 24.Zou HH, Yang PP, Huang TL, Zheng XX & Xu GS PLK2 plays an essential role in high D-glucose- induced apoptosis, ROS generation and inflammation in podocytes. Sci. Rep. 7, 4261 (2017). [DOI] [PMC free article] [PubMed] [Google Scholar]
- 25.Kim M & Choe S BMPs and their clinical potentials. BMB Rep. 44, 619–634 (2011). [DOI] [PMC free article] [PubMed] [Google Scholar]
- 26.Stocker SL et al. The pharmacokinetics of oxypurinol in people with gout. Br. J. Clin. Pharmacol. 74, 477–489 (2012). [DOI] [PMC free article] [PubMed] [Google Scholar]
- 27.Wright DF, Stamp LK, Merriman TR, Barclay ML, Duffull SB & Holford NH The population pharmacokinetics of allopurinol and oxypurinol in patients with gout. Eur. J. Clin. Pharmacol. 69, 1411–1421 (2013). [DOI] [PubMed] [Google Scholar]
- 28.DeBosch BJ, Kluth O, Fujiwara H, Schurmann A & Moley K Early-onset metabolic syndrome in mice lacking the intestinal uric acid transporter SLC2A9. Nat. Commun. 5, 4642 (2014). [DOI] [PMC free article] [PubMed] [Google Scholar]
- 29.Meyer zu Schwabedissen HE & Kroemer HK In vitro and in vivo evidence for the importance of breast cancer resistance protein transporters (BCRP/MXR/ABCP/ABCG2). Handb. Exp. Pharmacol. 201, 325–371 (2011). [DOI] [PubMed] [Google Scholar]
- 30.Matsuo H et al. Genome-wide association study of clinically defined gout identifies multiple risk loci and its association with clinical subtypes. Ann. Rheum. Dis. 75, 652–659 (2016). [DOI] [PMC free article] [PubMed] [Google Scholar]
- 31.Kvale MN et al. Genotyping informatics and quality control for 100,000 subjects in the genetic epidemiology research on adult health and aging (GERA) cohort. Genetics 200, 1051–1060 (2015). [DOI] [PMC free article] [PubMed] [Google Scholar]
- 32.1000 Genomes Project C et al. An integrated map of genetic variation from 1,092 human genomes. Nature 491, 56–65 (2012). [DOI] [PMC free article] [PubMed] [Google Scholar]
- 33.McCarthy S et al. A reference panel of 64,976 haplotypes for genotype imputation. Nat. Genet. 48, 1279–1283 (2016). [DOI] [PMC free article] [PubMed] [Google Scholar]
- 34.Banda Y et al. Characterizing Race/ethnicity and genetic ancestry for 100,000 subjects in the genetic epidemiology research on adult health and aging (GERA) cohort. Genetics 200, 1285–1295 (2015). [DOI] [PMC free article] [PubMed] [Google Scholar]
- 35.Purcell S et al. PLINK: a tool set for whole-genome association and population-based linkage analyses. Am. J. Hum. Genet. 81, 559–575 (2007). [DOI] [PMC free article] [PubMed] [Google Scholar]
- 36.Cavalli-Sforza LL The Human Genome Diversity Project: past, present and future. Nat. Rev. Genet. 6, 333–340 (2005). [DOI] [PubMed] [Google Scholar]
- 37.Magi R & Morris AP GWAMA: software for genome-wide association meta-analysis. BMC Bioinformatics 11, 288 (2010). [DOI] [PMC free article] [PubMed] [Google Scholar]
- 38.R Core Team. R: A Language and Environment for Statistical Computing (R Foundation for Statistical Computing, Vienna, Austria, 2017). [Google Scholar]
Associated Data
This section collects any data citations, data availability statements, or supplementary materials included in this article.
Supplementary Materials
Figure S1. Inhibition of URAT1 by allopurinol and oxypurinol.
Figure S2. Associations of top loci within subgroups of ALLO1.
Figure S3. Dose response to allopurinol by BCRP Q141K genotype.
Text S1. HEK293 URAT1 inhibition studies.
Table S1. Summary statistics for ALLO1 and ALLO2 cohorts, split by ethnicity.
Table S2. Conditional analysis of allopurinol response.
Table S3. Genetic variants previously associated with SUA concentration and their effects on allopurinol response.
Table S4. Genetic variants previously associated with SUA.
Table S5. Nongenetic factors associated with allopurinol response.