Abstract
We describe the luminescence spectral properties of CdS nanoparticles with multiphoton excitation. Three types of CdS nanoparticles were examined which were a CdS/dendrimer composite which displays high anisotropy, Cd2+-enriched nanoparticles which display two emission maxima, and polyphosphate-stabilized nanoparticles which display long wavelength emission. Illumination with long wavelengths near 700–790 nm resulted in two-photon excitation. Essentially the same emission spectra and intensity decays were observed with one-photon and two-photon excitation. Comparison with fluorescein indicates the NPs display large two-photon cross sections near 100 GM. The CdS/dendrimer and Cd2+-enriched CdS nanoparticles displayed large anisotropy values with two-photon excitation, substantially larger than with one-photon excitation. It appears that semiconductor nanoparticles are comparable to organic fluorophores which display the same spectral properties with one-photon and two-photon excitation.
Introduction
There is growing interest in the use of semiconductor nanoparticles as luminescence probes. Photoluminescence from small inorganic particles was first reported less than 20 years ago.1-2 It is now known that nanosized particles with 10 to 100 Å diameters display quantum confinement and unique optical and physical properties.3-6 There has been progress in synthesizing homogeneous size nanoparticles preparation and stabilization of the surfaces to improve the luminescent properties.7-8 Stabilized semiconductor nanoparticles have been used as biological or intracellular probes,9-10 and there is growing interest in their use as chemical sensors.11-13 The emission spectral properties of some CdS are known to be sensitive to binding of double helical DNA or oligonucleotides.14-16 Nanoparticles with covalently bound DNA are being used to create organized nanocrystals17-18 or to measure DNA hybridization.19
In recent reports, we described the steady state and time-resolved emission spectral properties of several types of CdS nanoparticles.20-21 We found the CdS nanoparticles displayed complex intensity decays with decay times ranging from several ns to 10 μs. We also found that some CdS nanoparticles display red emission, are resistant to collisional quenching, and display linearly polarized emission with polarized excitation.20-21
We now continue our study of the fluorescence spectral properties of CdS nanoparticles with two-photon excitation. Multiphoton excitation (MPE) has become extensively used in fluorescence spectroscopy22-24 and for cellular imaging.25-26 The advantage of MPE include localized excitation at the focal point of the objective and minimal photochemical damage. There have been only two previous reports on two-photon excitation (2PE) of semiconductor nanoparticles.27,28 There have also been reports on multiphoton excitation of porous silicon,29 diamond,30 or CuCl nanoparticles.31 In the case of organic fluorophores, the emission spectral properties, except for the extent of polarization photoselection, are identical for one-, two-, and three-photon excitation.32 However, it was not clear if semiconductor NPs would display the same or distinct emission spectra properties with one-photon and two-photon excitation. Three types of CdS nanoparticles were examined: a CdS/dendrimer nanocomposite which displays high anisotropy, Cd2+-enriched NPs which bind DNA,16,21 and polyphosphate stabilized (PPS) NPs which display long wavelength emission, microsecond decay times, and resistance to collisional quenchin.16,20-21
Materials and Methods
Nanoparticle Preparation.
The blue emitting CdS/dendrimer composite particles were prepared in the presence of poly-(aminoamine) starburst dendrimer, generation 4.0.33 This starburst dendrimer (PAMAM) of generation 4.0, which was purchased from Aldrich, is expected to have 64 surface amino groups and have a diameter near 40 Å. On the basis of the manufacturer’s value of the dendrimer weight fractions in MeOH and the known dendrimer densities, we prepared dendrimer stock solutions of 1.14 × 10⁻⁴ M in MeOH under a N2 atmosphere of 10 °C. The 2.0 mM stock solutions of Cd2+ and S2− were prepared by dissolving 62 mg of Cd(NO3)2•4H2O (Baker) in 100 mL of MeOH and by dissolving 15 mg of Na2S (Alfa) in 100 mL of MeOH. The Cd2+ and S2− stock solutions were freshly prepared. In the standard incremental addition procedure, a 0.50 mL aliquot of Cd2+ stock solution was added to 10 mL of the dendrimer stock solution at 10 °C, followed by addition of a 0.50 mL aliquot of S2− stock solution. The Cd2+ and S2− additions were repeated 10 times. The resulting solution was colorless and glowed bright blue under UV illumination. The product was stored in a freezer and did not show any evidence of precipitation.
The red emitting particles are also composed of CdS but stabilized with polyphosphate.16 The polyphosphate-stabilized (PPS) CdS nanoparticles were prepared as follows. To a three-necked round-bottomed flask with a stir bar was added 100 mL purified and deionized water (Continental Waters Systems). The water was deoxygenated by sparging with nitrogen gas for ~20 min, and the subsequent steps were performed in dim light and under an N2 blanket. Cd(NO3)2•4H2O and Na6(PO3)6 were added as solids to produce a 2 × 10⁻⁴ M solution in each. The pH of the solution was adjusted to 9.8 with 0.01 M NaOH. Anhydrous Na2S (1.6 mg, to yield 2 × 10⁻⁴ M sulfide) was dissolved in 2 mL of water, and this solution was added dropwise to the Cd2+–polyphosphate solution with vigorous stirring. The solution turned yellow, and stirring was continued for 20 min. Under ultraviolet illumination, the solution glowed orange-red.
The Cd2+-enriched CdS nanoparticles were prepared as described previously.16,34 To surface-enrich the CdS nanoparticles with Cd2+, the pH of 5 mL of the stock solution was brought to 10.5 with 0.01 M NaOH. Aliquots of 0.1 M Cd-(NO3)2•4H2O were added and the reaction was monitored by photoluminescene spectroscopy until the high-energy band at 480 nm was at its maximum intensity (roughly an 8-fold addition of Cd2+). Visually, the solution turned yellow. Under UV light, the solution glowed orange-pink.
Spectroscopic Measurements.
Frequency-domain (FD) intensity and anisotropy decays were measured with instrumentation described previously.35 The excitation source was the fs pulsed output of a mode-locked Ti:sapphire laser, either the fundamental output near 800 nm or the frequency-doubled output near 400 nm. As needed, the pulse repetition frequency was decreased using an acousto-optic pulse picker. The FD data were interpreted in terms of the multiexponential model
| (1) |
where αi are the preexponential factors and τi the decay times. The fractional contribution of each decay time component to the steady-state emission is given by
| (2) |
Frequency-domain anisotropy decay data were measured and analyzed as described previously36 in terms of multiple correlation times
| (3) |
In this expression, r0k is the fractional anisotropy amplitude which decays with a correlation time θk.
The steady-state emission anisotropy for one-photon excitation in the absence of rotational diffusion is given by
| (4) |
where β is the angle between the absorption and emission transition momeity. The factor of ⅖ originated with cos2 θphotoselection, where θ is the angle between the electrical polarization of the incident light and the absorption transition. For two-photon excitation, the anisotropy is given by32
| (5) |
The larger factor of 4/7 is due to cos4 θ photoselection. If the direction of the electronic transition is the same for one and two-photon excitation, the value of r02 is expected to be 1.43 larger than r01.
Results
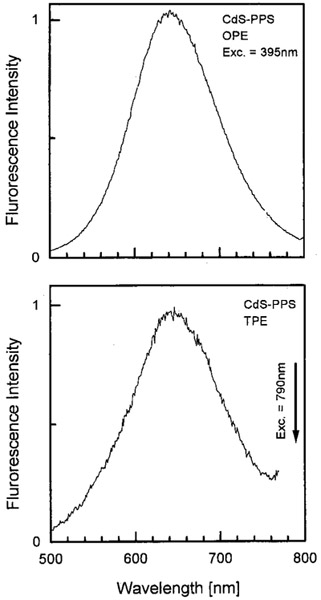
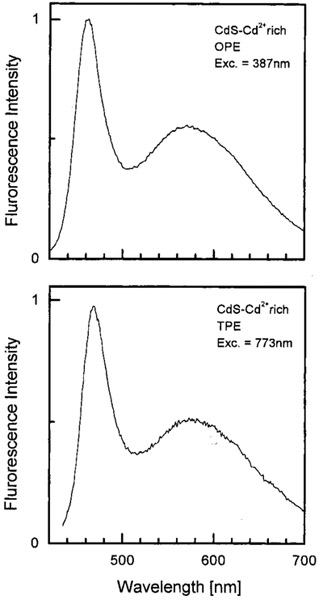
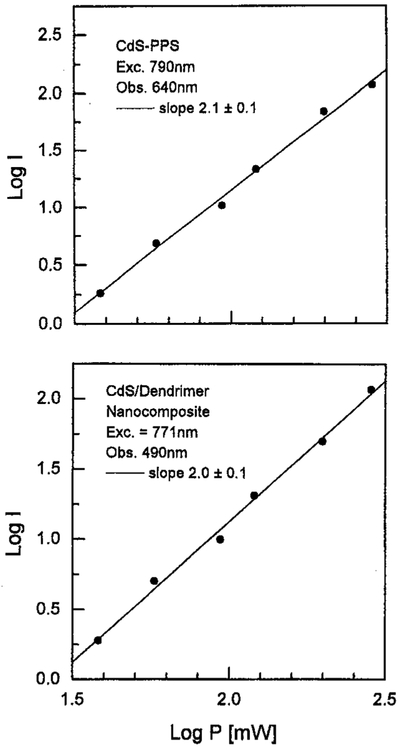
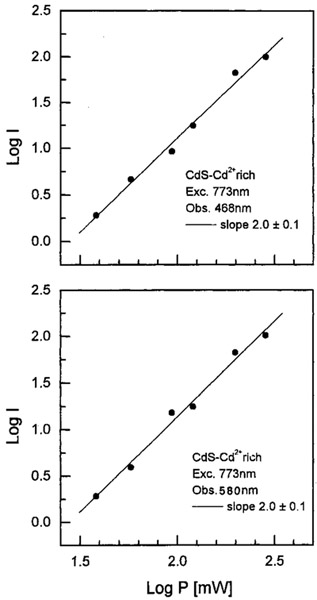
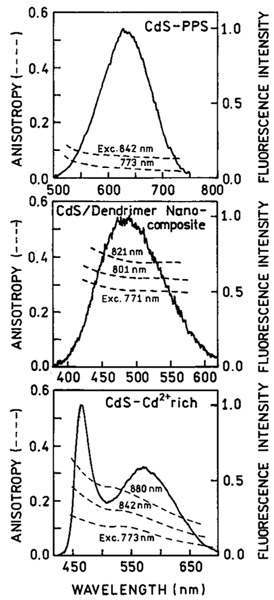
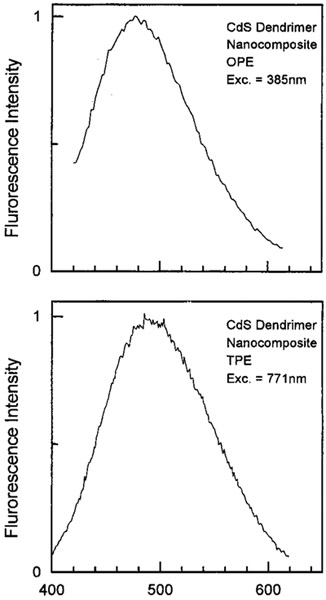
We examined the emission spectra of CdS–PPS, CdS–dendrimer, and CdS–Cd2+ rich nanoparticles for excitation in the UV (385–395 nm) and red (771–790 nm), shown in Figures 1-3, respectively. In all cases, the emission spectra were essentially identical for UV and long wavelength excitation. For long wavelength excitation, the emission intensity was dependent on the square of the incident power (Figures 4-5). The CdS–Cd2+ rich particles display two emission bands (Figure 3), and these differ in sensitivity to bound DNA.14-16 The long and short wavelength emission bands are thought to be due to less organized (surface) and more structured regions (interior) of the NPs, respectively.37 Despite the different origin and environmental sensitivity of the 490 and 640 nm emissions of the CdS–Cd2+ rich NPs, the emission intensity of both bonds was dependent on the square of the incident intensity at 773 nm (Figure 5). These results suggests that emission occurs from the same lowest electronic state independent of the mode of excitation.
Figure 1.
Emission spectra of CdS–PPS nanoparticles with one- (top) and two-photon (bottom) excitation.
Figure 3.
Emission spectra of CdS–Cd2+ rich nanoparticles with one- (top) and two-photon excitation. These nanoparticles show two emission maxima at about 465 nm and 580 μm.
Figure 4.
Dependence of two-photon induced emission intensity on excitation power for CdS–PPS nanoparticles (top) and CdS/dendrimer nanocomposite (bottom).
Figure 5.
Dependence of two-photon induced emission of CdS–Cd2+ rich nanoparticles on the excitation power. The emission was observed at 468 (top) and 580 nm (bottom).
We examined the emission anisotropy of the NPs with two-photon excitation (Figure 6). The CdS–PPS NPs display low anisotropy, as observed previously with one-photon excitation.20 The TEM of these particles show they are roughly spherical (not shown). Rather high emission anisotropies were observed for the CdS-dendrimer and CdS–Cd2+ rich NPs. These anisotropies are larger than those observed with one-photon excitation.20-21 Representative anisotropy values for one and two-photon excitation are given in Table 1. The values with 2PE are approximately 1.4-fold larger as predicted by eqs 4 and 5, suggesting the same relative orientation of the absorption and emission transition moments for both modes of excitation.
Figure 6.
Two-photon induced emission anisotropies observed for CdS–PPS (top), CdS/dendrimer composite (middle), and CdS–Cd2+ rich (bottom) nanoparticles, 80% proprolene glycol at −60 °C.
TABLE 1:
Anisotropies (r0) for CdS Nanoparticles with One- and Two-Photon Excitation
| CdS–Cd2+ rich |
||||
|---|---|---|---|---|
| excitation (mode) |
CdS–PPS obs. 650 nm |
CdS/dendrimer obs. 480 nm |
obs. 465 nm |
obs. 80 nm |
| 386 nm (1PE) | 0.015 | 0.210 | 0.080 | 0.030 |
| 773 nm (2PE) | 0.035 | 0.310 | 0.150 | 0.060 |
| 400 nm (1PE) | 0.015 | 0.250 | 0.070 | 0.035 |
| 800 nm (2PE) | 0.050 | 0.380 | 0.210 | 0.075 |
| 416 nm (1PE) | 0.020 | 0.280 | 0.055 | 0.035 |
| 832 nm (2PE) | 0.075 | 0.405 | 0.260 | 0.110 |
| 445 nm (1PE) | 0.030 | 0.065 | ||
| 890 nm (2PE) | 0.095 | 0.170 | ||
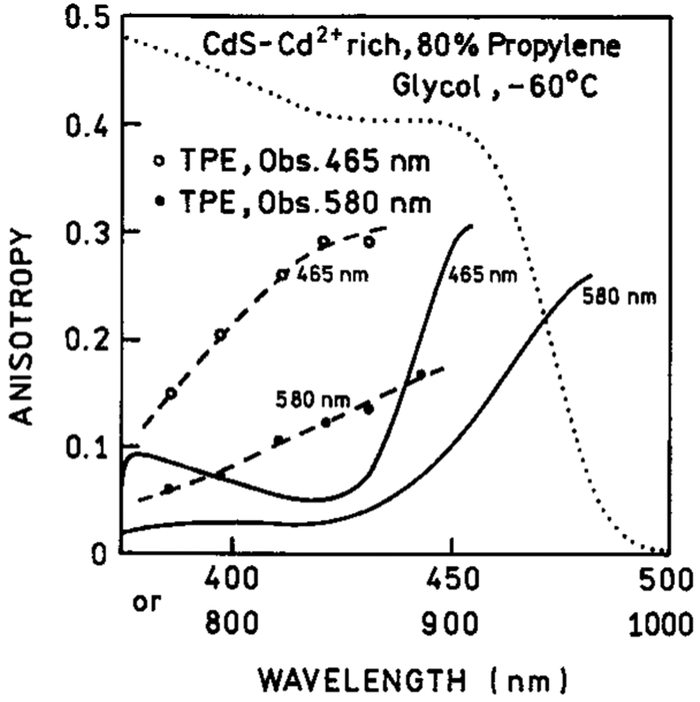
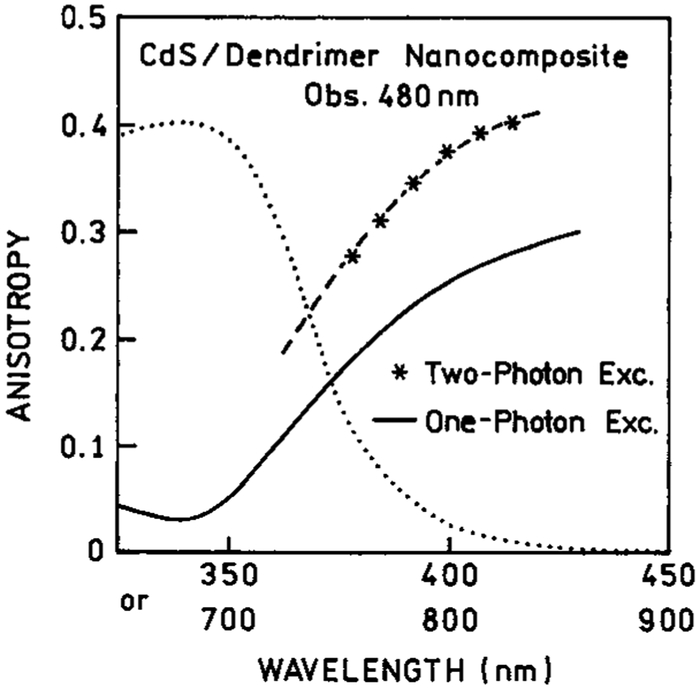
Excitation anisotropy spectra with 2PE for the three types of CdS NPs are shown in Figures 7-9. Also shown are the values with 1PE. For the CdS–PPS NPs, it is difficult to compare the 1PE and 2PE data because of the low anisotropy values. For the CdS–dendrimer NPs, the values of r02 are about 1.3-fold larger than those of r01, and the wavelength-dependent values show a similar trend. In the CdS–Cd2+ rich NPs, the anisotropy values are distinct from the 1PE values. This result suggest there are two absorption transitions in the range from 360 to 480 nm (720 to 960 nm) and that the relative absorption by each transition is different for one- and two-photon excitation.
Figure 7.
Excitation anisotropies observed with two-photon induced emission of CdS–PPS nanoparticles (–*–). The solid line is the one-photon excitation anisotropy. The dotted line is an one-photon absorption spectrum.
Figure 9.
Excitation anisotropies observed with two-photon induced emission of CdS–Cd2+ rich nanoparticles at two observation wavelengths −465 nm (- - ○ - -) and 580 nm (- - - ● - -). The solid lines are one-photon anisotropy spectra registered at 465 and 580 nm. The dotted line is an absorption spectrum.
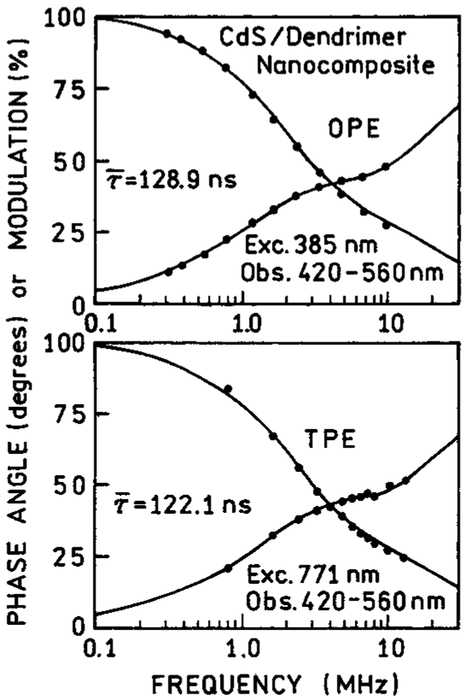
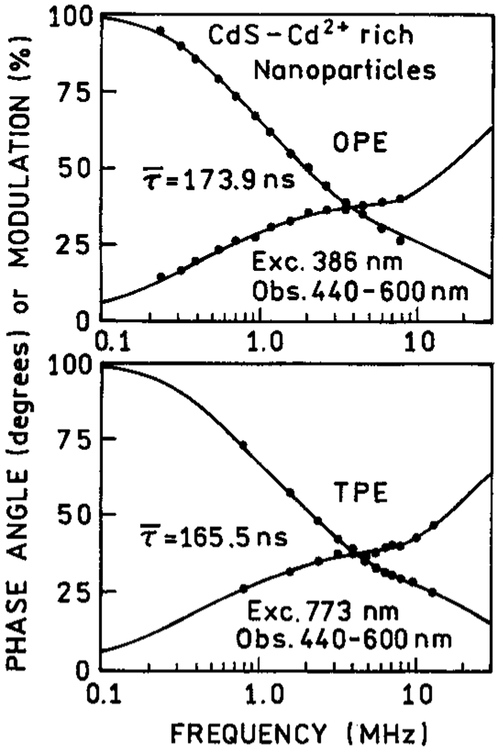
We examined the frequency-domain intensity decays of the CdS–dendrimer and CdS–Cd2+ richNPs (Figures 10 and 11). We were unable to measure the intensity decay for CdS–PPS because of the weak signal. For the dendrimer and Cd2+ rich NPs, we observed essentially identical decays for 1PE and 2PE (Table 2). This result for the Cd2+-rich NPs, which display more than one absorption and emission transition, confirm that relaxation between the states is rapid relative to the intensity decay times.
Figure 10.
Frequency-domain intensity decays of CdS/dendrimer nanocomposite with one-photon (top) and two-photon (bottom) excitation.
Figure 11.
Frequency-domain intensity decays of CdS–Cd2+ rich nanoparticles with one-photon (top) and two-photon (bottom) excitation.
TABLE 2:
Multiexnonential Intensity Decays for CdS Nanonarticles
| nanoparticle/excitation | (ns)a | α1 | τ1 (ns) | α2 | τ2 (ns) | α3 | τ3 (ns) | χR2 |
|---|---|---|---|---|---|---|---|---|
| CdS/dendrimer exc. 771 nm (1PE) | 128.9 | 0.757 | 9.2 | 0.230 | 85.5 | 0.013 | 431.1 | 1.8 |
| exc. 771 nm (2PE) | 122.1 | 0.785 | 10.0 | 0.201 | 94.8 | 0.014 | 382.9 | 1.4 |
| CdS/Cd2+ rich exc. 386 nm (1PE) | 173.9 | 0.837 | 8.8 | 0.123 | 83.9 | 0.040 | 334.2 | 1.2 |
| exc. 773 nm (2PE) | 165.5 | 0.839 | 8.8 | 0.122 | 81.1 | 0.039 | 324.1 | 2.5 |
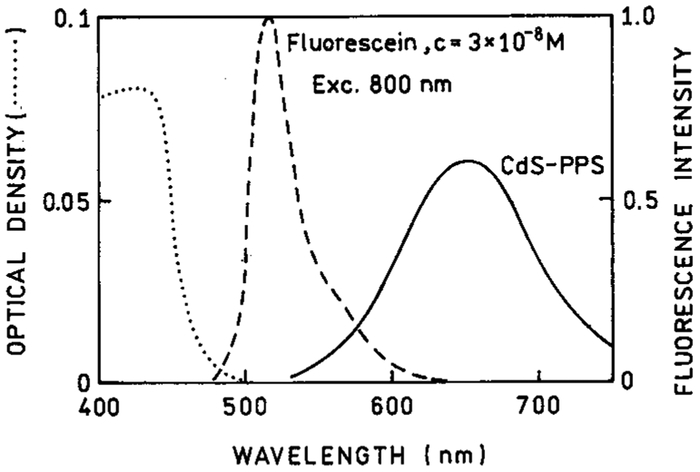
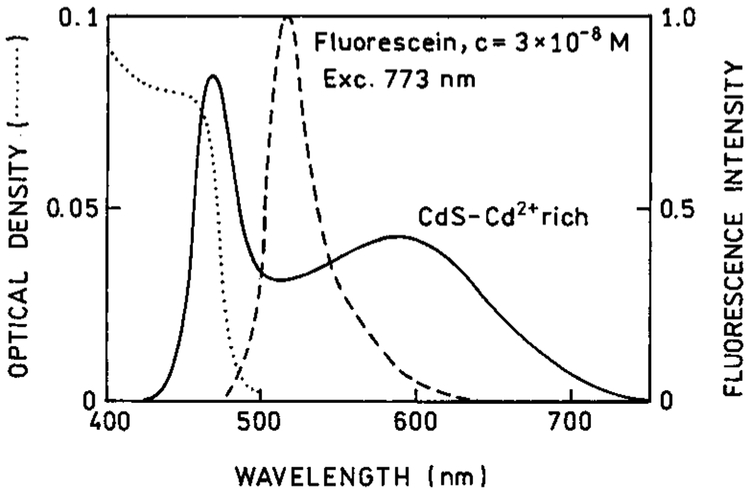
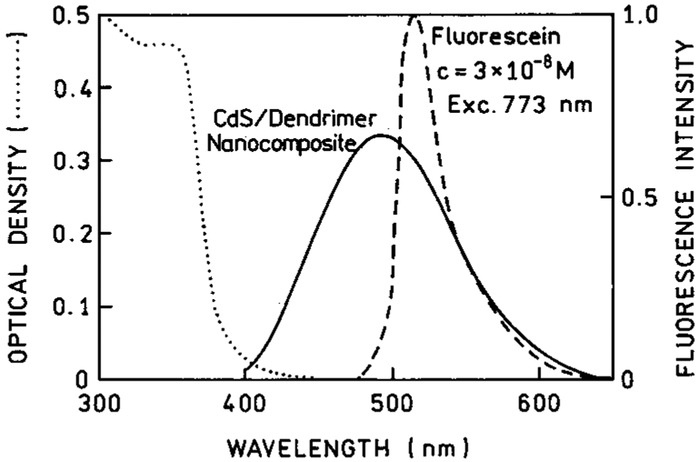
It is of interest to know the cross section of the NPs for two-photon excitation. Because of their somewhat heterogeneous size distribution it is difficult to assign a NP concentration. Hence, we compared the two-photon induced emission intensity of the NPs with that observed for a 30 nM solution of fluorescein at pH 11 (Figures 12-14). In this wavelength range, fluorescein displays a two-photon cross section near 30 GM.38 We estimate the NP concentrations are near 1 μM. The apparent quantum yield of the NPs are in the range of 1–3% of the quantum yield of fluorescein. This comparison indicates the NPs display large two-photon cross sections near 100 GM.
Figure 12.
Comparison of two-photon induced emissions of CdS–PPS nanoparticles with 30 nM fluorescein at pH 11 (- - -). The dotted line (•••) is the optical density of CdS–PPS nanoparticles used in this experiment.
Figure 14.
Comparison of the emissions observed with two-photon excitation. The solid line represents a CdS–Cd2+ rich nanoparticles solution with optical density shown as a dotted line. The dashed line is a two-photon induced fluorescence of 30 nM fluorescein in pH 11 buffer.
Discussion
Our result for two-photon excitation of CdS nanoparticles suggests they will be useful as probes in multiphoton imaging. Perhaps the most surprising result is the observation of polarized emission from two of the NPs. Because the NPs are expected to be roughly spherical, there is no defined direction for the transition moments, and the anisotropy is expected to be zero.
There are relatively few reports of polarized emission from nanostructures. Polarized emission has been reported for porous silicon,39-42 for CdSe nanoparticles,43-45 and for ZnCdSe/ZnSe quantum wires.46-47
Figure 2.
Emission spectra of CdS/dendrimer nanocomposite with one- (top) and two-photon (bottom) excitation.
Figure 8.
Excitation anisotropies observed with two-photon induced emission of CdS/dendrimer nanocomposite (–*–). The solid line is the one-photon excitation anisotropy. The dotted line represents a one-photon absorption spectrum.
Figure 13.
Comparison of the emissions observed with two-photon excitation. The solid line is the CdS/dendrimer nanocomposite with optical density indicated as a dotted line, and the dashed line is 30 nM fluorescein at pH 11.
Acknowledgment.
This work was supported by the NIH, National Center for Research Resources (RR-08119) (J.R.L.), and the National Science Foundation (CJM).
References and Notes
- (1).Ramsden JJ; Gratzel M Photoluminescence of small cadmium sulphide particles. J Chem. Soc., Faraday Trans 1984, 80, 919–933. [Google Scholar]
- (2).Weller H; Koch U; Gutierrez M; Henglein A Photochemistry of colloidal metal sulfides. 7. Absorption and fluorescence of extremely small ZnS particles. Ber. Bunsen-Ges. Phys. Chem 1984, 88, 649–656. [Google Scholar]
- (3).Weller H Colloidal semiconductor Q-particles: Chemistry in the transition region between solid state and molecules. Angew. Chem., Int. Ed. Engl 1993, 32, 41–53. [Google Scholar]
- (4).Empedocles S; Bawendi M Spectroscopy of Single CdSe Nanocrystalites. Acc. Chem. Res 1999, 32, 389–396. [Google Scholar]
- (5).Alivisatos AP Perspectives of the Physical Chemistry of Semiconductor Nanocrystals. J. Phys. Chem 1996, 100, 13226–13239. [Google Scholar]
- (6).Nirmal M; Brus L Luminescence Photophysics in Semiconductor Nanocrystals. Acc. Chem. Res 1999, 32, 407–414. [Google Scholar]
- (7).Hines MA; Guyot-Siomnest P Synthesis and Characterization of Strongly Luminescent ZnS-Capped CdSe Nanocrystals. J. Phys. Chem 1996, 100, 468–471. [Google Scholar]
- (8).Correa-Duarte MA; Giersig M; Liz-Marzän L Stabilization of CdS semiconductor nanoparticles against photodegradation by a silica coating procedure. Chem. Phys. Lett 1998, 286, 497–501. [Google Scholar]
- (9).Bruchez M Jr.; Moronne M; Gin P; Weiss S; Alivisatos AP Semiconductor nanocrystals as fluorescent biological labels. Science 1998, 281, 2013–2016. [DOI] [PubMed] [Google Scholar]
- (10).Chan WCW; Nie S Quantum dot bioconjugates for ultrasensitive nonisotopic detection. Science 1998, 281, 2016–2018. [DOI] [PubMed] [Google Scholar]
- (11).Ko MC; Meyer GJ Photoluminescence of inorganic semiconductors for chemical sensor application In Optoelectronic Properties of Inorganic Compounds; Roundhill DM, Fackler JP Jr., Eds.; Plenum Press: New York, 1999. [Google Scholar]
- (12).Brauns EB; Murphy CJ Quantum dots as chemical sensors. Recent Res. Devel. Phys. Chem 1997, 1, 1–15. [Google Scholar]
- (13).Kubitschko S; Spinke J; Brückner T; Pohl S; Oranth N Sensitivity enhancement of optical immunosensors with nanoparticles. Anal. Biochem. 1997, 253, 112–122. [DOI] [PubMed] [Google Scholar]
- (14).Mahtab R; Rogers JP; Singleton CP; Murphy CJ Preferential Adsorption of a “Kinked” DNA to a Neutral Curved Surface: Comparisons to and Implications for Nonspecific DNA–Protein Interactions. J. Am. Chem. Soc 1996, 118, 7028–7032. [Google Scholar]
- (15).Mahtab R; Harden HH; Murphy CJ Temperature- and Salt-Dependent Binding of Long DNA to Protein-Sized Quantum Dots: Thermodynamics of “Inorganic Protein”–DNA Interactions. J. Am Chem. Soc 2000, 122, 14–17. [Google Scholar]
- (16).Mahtab R; Rogers JP; Murphy CJ Protein-Sized Quantum Dot Luminescence can Distinguish Between “Straight”, “Bent”, and “Kinked” Oligonucleotides. J. Am. Chem. Soc 1995, 117, 9099–9100. [Google Scholar]
- (17).Coffer JR; Bigham SR; Li X; Pinizzotto RF; Rho YG; Pirtle RM; Pirtle IR Dictation of the shape of mesoscale semiconductor nanoparticle assemblies by plasmid DNA. Appl. Phys. Lett 1996, 69, 3851–3853. [Google Scholar]
- (18).Alivisatos AP; Johnsson KP; Peng X; Wilson TE; Loweth CJ; Bruchez MP Jr.; Schultz PG Organization of “nanocrystal molecules” using DNA. Nature 1996, 382, 609–611. [DOI] [PubMed] [Google Scholar]
- (19).Pathak S; Choi S-K; Arnheim N; Thompson ME Hydroxylated Quantum Dots as Luminescent Probes for in Situ Hybridization. J. Am. Chem. Soc 2001, 123, 4103–4104. [DOI] [PubMed] [Google Scholar]
- (20).Lakowicz JR; Gryczynski I; Gryczynski Z; Murphy CJ Luminescence Spectral Properties of CdS Nanoparticles. J. Phys. Chem. B 1999, 103, 7613–7620. [DOI] [PMC free article] [PubMed] [Google Scholar]
- (21).Lakowicz JR; Gryczynski I; Gryczynski Z; Nowaczyk K; Murphy CJ Time-resolved spectral observations of cadmium-enriched cadmium sulfide nanoparticles and the effects of DNA oligomer binding. Anal. Biochem 2000, 280, 128–136. [DOI] [PMC free article] [PubMed] [Google Scholar]
- (22).Lakowicz JR, Ed.; Topics in Fluorescence Spectroscopy; Vol. 5: Nonlinear and Two-Photon-Induced Fluorescence; Kluwer Academic/Plenum Publishers: New York, 1997; pp 544. [Google Scholar]
- (23).Berland KM; So PC; Gratton E Two-photon fluorescence correlation spectroscopy: Method and application to the intracellular environment. Biophys. J 1995, 68, 694–701. [DOI] [PMC free article] [PubMed] [Google Scholar]
- (24).Guiot E; Enescu M; Arrio B; Johannin G; Roger G; Tosti S; Tfibel F; Mérola F; Brun A; Georges P; Fontaine-Aupart MP Molecular dynamics of biological probes by fluorescence correlation microscopy with two-photon excitation. J. Fluoresc 2000, 10(4), 413–419. [Google Scholar]
- (25).Diaspro A Introduction to two-photon microscopy. Microsc. Res. Technique 1999, 47, 163–164. [DOI] [PubMed] [Google Scholar]
- (26).So PC; Dong CY; Masters BR; Berland KM Two-photon excitation fluorescence microscopy. Annu. Rev. Biomed. Eng 2000, 02, 399–429. [DOI] [PubMed] [Google Scholar]
- (27).Kang KI; McGinnis BP; Sandalphon, Hu YZ; Koch SW; Peyghambarian N.Confinement induced valence band mixing in CdS quantum dots observed by two-photon spectroscopy. Phys. Rev. B 1992, 45(7), 3465–3468. [DOI] [PubMed] [Google Scholar]
- (28).Blanton SA; Dehestani A; Lin PC; Guyot-Sionnest P Photoluminescence of single semiconductor nanocrystallites by two-photon excitation microscopy. Chem. Phys. Lett 1994, 229, 317–322. [Google Scholar]
- (29).Gole JL; Dixon DA Evidence for oxide formation from the single and multiphoton excitation of a porous silicon surface or silicon “nanoparticles”. J. Appl. Phys 1998, 83(11), 5985–5991. [Google Scholar]
- (30).Glinka YD; Lin K-W; Chang H-C; Lin SH Multiphoton-excited luminescence from diamond nanoparticles. J. Phys. Chem. B 1999, 103, 4251–4262. [Google Scholar]
- (31).Kuroda T; Minami F; Inoue K; Baranov AV Resonant luminescence in semiconductor quantum dots under two-photon excitation. Phys. Sol. Stat. (B) 1998, 206, 463–467. [Google Scholar]
- (32).Lakowicz JR; Gryczynski I Multiphoton Excitation of Biochemical Fluorophores In Topics in Fluorescence Spectroscopy; Vol. 5: Nonlinear and Two-Photon-Induced Fluorescence; Lakowicz JR, Ed.; Kluwer Academic/Plenum Publishers: New York, 1997; pp 87–144. [Google Scholar]
- (33).Sookal K; Hanus LH; Ploehn HJ; Murphy CJ A blue-emitting CdS/dendrimer nanocomposite. Adv. Mater 1998, 10, 1083–1087. [Google Scholar]
- (34).Spanhel L; Haase M; Weller H; Henglein A Photochemistry of Colloidal Semiconductors. 20. Surface Modification and Stability of Strong Luminescing CdS Particles. J. Am. Chem. Soc 1987, 109, 5649–5655. [Google Scholar]
- (35).Lakowicz JR; Gryczynski I. Frequency-domain fluorescence spectroscopy In Topics in Fluorescence Spectroscopy, Vol. 1: Topics in Fluorescence Spectroscopy; Lakowicz JR, Ed.; Plenum Press; : New York, 1991; pp 293–355. [Google Scholar]
- (36).Lakowicz JR; Cherek H; Kusba J; Gryczynski I; Johnson MI Review of fluorescence anisotropy decay analysis by frequency-domain fluorescence spectroscopy. J. Fluoresc 1993, 3, 103–116. [DOI] [PubMed] [Google Scholar]
- (37).Landes CF; Braun M; El-Sayed MA On the Nanoparticle to Molecular Size Transition: Fluorescence Quenching Studies. J. Phys. Chem. B 2001, 10, 10554–10558. [Google Scholar]
- (38).Xu C; Webb WW Multiphoton Excitation of Molecular Fluorophores and Nonlinear Laser Microscopy In Topics in Fluorescence Spectroscopy; Vol. 5: Nonlinear and Two-Photon-Induced Fluorescence; Lakowicz JR, Ed.; Plenum Press: New York, 1997; pp 471–540. [Google Scholar]
- (39).Andrianov AV; Kovalev DI; Zinov′ev NN; Yaroshetskii ID Anomalous photoluminescence polarization of porous sillicon. Pis’ma Zh. Eksp. Teor. Fiz 1993, 58(6), 417–420. [Google Scholar]
- (40).Koch F; Kovalev D; Averboukh B; Polisski G; Ben-Chorin M Polarization phenomena in the optical properties of porous silicon. J. Lumin 1996, 70, 320–332. [Google Scholar]
- (41).Kovalev D; Ben-Chorin M; Diener J; Averboukh B; Polisski G; Koch F Symmetry of the electronic states of nanocrystals: An experimental study. Phys. Rev. Lett 1997, 79(1): 119–122. [Google Scholar]
- (42).Allan G; Delerue C; Niquet YM Luminescence polarization of silicon nanocrytals. Phys. Rev. B 2001, 63, 205301–205308. [Google Scholar]
- (43).Diener J; Shen YR; Kovalev DI; Polisski G; Koch F Two-photon-excited photoluminescence from porous silicon. Phys. Rev. B 1998, 58(19), 12629–12632. [Google Scholar]
- (44).Chamarro M; Gourdon C; Lavallard P; Ekimov AI Enhancement of exciton exchange interaction by quantum confinement in CdSe nanocrystals. Jpn. J. Appl. Phys 1994, 34 (34–1) 12–14. [DOI] [PubMed] [Google Scholar]
- (45).Bawendi MG; Carroll PJ; Wilson WL; Brus LE Luminescence properties of CdSe quantum crystallites: Resonance between interior and surface localized states. J. Chem. Phys 1991, 96(2), 946–954. [Google Scholar]
- (46).Ho J; Li L-S; Yang W; Manna L; Wang L-W; Alivisatos AP Linearly polarized emission from colloidal semiconductor quantum rods. Science 2001, 15, 2060–2063. [DOI] [PubMed] [Google Scholar]
- (47).Lomasov NV; Travnikov VV; Kognovitskii SO; Gurevich SA; Nesterov SI; Skopina VI; Rabe M; Henneberger F Polarization spectra of excitonic luminescence of bare ZnCdSe/ZnSe quantum wires. Phys. Sol. Stat 1998, 40(8), 1413–1416. [Google Scholar]


