

Abstract
Introduction
Non-medical use and abuse of prescription opioids is a growing problem in both the civilian and military communities, with minimal technologies for detecting hydrocodone use. This study explored the proteomic changes that occur in the oral fluid and blood plasma following controlled hydrocodone administration in 20 subjects.
Methods
The global proteomic profile was determined for samples taken at four time points per subject: pre-exposure and 4, 6, or 168 hours post-exposure. The oral fluid samples analyzed herein provided greater differentiation between baseline and response time points than was observed with blood plasma, at least partially due to significant person-to-person relative variability in the plasma proteome.
Results
A total of 399 proteins were identified from oral fluid samples, and the abundance of 118 of those proteins was determined to be significantly different upon metabolism of hydrocodone (4 and 6 hour time points) as compared to baseline levels in the oral fluid (pre-dose and 168 hours).
Conclusions
We present an assessment of the oral fluid and plasma proteome following hydrocodone administration, which demonstrates the potential of oral fluid as a noninvasive sample that may reveal features of hydrocodone in opioid use, and with additional study, may be useful for other opioids and in settings of misuse.
Electronic supplementary material
The online version of this article (10.1007/s13181-019-00731-0) contains supplementary material, which is available to authorized users.
Keywords: Oral fluid, Hydrocodone, Proteomics, Opioid, Plasma
Introduction
Opioids, such as morphine, oxycodone, and hydrocodone, are the most common prescription analgesics available for medical use. Hydrocodone is the most frequently prescribed medication in the USA, and is often prescribed as Norco or Vicodin. Opioid misuse is a widespread national epidemic and is the most common cause of unintentional death in the USA, above car accidents, falls, and firearm-related deaths [1]. In 2010, the annual health care expenditures for treating opioid overdoses in acute hospital settings was $2.3 billion, which does not include addiction therapy or other comorbid diseases related to opioid misuse, such as depression, chronic pain, and nonemergency care visits [2]. This cost is twice the annual extramural budget of the National Institutes on Drug Abuse. The White House initiated a large effort to reduce opioid abuse and the consequent deaths, of which there were over 24,000 in 2014 [3, 4].
There is an incomplete understanding of the physiologic correlates of opioid abuse. It is difficult to detect opioid abuse, and prediction of an individual’s propensity to opioid abuse using biomarkers is currently not possible [5]. While reference and comprehensive testing does exist, current common testing methods used to screen for drug abuse can only detect the drug for 1–2 days following use, weakening enforcement of drug detection programs [6]. Most approaches for preventing abuse have involved reducing prescriptions or reducing access of the medications to patients, leaving the patients with limited analgesic alternatives [7]. The ability to detect a physiological marker up to a week after drug misuse would strengthen these programs, especially if a simple, noninvasive method of detection was developed. Blood plasma is often utilized in biomarker discovery efforts through the investigation of the plasma/serum proteome, where mass spectrometry (MS) approaches have been routinely applied to numerous clinical stress responses and diseases [8–10]. However, plasma collection is modestly invasive and requires extensive sensitivity and strong technical reproducibility to overcome the large dynamic range of protein abundance to capture low-abundance biomarkers. The use of oral or salivary fluid is both less invasive and less technically difficult than blood collection, and is susceptible to very rapid turnover in response to physiological processes [11–15]. Measuring biomarkers is unlike the detection of opioid drugs, which is static and drugs can be present for days. Measurement of drug metabolism is also not a reflection of the physiological response to opioids or use in predicting other effects such as addiction or dependency.
The study presented here investigated whether detectable and potential changes in the oral and plasma proteome of a longer duration could be identified following hydrocodone exposure versus direct detection of hydrocodone. A better or complementary marker of exposure could provide a better understanding of the physiological effects of opioids and ultimately be used to detect drug misuse or abuse. We used an advanced proteomic analysis approach to detect changes in the oral fluid and plasma proteome of subjects following hydrocodone use. This study was developed to provide an initial assessment for the design of more extensive future studies by the field.
Materials and Methods
Subject Enrollment and Sample Collection
Thirty-nine total subjects (37 administered drug) were voluntarily enrolled in the overall study. Participation in this study was strictly voluntary. The study was approved by the Wilford Hall Medical Center and Pacific Northwest National Laboratory Institutional Review Boards. Patients were recruited via flyers, and poster set-ups at two places, one in the Wilford Hall Medical Center hospital main corridor and the other at the entrance to the Lackland Air Force Base Main Exchange (BX). Recruiting materials and language used to recruit subjects were approved by the Wilford Hall Medical Center Institutional Review Board. Individuals interested in participating in the study were given the nurse coordinator’s contact information to schedule an appointment for study eligibility screening. All screening and informed consent of subjects and drug administration were conducted at the Clinical Research Division (currently part of 59 Medical Wing) Lackland Air Force Base. To avoid side effect issues from hydrocodone hypersensitivity, only subjects with history of prescribed hydrocodone use at least one time in the past were allowed to participate. Subjects ranged in age from 18 to 55 years old, were non-pregnant, and had no history of drug abuse. Potential participants were pre-screened by the study nurse coordinator to determine their eligibility for participation in the study. Subject volunteers were asked about their medical and non-medical use of drugs within the past 3 months. Inclusion criteria were that the participants had not taken hydrocodone or prescription medications 30 days before study initiation and were currently not using tobacco. The main relevant prescription medications considered for exclusion were other narcotic painkillers, antihistamines, antipsychotics, antianxiety agents, monoamine oxidase inhibitor antidepressants, tricyclic antidepressants, or other CNS depressants. Those subjects who volunteered to participate in the study were asked to refrain from any opioid use for a minimum of 30 days prior to study initiation. All study subjects gave written consent to participate. Ten milligrams of pure hydrocodone in pill formulation was administered orally under controlled conditions to each subject in a study room located at the Clinical Research Division. Each individual that participated in the study received a physical examination by a health care provider including vitals, and review of medical records to ensure the patient was in good health and did not meet any of the exclusion criteria described above. The participants were informed of potential risks and side-effects of hydrocodone. A urine sample was collected prior to administration of the drug and tested by liquid chromatography-tandem mass spectrometry for the presence of hydrocodone and its metabolites. Presence of the drug or its metabolites in the urine would exclude individuals from participating in the study.
Thirty-nine subjects were enrolled in the study, and 37 of these were administered the drug; the other two were excluded upon finding that they did not meet at least one inclusion criterion. Out of the 37 remaining subjects, the data were analyzed for 20 of the subjects with age ranging from 19 to 52 years old, 8 male, 12 female (TableS1). The rest of the subjects had to be excluded due to collection continuity and common time points of collection for comparisons. Some subjects did not have samples from all time points due to difficulty in collection during the study or failure to return for follow-up collections at later time points. Data from subjects that did not cover all sampling time points were evaluated initially with an analysis procedure that generated less proteome depth, in order to identify if early and late time points showed significant changes in protein observation and abundance. Because changes were modest, we employed a different analysis strategy for samples from subjects that had samples from a more complete set of time points. Genomic testing, such as CYP 2D6, was not obtained and resulted before enrollment. The study was approved by the Wilford Hall Medical Center and Pacific Northwest National Laboratory’s Institutional Review Boards. All study subjects gave written consent to participate. Volunteer subjects fasted overnight, were fed a defined meal prior to the time of drug exposure, and were provided with a pre-defined diet with set calories during the first day of sampling. Subjects were maintained in similar environmental conditions and were monitored throughout the first day for up to at least 12 h post-dose. The subjects were required to return to the study facility at 24, 48, 72, and 96 hours post-dose and at 7 days post-dose.
A pre-dose blood and oral fluid sample was taken prior to drug administration and, following administration, blood and oral fluid was collected at 0.5, 1.0, 1.5, 2, 3, 4, 5, 6, 7, 8, 9, 10, 11, 12, 24, 48, 72, 96, and 168 hours post-dose. Day 1 blood samples were drawn from an intravenous (IV) catheter, then collected by venipuncture for the remaining time points. Blood was collected in lithium heparin tubes. Plasma was separated from the blood sample and stored at ≤ 20 °C prior to analysis. Oral fluid was collected using the Quantisal™ Oral Fluid Collection Device. The collection device pad was placed under the tongue until the volume indicator turned blue indicating collection of 1 mL (± 10%) of oral fluid, typically 2–5 min of duration. The pad was then placed in the transport tube containing 3 mL of a proprietary stabilizing buffer and stored at 2–8 °C. The oral fluid plus buffer was filtered using a disposable filter and transferred to a separate clean polypropylene tube for analysis or further storage. De-identified plasma and oral fluid samples were aliquoted and shipped overnight on dry ice to the Pacific Northwest National Laboratory for proteomic analysis.
Hydrocodone Metabolite Analysis: Plasma and Oral Fluid
Plasma
A 500-μL aliquot of plasma was enzyme hydrolyzed, extracted, and analyzed for the presence of hydrocodone and its metabolites, hydromorphone, and norhydrocodone by LC/MS/MS using a previously described method [16]. Approximately 780 plasma samples were analyzed (subjects 1–39).
Oral Fluid
Following solid phase extraction of 1 mL oral fluid in stabilizing buffer, a validated quantitative LC-MS-MS method was used for analysis of the drug and its metabolites. Based upon plasma metabolite analysis and a pilot proteomic analysis with a subset of 12 subjects, the selected time points of interest were 0, 4, 6, and 168 hours.
Depletion and Trypsin Digestion of Plasma Samples
For each plasma sample, 150 μL was depleted using an IgY14 LC10 (depletion of albumin, IgG, α1-antitrypsin, IgA, IgM, transferrin, haptoglobin, α2-macroglobulin, fibrinogen, C3, α1-acid glycoprotein, apolipoprotein A-I and A-II, and apolipoprotein B) and Supermix LC5 depletion columns (Sigma-Aldrich) to remove high to moderately abundant proteins. The columns were set up in tandem on an Agilent 1200 HPLC (Santa Clara, CA). Prior to depletion of samples, the columns were conditioned by running a buffer blank, followed by a depletion of human plasma obtained from Sigma-Aldrich. To prepare the plasma samples for depletion, 300 μL of 1× dilution buffer (Sigma-Aldrich) was added to a 0.45-μm spin filter (Corning) and centrifuged at 9200×g for 30 seconds. The buffer was discarded and another 300 μL of 1× dilution buffer and 150 μL of sample were added to the prewashed filter. The filter was spun at 9200×g for 1 minute. The filtered sample was transferred to an ALS vial (Microsolv) containing an additional 470 μL of 1× dilution buffer.
The flow-through fractions were utilized for further analysis, where the fractions from the Supermix column were collected in 30-mL centrifuge tubes (VWR). The fractions were stored at 4 °C until they were concentrated using a 3-K MWCO filter (Millipore) the following day. The MWCO filter was prewashed with 12 mL of 50 mM NH4HCO3 (Sigma-Aldrich). The MWCO filter was spun at 4000×g, 4 °C for 20 minutes. The buffer was discarded. The collected fraction was added to the prewashed filter and spun at 4000×g, 4 °C for 45 min. This concentration step was repeated until all of the collected fraction sample had been concentrated. The concentrated fraction sample was then washed with 12 mL of 50 mM NH4HCO3 and spun at 4000×g, 4 °C for 1 h and 45 minutes. The concentrated fraction sample was removed from the MWCO filter and placed in a 1.5-mL microcentrifuge tube (Fisher). A portion of the sample was removed for total protein quantification by the BCA method using a commercial kit (Thermo Pierce).
The Supermix flowthrough fraction samples had solid urea (Sigma-Aldrich) added to a final concentration of 8 M. The samples were incubated for 1 hour at 37 °C. The samples were then incubated with 10 mM DTT for 1 h at 37 °C. The samples were incubated at 40 mM iodoacetamide (Sigma-Aldrich) for 1 hour at 37 °C, in the dark. The samples were diluted 10-fold with 50 mM NH4HCO3. CaCl2 (Sigma-Aldrich) was added to a final concentration of 1 mM. Trypsin (Promega) was added at a ratio of 1 μg of trypsin per 50 μg of protein. The samples were incubated at 37 °C for 3 hours and then frozen in liquid nitrogen. The samples were stored at − 80 °C until solid phase extraction (SPE) cleanup was performed.
Samples were cleaned-up using a vacuum-manifold (Supelco). The SPE cartridges used had a 50-mg bed and 1 mL volume (Discovery, Supelco). The cartridges were prewashed with 3 mL of methanol (Sigma-Aldrich) followed by 2 mL of 0.1% TFA (Sigma-Aldrich). The sample was added to the cartridge and the flow rate was adjusted to be approximately 1 mL per minute. The cartridge was washed with 4 mL of 95:5 H2O/ACN, 0.1% TFA (Sigma-Aldrich). The column was allowed to go to dryness. The sample was eluted with 1 mL of 80:20 ACN/H2O, 0.1% TFA (Sigma-Aldrich). The sample was concentrated in the speed-vac (Thermo). A BCA assay was performed to quantify the peptides.
iTRAQ Labeling of Plasma Samples
Following tryptic digestion, an equal amount of peptides for each time point sample (ranging in mass from 14 up to 75 mg per patient) were aliquoted into microcentrifuge tubes and dried in a speed-vac (Thermo Scientific). Each sample was reconstituted with 30.0 μL of 1 M triethylammonium bicarbonate (TEAB, Sigma). The samples were sonicated and vortexed to resuspend the peptides. The pH was checked (1 μL of sample) to ensure it was at 8.5. The 4Plex Multiplex iTRAQ™ Reagent vials (114, 115, 116, and 117, Sciex) were brought to room temperature and 70 μL of ethanol was added to each vial. The vials were vortexed for 1 min, and then centrifuged briefly to ensure the entire amount of reagent was at the bottom of the tube. The entire contents of one tube were transferred to a microcentrifuge tube containing sample peptides for one time point. The microcentrifuge tube was vortexed to mix the reagent and peptide, briefly centrifuged and then incubated at room temperature for 1 hour. The reaction was hydrolyzed by addition of 300 μL of water (3 times the volume of the sample), vortexed and then briefly centrifuged again. The samples were then incubated again at room temperature for 30 min. The contents of each of the labeled samples were pooled into a new 2-mL microcentrifuge tube and concentrated in a speed-vac to a volume of approximately 100 μL. The pooled sample was then desalted using the same C18 SPE cleanup method as outlined in the proteolytic digestion method. Following SPE cleanup and concentration to 50 μL, each iTRAQ pooled sample was fractionated into 12 LC-MS/MS analysis using high pH reverse phase C18 HPLC. This method is orthogonal to the mass spectrometry coupled liquid chromatography used for LC-MS/MS [17].
For the high pH reverse phase HPLC fractionation, the samples were diluted to 435 μL with 10 mM ammonium formate, pH 10 (Mobile Phase A or MPA), centrifuged at 10,000×g to ensure no particulates have formed, and then the supernatant (if there is a pellet) was transferred to an automatic liquid sampler (ALS) vial. Exactly 400 μL of the sample was injected onto an XBridge (Waters) BEH C18 Column (130 Å, 5 μm, 4.6 mm × 250 mm) and 96 fractions were collected over 105 min (excluding the first 15 min of a 120-min run) into a deep-well 96-well plate (Agilent, Santa Clara, CA) using the following method with a flow rate of 0.5 mL/min: 1) 0–10 minutes, 0 to 5% MPB; 2) 10-70 minutes, 5 to 35% MPB; 3) 70–85 minutes, 35 to 70% MPB; 4) 85–95 minutes, 70% MPB; 5) 95–105 minutes, 70 to 0% MPB; and 6) 105–120 minutes, 0% MPB. The collected fractions were concentrated to dryness in a speedvac overnight. Exactly100 μL of 5% acetonitrile in water was added to each well of the plate. The fractions were combined such that all 8 wells from each “column” of the 96-well plate were combined in one vial, resulting in 12 fractions total (i.e., combined by column) analyzed by LC-MS/MS. The combined fractions were concentrated to dryness overnight again in a speedvac. Each fraction was diluted to 35 μL with 5% acetonitrile in water, vortexed briefly to mix, then stored at − 20 °C until needed for LC-MS analysis.
LC-MS/MS Analysis of Plasma Samples
All iTRAQ-labeled fractions were loaded into hand packed 65 cm × 75 mm i.d. reversed-phase capillary column using 3 mm C18 particles (Phenomenex, Torrance, CA). The HPLC system consisted of a custom configuration of two nano and one cap (Agilent Pumps, Santa Clara, CA), two position valves, multi-position valves (Valco Instruments Co., Houston, TX), and a PAL autosampler (Leap Technologies, Carrboro, NC). The system was operated at a constant pressure of 10,000 psi over 3 hours with an exponential gradient starting with 100% of mobile phase A (0.1% (v/v) formic acid in water) to 60% (v/v) of mobile phase B (0.1% (v/v) formic acid in acetonitrile). MS analysis was performed on a Thermo Scientific LTQ-Orbitrap Velos mass spectrometer (Thermo Scientific, San Jose, CA) coupled with an electrospray ionization interface using homemade 150 mm o.d. × 20 mm i.d. chemically etched electrospray emitters [18]. Full MS spectra were recorded at a resolution of 100 K (m/z 400) over the range of m/z 400–2000 with an automated gain control (AGC) value of 1 × 10⁶. MS/MS was performed in the data-dependent mode with an AGC target value of 3 × 10⁴. The most abundant 10 parent ions were selected for MS/MS using high-energy collision dissociation with a normalized collision energy setting of 45. Precursor ion activation was performed with an isolation width of 2 Da, a minimal intensity of 500 counts, and an activation time of 10 ms.
Sample Processing and Trypsin Digestion of Oral Fluid Samples
The oral fluid samples (25% oral fluid, 75% stabilizing buffer of Quantisal from ImmunoAnalysis) were thawed and placed on ice. Centrifugal filters (0.5 mL, 3 K MWCO, Millipore) were prepared for use by centrifuging 0.5 mL of 100 mM NH4HCO3 (Buffer) through each filter at 14,000×g for 30 minutes at 4 °C. The filtrate was discarded, and the samples were transferred into the filters, noting volume. If the sample was less than 0.5 mL, Buffer was added to obtain a final volume of 0.5 mL. Samples were centrifuged again as described before. The original sample tubes were retained and 450 μL of Buffer was added to each tube as a wash. Following centrifugation of the samples, the filtrate was discarded again, and the wash for each sample was transferred to the filter. The wash was centrifuged in the same manner as described previously. Three additional sample washes were performed on the material in the filter, using 450 μL of Buffer with the exception being the final wash, which was centrifuged for 40 minutes to ensure dead volume of the filter was achieved. Following the final centrifugation step, the filter was transferred to an appropriately labeled clean tube and placed upside down in the tube. The tubes were all then centrifuged at 1000×g for 2 minutes at 4 °C to remove the samples from the filter. The filter portion of the concentrator was rinsed by addition of 30 μL of Buffer, vortexing briefly, then using a pipet tip to wash the membrane surfaces 3 times each. The filter portion was then placed upside down in the tube again and centrifuged as before, combining rinse with sample. The entire amount of sample was then transferred to a sterile 1.5-mL microcentrifuge tube. The samples were subsequently concentrated to below 100 μL. The volume of each sample was measured and a BCA protein assay was performed. The sample mass was calculated from these two measurements. All of the samples were then normalized to the maximum volume of the batch.
Urea and DTT were added to each sample to a final concentration of 8 M and 5 mM, respectively. The samples were incubated for 1 hour at 37 °C. Alkylation, dilution, tryptic digestion, and SPE cleanup were performed in the same manner as described in the plasma protein digestion portion above.
LC-MS/MS Analysis of Oral Fluid
The LC system was custom built using two Agilent 1200 nanoflow pumps and one Agilent 1200 cap pump (Agilent Technologies, Santa Clara, CA), various Valco valves (Valco Instruments Co., Houston, TX), and a PAL autosampler (Leap Technologies, Carrboro, NC). Full automation was made possible by custom software that allows for parallel event coordination and therefore near 100% MS duty cycle through use of two trapping and analytical columns. Reversed-phase columns were prepared in-house by slurry packing 3-μm Jupiter C18 (Phenomenex, Torrence, CA) into 40 cm × 360 μm o.d. × 75 μm i.d fused silica (Polymicro Technologies Inc., Phoenix, AZ) using a 1-cm sol-gel frit for media retention [19]. Trapping columns were prepared similarly by slurry packing 5-μm Jupiter C18 into a 4-cm length of 150 μm i.d. fused silica and fritted on both ends. Mobile phases consisted of 0.1% formic acid in water (A) and 0.1% formic acid acetonitrile (B) operated at 300 nL/min with a gradient profile as follows (min:%B), 0:5, 2:8, 20:12, 75:35, 97:60, and 100:85. Sample injections (5 μL) were trapped and washed on the trapping columns at 3 μL/min for 20 minutes prior to alignment with analytical columns. Data acquisition lagged the gradient start and end times by 15 minutes to account for column dead volume that allowed for the tightest overlap possible in two-column operation. Two-column operation also allowed for columns to be “washed” (shortened gradients) and re-generated off-line without any cost to duty cycle.
MS analysis was performed using a Velos Orbitrap mass spectrometer (Thermo Scientific, San Jose, CA) outfitted with a custom electrospray ionization (ESI) interface. Electrospray emitters were custom made by chemically etching 150 μm o.d. × 20 μm i.d. fused silica [19]. The heated capillary temperature and spray voltage were 325 °C and 2.2 kV, respectively. Data was acquired for 100 minutes after a 15-minute delay from when the gradient started. Orbitrap spectra (AGC 1 × 10⁶) were collected from 400 to 2000 m/z at a resolution of 60 k followed by data-dependent ion trap MS/MS (collision energy 35%, AGC 1 × 10⁴) of the 10 most abundant ions. A dynamic exclusion time of 60 seconds was used to discriminate against previously analyzed ions using a − 0.55- to 1.55-Da mass window.
Data Analysis
Peptide sequences were statistically associated with LC-MS/MS spectra generated from the oral samples using the MSGFPlus algorithm [20] and genomic database of human proteins (downloaded from Uniprot 2015-04-22). For oral fluid samples, from these associated peptide sequences, their measured masses, and normalized elution times, an empirical peptide database was generated for use as a library to match high-resolution parent ion spectra (i.e., AMT tag approach [21–23]) generated by the Orbitrap Velos instrument. This data analysis step was used to obtain label-free abundance measurements for use in relative quantification comparisons. The area under each peptide peak, constructed from ion intensities (ion current) measured across instrument scans, was used to represent the arbitrary abundances of peptides (i.e., accurate mass and time tag (AMT tag) approach [21–23]). The dataset of peptides along with their label-free abundances were filtered to achieve a false discovery rate of ≤ 5% according to established protocols [24]. Identified peptides from the oral fluid, their masses, and elution time measurements were placed into a lookup table that was used for subsequent matching. Data from oral fluid samples were peak matched against the developed look-up table using the AMT tag approach. Following filtering to 1% FDR, peptide identifications were rolled up to the protein level using Rrollup [25], and protein intensity values were log2 transformed. Protein intensity values were then mean-centered in Excel and the resulting data matrices were used for further analysis. Data were subjected to a linear mixed-effects model with the grouping variable of sample for a comparison of protein level changes through time. Data were grouped into “baseline” (pre-dose and 168 hours post-treatment) and “response” (4 and 6 hours post-treatment) time points, and a p value of < 0.05 significance cut-off was used to identify proteins that were significantly differently expressed at baseline and response time points.
For plasma samples, iTRAQ-labeled peptides were identified based on tandem MS/MS spectra. MS/MS spectra were converted to peak lists using DeconMSn (version 2.2.2.2, [26]) using default parameters [27]. The database searching was described above. The reporter ion intensities for each peptide were summed for all identified spectra for each channel in each biological condition. Relative abundances at the peptide level were rolled-up to the protein level using the software tool DAnTE [25] with the abundances being log2 transformed and normalized by the central tendency approach. Protein level abundance data were averaged by time point as was done for oral fluid; in this case, pre-dose and 168 hours data were averaged and 4 and 6 hours data were averaged to generate a baseline and response intensity value, respectively, for each protein. The fold change between response and baseline was calculated to compare to oral fluid statistical testing results and protein abundance trends.
Each oral fluid sample (i.e., subject/time point combination) was analyzed by a single LC-MS/MS run. Each subject’s plasma samples were fractionated into 12 separate samples, each of which was analyzed by a single LC-MS/MS run.
Results
Metabolism Results
Plasma
Hydrocodone, hydromorphone, and norhydrocodone concentration in blood plasma at multiple time points were measured by LC-MS/MS (Fig. 1). Based on the 37 subjects administered the drug, peak concentrations of hydrocodone were found at 0.5–5 h post-dose and were in the range of 11.9–42.5 ng/mL. Hydromorphone peak concentrations were found at 1–10 hours post-dose and ranged from 1.1 to 6.2 ng/mL. For norhydrocodone, peak concentrations were found at 0.5–9 hours post-dose and ranged from 2.1 to 11.7 ng/mL. Hydrocodone, hydromorphone, and norhydrocodone concentrations from 11 subjects are represented in the graph in Fig. 1. Post-administration, hydrocodone in plasma was first detected, and peaked at the same time or before hydromorphone and norhydrocodone in all subjects. Hydrocodone was last detected for up to the same time or longer than hydromorphone and norhydrocodone with the exception of one subject where hydromorphone was detected for longer than hydrocodone.
Fig. 1.
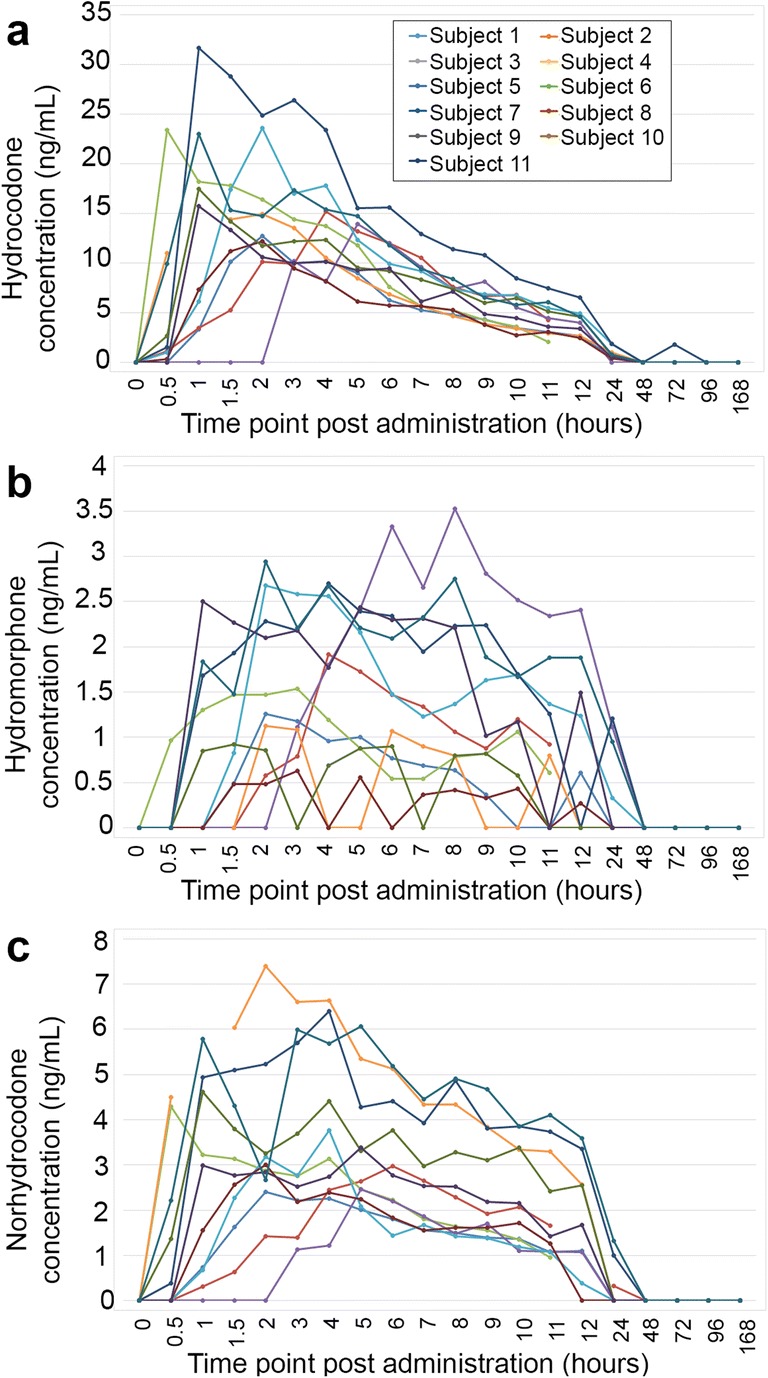
Metabolite profile of hydrocodone, hydromorphone, and norhydrocodone in plasma. Concentration of a hydrocodone, b hydromorphone, and c norhydrocodone in blood plasma was measured by LC-MS/MS at multiple time points (zero to 168 hours post-administration) in 11 subjects. Data are plotted in line graph form through time. Legend in a applies to all a through c graphs.
Oral Fluid
Concentrations of hydrocodone and its metabolites were all below detection limits in 0 and 168 hours samples, and thus were used as baseline measurements. The 4 and 6 hours post-dose metabolite concentrations ranged from 0.63 to 130 ng/mL hydrocodone, 0 to ≤ 1 ng/mL hydromorphone, and 0 to 7.8 ng/mL norhydrocodone.
Our previous experience with global proteomics of human body fluids has shown that if possible the best control is the human subject themselves. This is especially true when subject number is limited such as in a pilot study. For this reason, we utilized the pre-exposure as the primary control measurements for these subjects. This was further important due to the use of an iTRAQ relative quantification strategy that uses only four distinct samples. A fully parallel control group would have allowed only two time points to be selected.
This proteomics study is composed of samples from 20 subjects from the larger study of 39 individuals analyzed for diversity of metabolism of hydrocodone (Table S1). Time point choice for our analysis was guided by information gained from the metabolic profiles of hydrocodone clearance (Fig. 1), with the goal of capturing time points prior to drug administration, during the typical peak of drug metabolism for multiple subjects, and following drug metabolism. Therefore, the following time points were chosen for further analysis: pre-treatment, two time points during most subjects’ response period (4 and 6 hours), and then a very late time point of 168 hours as a “return-to-normal” time point. The proteome of subject-matched plasma and oral fluid samples were analyzed with the goal of identifying proteins that were altered in abundance during the metabolism of hydrocodone.
Comparison of Proteins Identified in Oral Fluid and Depleted Blood Plasma Samples
Oral fluid samples from 20 subjects were analyzed, while blood plasma samples for 17/20 subjects were analyzed; three blood plasma samples were removed from the study because they did not contain enough peptide material to label with iTRAQ reagents. Following filtering of oral fluid protein data as described in the “Materials and Methods” section, a subset of oral fluid datasets were removed due to limited protein identifications. These datasets are noted in Table S1 by a dashed mark (−). As a result, although samples from four time points were analyzed by LC-MS/MS for each subject, there are cases in which only two or three time points contained data rich enough to interpret. Oral fluid samples yielded identifications for 399 proteins in total (Table S2), and 1235 proteins were identified in blood plasma samples (Table S3 ). The number of proteins observed in common between oral fluid and blood plasma was 210 (Table S4 , Tables 1 and 2 shaded cells). Blood plasma proteome data tended to cluster by subject and not by time point (Fig. S1), and thus yielded few statistically relevant differences between baseline and response conditions. Although 210 proteins were observed in common between both the oral fluid and blood plasma samples, the limited statistically relevant changes upon hydrocodone exposure in the blood plasma proteome made it difficult to identify conserved trends in the different biological fluids.
Table 1.
Proteins Increased in Oral Fluid in Response to Hydrocodone Administration.
| Uniprot ID | Description | Fold change | LME p value |
|---|---|---|---|
| ABCC8_HUMAN | ATP-binding cassette sub-family C member 8 | 2.27 | 2.17E-04 |
| AMY1_HUMAN | Alpha-amylase 1 | 1.58 | 5.06E-08 |
| AMY2B_HUMAN | Alpha-amylase 2B | 1.58 | 1.30E-07 |
| AMYP_HUMAN | Pancreatic alpha-amylase | 1.45 | 9.28E-07 |
| BMR1A_HUMAN | Bone morphogenetic protein receptor type-1A | 1.86 | 2.28E-03 |
| CAH6_HUMAN | Carbonic anhydrase 6 | 1.27 | 1.55E-03 |
| CCPG1_HUMAN | Cell cycle progression protein 1 | 0.62 | 2.12E-02 |
| CLUS_HUMAN | Clusterin | 0.85 | 2.26E-02 |
| CYTC_HUMAN | Cystatin C | 1.18 | 2.45E-02 |
| CYTD_HUMAN | Cystatin D | 1.61 | 1.05E-02 |
| CYTN_HUMAN | Cystatin SN | 0.88 | 4.90E-02 |
| CYTS_HUMAN | Cystatin S | 0.88 | 3.58E-02 |
| CYTT_HUMAN | Cystatin SA | 0.63 | 4.73E-02 |
| DUS9_HUMAN | Dual specificity protein phosphatase 9 | 1.64 | 8.32E-05 |
| EST1A_HUMAN | Telomerase-binding protein EST1A | 1.46 | 3.60E-02 |
| F168A_HUMAN | Protein FAM168A | 1.17 | 3.57E-02 |
| FERM2_HUMAN | Fermitin family homolog 2 | 0.44 | 1.51E-02 |
| FIBA_HUMAN | Fibrinogen alpha chain | 0.79 | 3.68E-02 |
| FIBG_HUMAN | Fibrinogen gamma chain | 0.93 | 1.60E-02 |
| GLYG2_HUMAN | Glycogenin-2 | 0.62 | 8.33E-04 |
| GSLG1_HUMAN | Golgi apparatus protein 1 | 0.54 | 4.44E-02 |
| ID2B_HUMAN | Putative DNA-binding protein inhibitor ID-2B | 1.34 | 9.49E-03 |
| IL6RB_HUMAN | Interleukin-6 receptor subunit beta | 0.82 | 4.37E-02 |
| ISG20_HUMAN | Interferon-stimulated gene 20 kDa protein | 1.14 | 2.40E-02 |
| IV4F8_HUMAN | Putative V-set and immunoglobulin domain-containing-like protein IGHV4OR15-8 | 1.20 | 1.16E-02 |
| KV110_HUMAN | Ig kappa chain V-I region HK102 (Fragment) | 0.33 | 3.48E-02 |
| KV206_HUMAN | Ig kappa chain V-II region RPMI 6410 | 0.42 | 4.07E-02 |
| LG3BP_HUMAN | Galectin-3-binding protein | 0.63 | 1.54E-02 |
| LV211_HUMAN | Ig lambda chain V-II region NIG-84 | 0.45 | 4.40E-02 |
| MUC7_HUMAN | Mucin-7 | 1.71 | 2.27E-03 |
| NEK3_HUMAN | Serine/threonine-protein kinase Nek3 | 0.87 | 1.45E-02 |
| NUCB2_HUMAN | Nucleobindin-2 | 1.35 | 7.35E-03 |
| PERL_HUMAN | Lactoperoxidase | 1.18 | 5.47E-05 |
| PGBM_HUMAN | Basement membrane-specific heparan sulfate proteoglycan core protein | 0.60 | 3.42E-02 |
| PGRP1_HUMAN | Peptidoglycan recognition protein 1 | 0.91 | 1.62E-02 |
| PRB3_HUMAN | Basic salivary proline-rich protein 3 | 2.63 | 5.90E-03 |
| PRPC_HUMAN | Salivary acidic proline-rich phosphoprotein 1/2 | 2.25 | 3.63E-03 |
| PTCD2_HUMAN | Pentatricopeptide repeat-containing protein 2, mitochondrial | 1.50 | 3.30E-05 |
| RNAS4_HUMAN | Ribonuclease 4 | 1.27 | 1.32E-03 |
| RNT2_HUMAN | Ribonuclease T2 | 0.64 | 6.33E-04 |
| S15A2_HUMAN | Solute carrier family 15 member 2 | 0.94 | 2.08E-02 |
| SAP_HUMAN | Prosaposin | 0.46 | 3.39E-02 |
| SPRL1_HUMAN | SPARC-like protein 1 | 0.58 | 1.75E-02 |
| SYCP1_HUMAN | Synaptonemal complex protein 1 | 1.18 | 3.63E-02 |
| TCO1_HUMAN | Transcobalamin-1 | 0.73 | 4.05E-03 |
| TIMP1_HUMAN | Metalloproteinase inhibitor 1 | 0.87 | 1.09E-04 |
| TSP1_HUMAN | Thrombospondin-1 | 0.73 | 7.59E-05 |
| ZA2G_HUMAN | Zinc-alpha-2-glycoprotein | 0.38 | 5.17E-03 |
| ZFHX4_HUMAN | Zinc finger homeobox protein 4 | 0.59 | 2.64E-02 |
| ZG16B_HUMAN | Zymogen granule protein 16 homolog B | 1.91 | 8.90E-08 |
Shaded cells indicate proteins observed in both plasma and oral fluid
Table 2.
Proteins decreased in oral fluid in response to hydrocodone administration.
| Uniprot ID | Description | Fold change | LME p value |
|---|---|---|---|
| 1433Z_HUMAN | 14-3-3 protein zeta/delta | − 1.58 | 2.85E-04 |
| A2ML1_HUMAN | Alpha-2-macroglobulin-like protein 1 | − 1.29 | 2.50E-08 |
| AATC_HUMAN | Aspartate aminotransferase, cytoplasmic | − 0.72 | 4.63E-03 |
| ACBP_HUMAN | Acyl-CoA-binding protein | − 1.14 | 8.38E-07 |
| ACTN4_HUMAN | Alpha-actinin-4 | − 1.04 | 1.09E-02 |
| AL3A1_HUMAN | Aldehyde dehydrogenase, dimeric NADP-preferring | − 0.88 | 8.90E-03 |
| AN30A_HUMAN | Ankyrin repeat domain-containing protein 30A | − 0.86 | 4.97E-02 |
| ANXA2_HUMAN | Annexin A2 | − 1.19 | 6.23E-04 |
| AXA2L_HUMAN | Putative annexin A2-like protein | − 1.33 | 6.96E-04 |
| CALL3_HUMAN | Calmodulin-like protein 3 | −1.62 | 9.85E-05 |
| CALR_HUMAN | Calreticulin | − 0.71 | 1.22E-02 |
| CAN1_HUMAN | Calpain-1 catalytic subunit | − 1.16 | 8.35E-03 |
| CAPG_HUMAN | Macrophage-capping protein | − 1.02 | 7.06E-04 |
| CD59_HUMAN | CD59 glycoprotein | − 0.67 | 3.63E-03 |
| CRNN_HUMAN | Cornulin | − 1.97 | 1.20E-05 |
| CYTA_HUMAN | Cystatin A | − 1.34 | 3.75E-04 |
| CYTB_HUMAN | Cystatin B | − 1.15 | 3.87E-06 |
| DSG3_HUMAN | Desmoglein-3 | − 1.21 | 2.34E-06 |
| ENDD1_HUMAN | Endonuclease domain-containing 1 protein | − 1.59 | 7.18E-05 |
| ENDOU_HUMAN | Poly(U)-specific endoribonuclease | − 0.61 | 2.58E-02 |
| GELS_HUMAN | Gelsolin | − 0.74 | 1.13E-02 |
| GGCT_HUMAN | Gamma-glutamylcyclotransferase | − 0.60 | 1.41E-02 |
| GRP78_HUMAN | 78 kDa glucose-regulated protein | − 0.80 | 5.05E-04 |
| HEBP2_HUMAN | Heme-binding protein 2 | − 0.62 | 3.15E-02 |
| HS71L_HUMAN | Heat shock 70 kDa protein 1-like | − 0.96 | 2.19E-03 |
| HSP7C_HUMAN | Heat shock cognate 71 kDa protein | − 0.58 | 8.72E-03 |
| IL1RA_HUMAN | Interleukin-1 receptor antagonist protein | − 1.56 | 5.75E-09 |
| ISK5_HUMAN | Serine protease inhibitor Kazal-type 5 | − 0.62 | 1.05E-02 |
| K1C13_HUMAN | Keratin, type I cytoskeletal 13 | − 1.79 | 1.49E-02 |
| K1C14_HUMAN | Keratin, type I cytoskeletal 14 | − 0.90 | 3.22E-02 |
| K2C6A_HUMAN | Keratin, type II cytoskeletal 6A | − 0.93 | 2.94E-02 |
| K2C6B_HUMAN | Keratin, type II cytoskeletal 6B | − 1.27 | 1.24E-02 |
| KLK13_HUMAN | Kallikrein-13 | − 0.94 | 1.94E-06 |
| LDHA_HUMAN | L-lactate dehydrogenase A chain | − 0.84 | 1.92E-02 |
| LMNA_HUMAN | Prelamin-A/C | − 1.50 | 2.58E-09 |
| LY6D_HUMAN | Lymphocyte antigen 6D | − 1.24 | 1.66E-02 |
| LYPD3_HUMAN | Ly6/PLAUR domain-containing protein 3 | − 1.53 | 5.49E-07 |
| NDK8_HUMAN | Putative nucleoside diphosphate kinase | − 1.13 | 2.46E-04 |
| PDIA1_HUMAN | Protein disulfide-isomerase | − 0.97 | 8.70E-03 |
| PDIA3_HUMAN | Protein disulfide-isomerase A3 | − 0.97 | 4.83E-03 |
| PDIA6_HUMAN | Protein disulfide-isomerase A6 | − 0.87 | 1.53E-02 |
| PRDX1_HUMAN | Peroxiredoxin-1 | − 1.37 | 3.51E-05 |
| RAD17_HUMAN | Cell cycle checkpoint protein RAD17 | − 1.43 | 1.50E-03 |
| S10A2_HUMAN | Protein S100-A2 | − 1.95 | 1.53E-09 |
| S10A7_HUMAN | Protein S100-A7 | − 0.72 | 4.94E-02 |
| S10A8_HUMAN | Protein S100-A8 | − 1.46 | 1.99E-04 |
| S10A9_HUMAN | Protein S100-A9 | − 1.41 | 1.51E-04 |
| S10AB_HUMAN | Protein S100-A11 | − 1.22 | 7.44E-03 |
| S1A7A_HUMAN | Protein S100-A7A | − 0.59 | 1.01E-02 |
| SCN2B_HUMAN | Sodium channel subunit beta-2 | −1.15 | 6.54E-03 |
| SH3L3_HUMAN | SH3 domain-binding glutamic acid-rich-like protein 3 | − 0.82 | 7.57E-03 |
| SODC_HUMAN | Superoxide dismutase [Cu-Zn] | − 0.96 | 6.22E-03 |
| SPR1A_HUMAN | Cornifin-A | − 1.69 | 3.72E-05 |
| SPR1B_HUMAN | Cornifin-B | − 1.58 | 6.83E-05 |
| SPR2A_HUMAN | Small proline-rich protein 2A | − 1.40 | 2.29E-05 |
| SPR2D_HUMAN | Small proline-rich protein 2D | − 1.31 | 2.08E-03 |
| SPR2F_HUMAN | Small proline-rich protein 2F | − 1.39 | 6.85E-05 |
| SPR2G_HUMAN | Small proline-rich protein 2G | − 1.81 | 2.32E-05 |
| SPRR3_HUMAN | Small proline-rich protein 3 | − 1.91 | 1.70E-06 |
| TACD2_HUMAN | Tumor-associated calcium signal transducer 2 | − 1.32 | 4.63E-05 |
| TAGL2_HUMAN | Transgelin-2 | − 1.13 | 2.08E-04 |
| TGM3_HUMAN | Protein-glutamine gamma-glutamyltransferase E | − 1.08 | 2.10E-05 |
| THIO_HUMAN | Thioredoxin | − 0.77 | 3.49E-02 |
| TM11D_HUMAN | Transmembrane protease serine 11D | − 1.39 | 8.42E-07 |
| TM11E_HUMAN | Transmembrane protease serine 11E | − 1.11 | 5.92E-06 |
| TPIS_HUMAN | Triosephosphate isomerase | − 0.72 | 3.95E-02 |
| TPM4_HUMAN | Tropomyosin alpha-4 chain | − 1.17 | 9.50E-06 |
| VINC_HUMAN | Vinculin | − 0.75 | 4.84E-03 |
Shaded cells indicate proteins observed in both plasma and oral fluid
Identification of Proteins Differentially Expressed in Oral Fluid at Baseline and during Response to Hydrocodone Administration
Using the iTRAQ labeling strategy, we were constrained to sets of four samples for each analysis. As described above, we based our time point choices on the kinetic study of the hydrocodone metabolism (Fig. 1). Initial evaluation of the proteomics oral fluid results showed clustering patterns by subject and time. In other words, the strongest correlations were by subject and between the “baseline” (pre-dose and 168 hours post-dose) and the “response” (4 and 6 hours post-dose) time points. No confident markers were identified between the 0- and 168-hours post-dose time points. Hence, we tested whether the oral fluid proteome was altered following hydrocodone administration by comparing the protein profiles of the “baseline” (pre-dose and 168 hours post-dose) samples to the “response” (4 and 6 hours post-dose) samples by a linear mixed-effects model with the grouping variable of sample to account for the non-independence in the data. In contrast to the plasma results, a large portion of the proteins, 118, were determined to be significantly altered by hydrocodone administration, as determined by a significance cut-off of p < 0.05. Among the 118 proteins significantly altered in expression, 68 were found to decrease in response to hydrocodone administration and 50 proteins increased in response to the drug (Fig. 2, Tables 1 and 2).
Fig. 2.

A subset of proteins in oral fluid exhibit altered abundance following hydrocodone administration. The 118 proteins identified in oral fluid to be significantly altered in relative abundance following hydrocodone administration are represented here. These proteins were determined by a linear mixed effects model, comparing the baseline (pre-dose and 168 h time points) to the response (4 and 6 hours time points) proteome. Values represented are protein abundance measures that have been Z-score scaled across all time points to highlight increased or decreased abundance in baseline vs. response. Red shading indicates higher protein abundance and green indicates lower protein abundance levels.
Proteins that increased in abundance following hydrocodone exposure included the following: Cystatin C and D; Alpha amylase 1, 2B, and pancreatic alpha amylase; the IL-6 receptor subunit beta; and the peptidoglycan recognition protein 1. Conversely, Cystatin A and B; Protein S100-A2, S100-A8, S100-A9, and S100-A11; multiple small proline-rich proteins; the lymphocyte antigen 6D; and the IL-1 receptor agonist protein were among those that decreased in response to administration of hydrocodone.
Discussion
Determination of opioid misuse or abuse is often challenging for clinical providers and researchers. We investigated the utility of oral fluid and plasma protein composition and expression levels as possible indicators of hydrocodone use. While a long-term goal of this research is to use protein markers in biological fluids to identify drug misuse or predict the likelihood of an individual to abuse through physiological response, this initial proof-of-principle study used proteomics to determine whether protein changes occur in oral fluid and/or blood plasma following opioid exposure. We have demonstrated that hydrocodone administration alters the proteome of oral fluid by assessing the global protein profile of samples taken at pre-dose and 168 hours post-dose versus those samples taken during the response to drug times of 4 and 6 hours post-dose. While the biological utilities of these protein expression changes are unknown, this study has shown the potential for use of the oral fluid in detecting drug use in a noninvasive manner and identified possible protein markers of hydrocodone use. Results mirror a similar longitudinal study in which saliva analysis was able to identify a clear signature of methadone treatment [12].
The oral fluid proteins identified in this study are consistent with those observed in previous studies of the oral fluid and/or salivary proteome. Thirteen of the 15 most abundant salivary proteins reported by Grassl et al. were identified [29]. In addition, it has been reported that amylase and albumin make up approximately 60% of the salivary proteome [30], and these proteins were also abundant in the current study (in the top 5% of proteins identified when ranked by relative abundance, as measured by average peak intensity). When compared to the major salivary protein families that make up > 95% of the salivary protein content, our study observed proteins that fall into 7 of 9 categories: acidic proline-rich proteins (PRPC), basic proline-rich proteins (PRB3), amylases (AMY1, AMY2, and AMYP), high-MW mucins (MUC5A and MUC5B), low-MW mucins (MUC7), agglutinin (DMBT1), and cystatins (CYTA, CYTB, CYTC, CYTD, CYTS, and CYTSA). Additional small proline-rich proteins SPR2A, SPR2D, SPR2F, SPR2G, and SPRR3 were observed, but histatins and statherin, the remaining two categories, were not observed in our study. Overall, these results demonstrate that the total protein identifications from this study are consistent with previous analyses and abundant salivary proteins are well-represented.
Note that cystatins A and B have recently been shown to be elevated in schizophrenic and bipolar disorder patients [28], potentially showing interactions with oral fluid protein abundance and neurological processes. The role of the immune system and potential non-immune functions of these proteins, with respect to hydrocodone exposure, is intriguing.
Unlike oral fluid, the proteome of blood plasma analyzed at the time points in this study demonstrated limited statistically relevant subject-to-subject protein abundance changes in response to hydrocodone. Several factors may have influenced this outcome, including: (1) the role of plasma in homeostasis, resulting in limited protein level perturbation at the doses of hydrocodone exposure utilized in this study; (2) the inherent individual genetic variability was greater than the plasma protein level response to drug administration; (3) too large of variation in the subject demographics, i.e., age and body mass; [4] sample preparation of plasma samples, which included two methods to deplete the most abundant proteins found in plasma (methods used to enrich for less abundant proteins which are often obscured during LC-MS/MS analysis); (5) the occurrence of hemolysis in a subset of samples; (6) overall number of subjects included in the study may have been underpowered for the magnitude of response in the plasma; and (7) food intake during the course of the study, which though regulated, could have also confounded plasma protein differentiation across time. Further study of the plasma proteome with a greater number of individuals, additional control subjects, consideration of the impact of over-the-counter medication, a chronic use and a period of withdrawal, or samples from different time points in the response to drug administration may prove more revealing in the future and would help narrow the current hydrocodone oral fluid proteome towards a more specific signature.
In clinical practice, the results of this study can be useful. Currently, we can only detect drug parent or metabolites, often without clinical value. Our study presents the ability to measure human proteome changes in blood and oral fluid which, with additional study, can be used to correlate with analgesic efficacy, adverse effects, predictive of misuse, or altered metabolism. While blood proteome is more robust, the oral fluid is noninvasive and easy to obtain.
In summary, our results demonstrate overlap in the protein content of plasma and oral fluid. Approximately 50% of proteins observed in oral fluid were also found in plasma, and that is consistent with previous studies [29, 31]. However, the relative abundances of those proteins through time were not the same in the two biological fluids. The utility of oral fluid as a proxy for blood plasma is an ongoing area of investigation. Given the nature of the blood plasma proteomic results in this study (i.e., few relevant significant changes observed across multiple individuals), we have shown that oral fluid may not be an appropriate surrogate in this case. However, with additional studies and evaluation of oral fluid, it may provide a noninvasive sample type from which protein features of hydrocodone use may be identified.
Limitations
This study has several limitations. First, we studied healthy volunteers; patients with chronic opioid use, opioid abuse, or other medical issues may have a different proteomic response. However, to obtain these initial fundamental studies, we needed to evaluate a homogenous population. Also, we studied only hydrocodone, and other opioids may have different proteomic effects. Hydrocodone is, however, one of the most commonly prescribed opioids. Finally, our study is preliminary and exploratory. Future studies with larger samples and in diseased populations, using the data from our study, may provide possible detection patterns to unlock the additional effects of opioid, provide for a clinical marker, and develop a predictor of opioid abuse found in biofluids.
Conclusion
This assessment of the oral fluid and plasma proteome following hydrocodone administration demonstrates the potential of oral fluid as a non-invasive sample that may reveal features of hydrocodone in opioid use, and with additional study, may be useful for other opioids and in settings of misuse.
Electronic supplementary material
Principal Component Analysis of the Blood Plasma Proteome Following Hydrocodone Administration. Principal Component Analysis (PCA) was used to visualize the relatedness of protein observations from blood plasma samples. Blood plasma proteome data demonstrated greater similarity by individual than by time post hydrocodone exposure. This is demonstrated by clustering of individuals (represented by varying colors) and not by time point post-drug administration. PC1 (x-axis) is principal component 1 and PC2 (y-axis) is principal component 2; PC1 and PC2 are the two principal components that account for the most variability in the data, with PC1 being the greatest. Percentages shown are the percent of variability that each PC accounts for. (PNG 164 kb)
(PDF 38 kb)
(PDF 343 kb)
(PDF 1135 kb)
(PDF 53 kb)
Acknowledgements
Work was performed in the Environmental Molecular Sciences Laboratory, a US Department of Energy Office of Biological and Environmental Research national scientific user facility located at the Pacific Northwest National Laboratory in Richland, Washington. Pacific Northwest National Laboratory is operated by Battelle for the US Department of Energy under Contract No. DE-AC05-76RLO 1830. Many thanks to Robert Mueck for sample processing and metabolic profiling analysis. The opinions represented in this manuscript do not necessarily represent the views and opinions of the US Government, Department of Defense, or US Air Force.
Funding Information
Funding was provided by the DoD (Department of Defense) CDMRP (Congressionally Directed Medical Research Program) W81WXH-11-2-0126.
Compliance with Ethical Standards
The study was approved by the Wilford Hall Medical Center and Pacific Northwest National Laboratory Institutional Review Boards.
Conflict of Interest
None.
Footnotes
Publisher’s Note
Springer Nature remains neutral with regard to jurisdictional claims in published maps and institutional affiliations.
References
- 1.Dowell D, Haegerich TM, Chou R. CDC guideline for prescribing opioids for chronic pain—United States, 2016. JAMA. 2016;315(15):1624–1645. doi: 10.1001/jama.2016.1464. [DOI] [PMC free article] [PubMed] [Google Scholar]
- 2.Yokell MA, Delgado MK, Zaller ND, Wang NE, McGowan SK, Green TC. Presentation of prescription and nonprescription opioid overdoses to US emergency departments. JAMA Intern Med. 2014;174(12):2034–2037. doi: 10.1001/jamainternmed.2014.5413. [DOI] [PubMed] [Google Scholar]
- 3.Traynor K. White House expands opioid addiction response: Treat chronic pain like other chronic conditions, pharmacists say. Am J Health Syst Pharm. 2016;73(1):e1–e2. doi: 10.2146/news160001. [DOI] [PubMed] [Google Scholar]
- 4.FACT SHEET. President Obama proposes $1.1 billion in new funding to address the prescription opioid abuse and heroin use epidemic [press release] February. 2016;2:2016. doi: 10.3109/15360288.2016.1173760. [DOI] [PubMed] [Google Scholar]
- 5.Varney SM, Bebarta VS, Mannina LM, Ramos RG, Ganem VJ, Carey KR. Emergency medicine providers’ opioid prescribing practices stratified by gender, age, and years in practice. World J Emerg Med. 2016;7(2):106–110. doi: 10.5847/wjem.j.1920-8642.2016.02.004. [DOI] [PMC free article] [PubMed] [Google Scholar]
- 6.Agarin T, Trescot AM, Agarin A, Lesanics D, Decastro C. Reducing opioid analgesic deaths in America: what health providers can do. Pain Physician. 2015;18(3):E307–E322. [PubMed] [Google Scholar]
- 7.del Portal DA, Healy ME, Satz WA, McNamara RM. Impact of an opioid prescribing guideline in the acute care setting. J Emerg Med. 2016;50(1):21–27. doi: 10.1016/j.jemermed.2015.06.014. [DOI] [PubMed] [Google Scholar]
- 8.Geyer PE, Holdt LM, Teupser D, Mann M. Revisiting biomarker discovery by plasma proteomics. Mol Syst Biol. 2017;13(9):942. doi: 10.15252/msb.20156297. [DOI] [PMC free article] [PubMed] [Google Scholar]
- 9.Jacobs JM, Adkins JN, Qian WJ, Liu T, Shen Y, Camp DG, 2nd, et al. Utilizing human blood plasma for proteomic biomarker discovery. J Proteome Res. 2005;4(4):1073–1085. doi: 10.1021/pr0500657. [DOI] [PubMed] [Google Scholar]
- 10.Wu C, Duan J, Liu T, Smith RD, Qian WJ. Contributions of immunoaffinity chromatography to deep proteome profiling of human biofluids. J Chromatogr B Analyt Technol Biomed Life Sci. 2016;1021:57–68. doi: 10.1016/j.jchromb.2016.01.015. [DOI] [PMC free article] [PubMed] [Google Scholar]
- 11.Helmerhorst EJ, Oppenheim FG. Saliva: a dynamic proteome. J Dent Res. 2007;86(8):680–693. doi: 10.1177/154405910708600802. [DOI] [PubMed] [Google Scholar]
- 12.Dominy SS, Brown JN, Ryder MI, Gritsenko M, Jacobs JM, Smith RD. Proteomic analysis of saliva in HIV-positive heroin addicts reveals proteins correlated with cognition. PLoS One. 2014;9(4):e89366. doi: 10.1371/journal.pone.0089366. [DOI] [PMC free article] [PubMed] [Google Scholar]
- 13.Nicolardi S, Bogdanov B, Deelder AM, Palmblad M, van der Burgt YE. Developments in FTICR-MS and its potential for body fluid signatures. Int J Mol Sci. 2015;16(11):27133–27144. doi: 10.3390/ijms161126012. [DOI] [PMC free article] [PubMed] [Google Scholar]
- 14.Castagnola M, Scarano E, Passali GC, Messana I, Cabras T, Iavarone F, et al. Salivary biomarkers and proteomics: future diagnostic and clinical utilities. Acta Otorhinolaryngol Ital. 2017;37(2):94–101. doi: 10.14639/0392-100X-1598. [DOI] [PMC free article] [PubMed] [Google Scholar]
- 15.Flood JG, Khaliq T, Bishop KA, Griggs DA. The new Substance Abuse and Mental Health Services Administration Oral fluid cutoffs for cocaine and heroin-related analytes applied to an addiction medicine setting: important, unanticipated findings with LC-MS/MS. Clin Chem. 2016;62(5):773–780. doi: 10.1373/clinchem.2015.251066. [DOI] [PubMed] [Google Scholar]
- 16.Valtier S, Mueck RL, Bebarta VS. Quantitative method for analysis of hydrocodone, hydromorphone and norhydrocodone in human plasma by liquid chromatography-tandem mass spectrometry. J Chromatogr B Analyt Technol Biomed Life Sci. 2013;925:40–45. doi: 10.1016/j.jchromb.2013.02.030. [DOI] [PubMed] [Google Scholar]
- 17.Yang F, Shen Y, Camp DG, 2nd, Smith RD. High-pH reversed-phase chromatography with fraction concatenation for 2D proteomic analysis. Expert Rev Proteomics. 2012;9(2):129–134. doi: 10.1586/epr.12.15. [DOI] [PMC free article] [PubMed] [Google Scholar]
- 18.Kelly RT, Page JS, Luo Q, Moore RJ, Orton DJ, Tang K, Smith RD. Chemically etched open tubular and monolithic emitters for nanoelectrospray ionization mass spectrometry. Anal Chem. 2006;78(22):7796–7801. doi: 10.1021/ac061133r. [DOI] [PMC free article] [PubMed] [Google Scholar]
- 19.Maiolica A, Borsotti D, Rappsilber J. Self-made frits for nanoscale columns in proteomics. Proteomics. 2005;5(15):3847–3850. doi: 10.1002/pmic.200402010. [DOI] [PubMed] [Google Scholar]
- 20.Granholm V, Kim S, Navarro JC, Sjolund E, Smith RD, Kall L. Fast and accurate database searches with MS-GF+Percolator. J Proteome Res. 2014;13(2):890–897. doi: 10.1021/pr400937n. [DOI] [PMC free article] [PubMed] [Google Scholar]
- 21.Monroe ME, Tolic N, Jaitly N, Shaw JL, Adkins JN, Smith RD. VIPER: an advanced software package to support high-throughput LC-MS peptide identification. Bioinformatics. 2007;23(15):2021–2023. doi: 10.1093/bioinformatics/btm281. [DOI] [PubMed] [Google Scholar]
- 22.Tolmachev AV, Monroe ME, Purvine SO, Moore RJ, Jaitly N, Adkins JN, Anderson GA, Smith RD. Characterization of strategies for obtaining confident identifications in bottom-up proteomics measurements using hybrid FTMS instruments. Anal Chem. 2008;80(22):8514–8525. doi: 10.1021/ac801376g. [DOI] [PMC free article] [PubMed] [Google Scholar]
- 23.Yang F, Jaitly N, Jayachandran H, Luo Q, Monroe ME, Du X, et al. Applying a targeted label-free approach using LC-MS AMT tags to evaluate changes in protein phosphorylation following phosphatase inhibition. J Proteome Res. 2007;6(11):4489–4497. doi: 10.1021/pr070068e. [DOI] [PMC free article] [PubMed] [Google Scholar]
- 24.Stanley JR, Adkins JN, Slysz GW, Monroe ME, Purvine SO, Karpievitch YV, Anderson GA, Smith RD, Dabney AR. A statistical method for assessing peptide identification confidence in accurate mass and time tag proteomics. Anal Chem. 2011;83(16):6135–6140. doi: 10.1021/ac2009806. [DOI] [PMC free article] [PubMed] [Google Scholar]
- 25.Polpitiya AD, Qian WJ, Jaitly N, Petyuk VA, Adkins JN, Camp DG, 2nd, et al. DAnTE: a statistical tool for quantitative analysis of -omics data. Bioinformatics. 2008;24(13):1556–1558. doi: 10.1093/bioinformatics/btn217. [DOI] [PMC free article] [PubMed] [Google Scholar]
- 26.DeconMSn [Available from: http://omics.pnl.gov/software/DeconMSn.php.
- 27.Mayampurath AM, Jaitly N, Purvine SO, Monroe ME, Auberry KJ, Adkins JN, Smith RD. DeconMSn: a software tool for accurate parent ion monoisotopic mass determination for tandem mass spectra. Bioinformatics. 2008;24(7):1021–1023. doi: 10.1093/bioinformatics/btn063. [DOI] [PMC free article] [PubMed] [Google Scholar]
- 28.Iavarone F, Melis M, Platania G, Cabras T, Manconi B, Petruzzelli R, Cordaro M, Siracusano A, Faa G, Messana I, Zanasi M, Castagnola M. Characterization of salivary proteins of schizophrenic and bipolar disorder patients by top-down proteomics. J Proteome. 2014;103:15–22. doi: 10.1016/j.jprot.2014.03.020. [DOI] [PubMed] [Google Scholar]
- 29.Grassl N, Kulak NA, Pichler G, Geyer PE, Jung J, Schubert S, Sinitcyn P, Cox J, Mann M. Ultra-deep and quantitative saliva proteome reveals dynamics of the oral microbiome. Genome Med. 2016;8(1):44. doi: 10.1186/s13073-016-0293-0. [DOI] [PMC free article] [PubMed] [Google Scholar]
- 30.Sivadasan P, Gupta MK, Sathe GJ, Balakrishnan L, Palit P, Gowda H, Suresh A, Kuriakose MA, Sirdeshmukh R. Human salivary proteome—a resource of potential biomarkers for oral cancer. J Proteome. 2015;127(Pt A):89–95. doi: 10.1016/j.jprot.2015.05.039. [DOI] [PubMed] [Google Scholar]
- 31.Castagnola M, Cabras T, Iavarone F, Fanali C, Nemolato S, Peluso G, Laura Bosello S, Faa G, Ferraccioli G, Messana I. The human salivary proteome: a critical overview of the results obtained by different proteomic platforms. Expert Rev Proteomics. 2012;9(1):33–46. doi: 10.1586/epr.11.77. [DOI] [PubMed] [Google Scholar]
Associated Data
This section collects any data citations, data availability statements, or supplementary materials included in this article.
Supplementary Materials
Principal Component Analysis of the Blood Plasma Proteome Following Hydrocodone Administration. Principal Component Analysis (PCA) was used to visualize the relatedness of protein observations from blood plasma samples. Blood plasma proteome data demonstrated greater similarity by individual than by time post hydrocodone exposure. This is demonstrated by clustering of individuals (represented by varying colors) and not by time point post-drug administration. PC1 (x-axis) is principal component 1 and PC2 (y-axis) is principal component 2; PC1 and PC2 are the two principal components that account for the most variability in the data, with PC1 being the greatest. Percentages shown are the percent of variability that each PC accounts for. (PNG 164 kb)
(PDF 38 kb)
(PDF 343 kb)
(PDF 1135 kb)
(PDF 53 kb)