Abstract
Graphs, an effective form of data presentation, are used for summarizing complex information and making them easier to understand. Extracting numerical data from graphs, which is commonly required in systematic reviews and meta-analyses, is however a challenging issue. Since this kind of results presentation is common, ignorance of such data may result in publication bias when conducting meta-analyses. On the other hand, contacting the authors of a particular publication in order to retrieve the data may take a long time and is often not very fruitful. In this case, there are a few software and methods that may be used for data extraction; however, using these software is costly and not simple as well as different types of graphs need different extraction methods. Here, we have described a simple reproducible method for extracting data from graphs using Adobe Photoshop.
Keywords: Adobe Photoshop, Data Extraction, Graph, Meta-Analysis.
1. Background
Science has become a highly specialized endeavor and the total number of published papers has dramatically increased in the last decades. In biomedical sciences, there are currently > 24 million citations in the MEDLINE database alone (1). With such a huge number of publications, both clinicians and researchers need to choose the most worthwhile studies for providing complete and accurate answers to formulated questions (2). It is often impossible for readers to pinpoint and review all of the primary studies, therefore narrative reviews, meta-analyses, and systematic reviews are valuable resources of the summarized evidence on a particular topic (3).
Meta-analysis integrates the results of several independent studies to derive conclusions about that particular body of research (4). In general, results obtained from such meta-analyses may provide a more accurate representation of the effect of a particular treatment for a disease compared to any single trial that contributed to the pooled analysis (2). Graphs/figures are non-textual elements of the results section of a paper that present important messages of the research (5). In meta-analyses, extraction of numerical data from graphs is commonly required; it is however a challenging issue. On the other hand, disregarding such data may result in publication bias when conducting a meta-analysis. Contacting the authors in order to retrieve the data may take a long time and is often not very fruitful, because the research may have been performed so far in the past. In these cases, extracting the data from published graphs is a reasonable alternative. Here, we have described a simple method for extracting data from graphs using Adobe Photoshop.
2. Methods and Results
2.1. Extracting Data from Bar Graphs
The ruler tool in Adobe Photoshop is used to extract data; the steps are shown below:
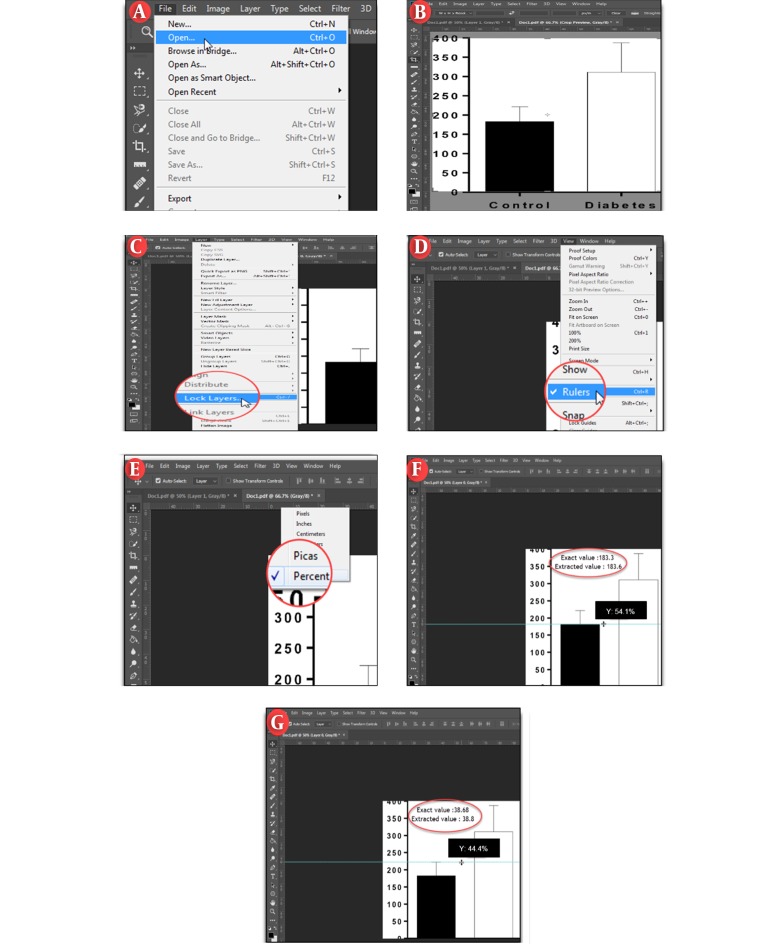
1. Opening the file in Adobe Photoshop: “File” menu → “Open” → select the image file → “Open” button (Figure 1A).
Figure 1. Data extraction from graphs using Adobe Photoshop. A, opening or importing a file; B, cropping a graph; C, locking a graph; D, activating rulers; E, choosing percent unit from context menu; F, creating a horizontal measurement line; G, finding the standard deviation/standard error of mean values.
2. Cropping the chart: “Image” menu → “Crop” → press “Enter” to confirm the action (Figure 1B).
For cropping, the rectangular marquee tool from the tool panel can also be used. It should be noted that cropping the chart has to be done carefully and the frame of the chart, exactly from beginning to end of the “y-axis” which displays a value (in Figure 1B this value is 400), should be selected.
3. Locking the layer: “Layer” panel → “Lock” (Figure 1C).
This action is used to prevent further movement of the graph during the next process.
4. Activating rulers: "View" menu → "Rulers" (Figure 1D).
For activating rulers, pressing Ctrl + R also appears a ruler along the top and along the left hand side of the Photoshop canvas.
5. Choosing percent unit from context menu: Right click on the ruler → “Percent” (Figure 1E).
6. Creating a horizontal measurement line and finding the required number: Click on the horizontal ruler and drag down on your chart. During dragging, a percentage of Y is shown, which displays the distance from the horizontal ruler; the beginning of the y-axis is 100% and the top of the y-axis is 0%. Without releasing the mouse button, when the measurement line is in the location you want, a percentage value is shown alongside the size (in Figure 1F this percentage is 54.1). Then, this value is subtracted from 100%, which displays the percentage of the location you want (100% - 54.1% = 45.9%). Now, for finding the number whose percent value is given, multiply the obtained percentage by the number that is placed at the top of the y-axis (in our example, 45.9% × 400 = 183.6).
7. Finding the standard deviation or standard error of the mean values: Click on the horizontal ruler and drag down on top of the standard deviation/error of the mean to show a percentage value (in Figure 1G, this percentage value is 44.4). Repeat this process again but this time drag down on thee mean value of the target group (in Figure 1F, this percentage value is 54.1). Then subtract the percentage value of the mean of the target group from the percentage value of top of the standard deviation/error (54.1% - 44.4% = 9.7%). The obtained percentage value is then multiplied by the number that is displaced on the top of the y-axis (9.7% × 400 = 38.8).
2.2. Extracting Data from XY Graphs
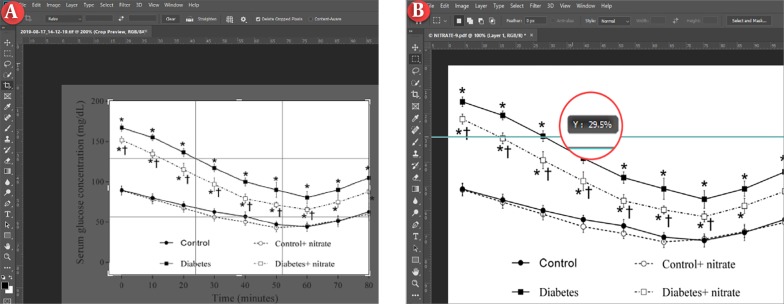
For extracting data from XY graphs, the same method can be used; in brief, after opening the file and cropping the graph in Adobe Photoshop (Figure 2A), click on the horizontal ruler and drag down on your chart. When the measurement line is in the location you want, a percentage of Y is shown alongside the size (in Figure 2B, this percentage is 29.5). Subtract this value from 100% (100% - 29.5% = 70.5%) and then multiply the obtained percentage by the number that is placed at the top of the y-axis (in our example, 70.5 % × 200 = 141).
Figure 2. Data extraction from XY graphs using Adobe Photoshop. A, cropping a graph; B, creating a horizontal measurement line.
2.3. Extracting Data from ROC Curves
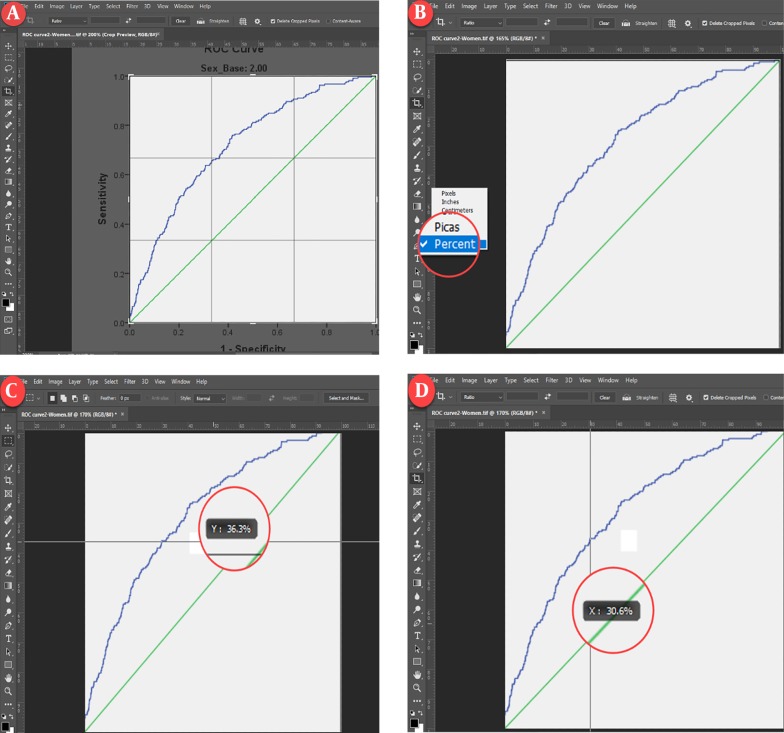
For receiver operating characteristic curves (ROC), which show the relationship between sensitivity (y-axis) and 1-specificity (x-axis) for every possible cut-off, both horizontal and vertical rulers should be activated. In brief, after opening the file and cropping the ROC curve (Figure 3A and 3B), activate and drag the horizontal ruler for finding the sensitivity (in Figure 3C, this percentage is 36.3). Now for finding the number whose percent value is given, subtract this value from 100% (100% - 36.3% = 63.7%) and multiply the obtained percentage by the number that is placed at the top of the y-axis (in our example, 63.7% × 1 = 0.637). For finding the specificity, drag the vertical ruler and when the measurement line is in the location you want, a percentage of X is shown alongside the size (in Figure 3D, this percentage is 30.6). Now without subtracting this value from 100%, multiply the obtained percentage by the number that is placed at the end of the x-axis (in our example, 30.6% × 1 = 0.306).
Figure 3. Data extraction from ROC curves in Adobe Photoshop. A, cropping a graph; B, activating rulers; C, creating a horizontal measurement line; D, creating a vertical measurement line.
2.4. Validity of the Method
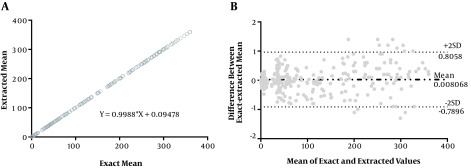
In order to assess the validity of this extraction method, correlations between the extracted and exact values were calculated using Spearman rank correlation; and for quantification of this agreement, Bland-Altman statistical analysis was performed using Graph Pad Prism software (version 6).
As shown in Figure 4, a strong correlation was found between the extracted and exact values (Spearman rho, 0.9998; P < 0.001). The lower and upper limits in Bland-Altman analysis also showed a good level of agreement between the extracted and exact values (bias, 0.008; limits of agreement, -0.789 to 0.805), which underscores the validity of this method. In addition, a high degree of inter-rater reliability was found between raters in this study. The single measure intra-class correlation (ICC) coefficient was 0.995 with a 95% confidence interval from 0.993 to 0.996 (F (336, 336) = 393.056, P < 0.0001).
Figure 4. Correlation (A) and Bland-Altman plots (B) between the extracted and exact values.
3. Discussion and Conclusion
Hereby, we have described how to extract numerical data from a graph using the ruler tool in the Adobe Photoshop. Extracted data displayed a strong agreement with the original values.
Extracting data from graphs, particularly in meta-analyses is needed because many researchers present their data in the graph format. WebPlotDigitizer, GetData Graph Digitizer, and Engauge Digitizer are software for extracting values from graphs (6, 7). Although we did not compare results obtained from Adobe Photoshop with web/software-based methods, it has been reported that the reliability and validity of the retrieved data are independent of the specific software program and differences between web/software-based methods originate in program usability, data retrieval time, and license costs (8). WebPlotDigitizer is the only program free to use and DataThief, Ungraph and XYit costs USD 25, USD 300, and USD 89, respectively (9). It has been reported that the time needed to retrieve the data by web/software-based methods is relatively high (an average of about 15 minutes per graph) (8, 9) and also the quality of a graph can clearly affect the reliability and validity of data extraction (10, 11). In addition, these types of software are not user-friendly and working with them is difficult; and also different types of graph need different extraction methods and have different extractable features (7). Using Adobe Photoshop to extract data points from graphs provides a simple alternative that is easier than other software methodologies and provides acceptable reproducible results. Furthermore, Photoshop is widely used, is very popular, and is one of the most powerful photo-editing software in the world that is commonly used by amateurs and professionals alike for almost everything. Thus, it can be helpful in saving time when preparing meta-analysis data. In conclusion, we have presented a simple and reliable method for extracting data from graphs using the Photoshop software.
Acknowledgments
This work was funded by the Shahid Beheshti University of Medical Sciences (grant no. 13284-1), Tehran, Iran.
Footnotes
Authors' Contribution:Sevda Gheibi participated in design of the study and draft of the manuscript. Khosrow Kashfi and Asghar Ghasemi participated in design of the study. Alireza Mahmoodzadeh participated in drafting the manuscript and image handling. Sajad Jeddi participated in literature review and draft of the manuscript. All authors approved the final manuscript.
Conflict of Interests:The authors declare that they have no conflict of interest.
Ethical Approval:The ethical code for this study is IR.SBMU.ENDOCRINE.REC.1396.513.
Funding/Support:This work was funded by the Shahid Beheshti University of Medical Sciences (grant no. 13284-1), Tehran, Iran.
Contributor Information
Sevda Gheibi, Email: sevda.1365@yahoo.com.
Alireza Mahmoodzadeh, Email: mahmoodzadeh@gmail.com.
Khosrow Kashfi, Email: drkho@verizon.net.
Sajad Jeddi, Email: sajad.jeddi@sbmu.ac.ir.
Asghar Ghasemi, Email: ghasemi@endocrine.ac.ir.
References
- 1.Dunn K, Marshall JG, Wells AL, Backus JEB. Examining the role of MEDLINE as a patient care information resource: An analysis of data from the Value of Libraries study. J Med Libr Assoc. 2017;105(4):336–46. doi: 10.5195/jmla.2017.87. [DOI] [PMC free article] [PubMed] [Google Scholar]
- 2.Haidich AB. Meta-analysis in medical research. Hippokratia. 2010;14(Suppl 1):29–37. [PMC free article] [PubMed] [Google Scholar]
- 3.Garg AX, Hackam D, Tonelli M. Systematic review and meta-analysis: When one study is just not enough. Clin J Am Soc Nephrol. 2008;3(1):253–60. doi: 10.2215/CJN.01430307. [DOI] [PubMed] [Google Scholar]
- 4.Rys P, Wladysiuk M, Skrzekowska-Baran I, Malecki MT. Review articles, systematic reviews and meta-analyses: Which can be trusted? Pol Arch Med Wewn. 2009;119(3):148–56. [PubMed] [Google Scholar]
- 5.Bahadoran Z, Mirmiran P, Zadeh-Vakili A, Hosseinpanah F, Ghasemi A. The principles of biomedical scientific writing: Results. Int J Endocrinol Metab. 2019;17(2):e92113. doi: 10.5812/ijem.92113. [DOI] [PMC free article] [PubMed] [Google Scholar]
- 6.Jelicic Kadic A, Vucic K, Dosenovic S, Sapunar D, Puljak L. Extracting data from figures with software was faster, with higher interrater reliability than manual extraction. J Clin Epidemiol. 2016;74:119–23. doi: 10.1016/j.jclinepi.2016.01.002. [DOI] [PubMed] [Google Scholar]
- 7.Kanjanawattana S, Kimura M. Extraction of graph information based on image contents and the use of ontology. International Association for the Development of the Information Society; 2016. [Google Scholar]
- 8.Moeyaert M, Maggin D, Verkuilen J. Reliability, validity, and usability of data extraction programs for single-case research designs. Behav Modif. 2016;40(6):874–900. doi: 10.1177/0145445516645763. [DOI] [PubMed] [Google Scholar]
- 9.Drevon D, Fursa SR, Malcolm AL. Intercoder reliability and validity of WebPlotDigitizer in extracting graphed data. Behav Modif. 2017;41(2):323–39. doi: 10.1177/0145445516673998. [DOI] [PubMed] [Google Scholar]
- 10.Shadish WR, Brasil ICC, Illingworth DA, White KD, Galindo R, Nagler ED, et al. Using UnGraph to extract data from image files: Verification of reliability and validity. Behav Res Methods. 2009;41(1):177–83. doi: 10.3758/BRM.41.1.177. [DOI] [PubMed] [Google Scholar]
- 11.Burda BU, O'Connor EA, Webber EM, Redmond N, Perdue LA. Estimating data from figures with a Web-based program: Considerations for a systematic review. Res Synth Methods. 2017;8(3):258–62. doi: 10.1002/jrsm.1232. [DOI] [PubMed] [Google Scholar]


