Abstract
The discovery of biologically active small molecules requires sifting through large amounts of data to identify unique or unusual arrangements of atoms. Here, we develop, test and evaluate an atom-based sort to identify novel features of secondary metabolites and demonstrate its use to evaluate novelty in marine microbial and sponge extracts. This study outlines an important ongoing advance towards the translation of autonomous systems to identify, and ultimately elucidate, atomic novelty within a complex mixture of small molecules
Keywords: molecular search engine, NMR spectroscopy, drug discovery, natural products, algorithms
Graphical Abstract
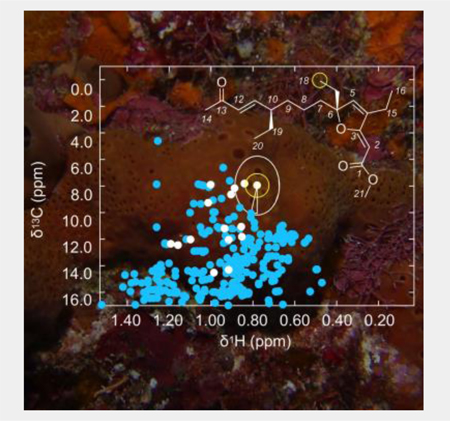
The discovery of biologically active small molecules requires sifting through large amounts of data to identify unique or unusual arrangements of atoms. Here, we develop, test and evaluate an atom-based sort to identify novel features of secondary metabolites and outline an important ongoing advance towards the translation of autonomous systems to identify, and ultimately elucidate, atomic novelty within a complex mixture of small molecules.
One of the most critical aspects in the discovery of biologically active small molecules is the elucidation of small molecular motifs with unique three-dimensional displays. The combination of this process with detailed target-based mode of action research[1] lies at the foundation of drug lead[2] discovery. While automation,[3] miniaturization,[4] digital networking[5] and machine learning-guided high-throughput screening[6] have produced active leads, the bulk of screening efforts still follow a central approach that begins with a molecular ensemble, either an extract containing natural products or a smart library of synthetic compounds.[7] Although both synthetic and natural approaches appear different, they typically apply a combination of molecular, cellular, or phenotypic screens. While effective, such approaches are often cluttered by the discovery of redundant structural features and motifs. This strategy has prevailed, in part, due to our inability to search for structural novelty.
Mass spectrometry (MS) methods, and associated profiling systems, provide an excellent means to characterize molecules, but are typically limited to databased compounds with effective molecular ionization. For the elucidation of molecular motifs NMR spectroscopy is required, typically achieved by collecting a series of 2D spectra, which a trained user interprets to unequivocally identify every atom in the sample. Recently, computational systems to evaluate NMR data have been developed.[8] Salient examples, such as the SMART system, allow one to rapidly identify the structural family of a purified compound.[8b] However, these tools use NMR data to evaluate molecular species. While these approaches enable rapid clustering of a new compound with structural neighbours, they are not able to identify novel material, which for natural product lead discovery requires one to return to the classical methods of compound isolation via dereplication with repeated purification and characterization steps.
One can view a mixture of compounds simply as a collection of atoms. Since NMR reports atomic data, it will provide information on all the atoms in all the compounds present in a mixture. Since the most common atoms in molecules of pharmaceutical interest are hydrogen (H) and carbon (C), a 1H-13C HSQC NMR spectrum provides a near complete map of the molecular frameworks within a screening collection. While some structural features are missed, this spectrum is routinely used by experts to classify and identify compounds, and for this reason we selected the 1H-13C HSQC experiment as the data source for developing an objective method that could be readily automated for scoring and sorting atomic novelty.
We began by constructing a 1H-13C HSQC peak database, where each peak describes a hydrogen attached to a carbon atom (Fig. 1c, Supporting Fig. S3) and is diagnostic of the atom’s immediate atomic environment (Supporting Figs. S1–S4). Using publicly available data, we abstracted peaks from spectra in the Human Metabolome Database[9] and the BioMagResBank,[10] and constructed peak lists from a tabulation of the chemical shifts of common solvents.[11] The public data was supplemented with spectra of standards and natural products collected in house or obtained from the literature. The total number of peaks was 10,308 obtained from 1,207 spectra.
Figure 1.
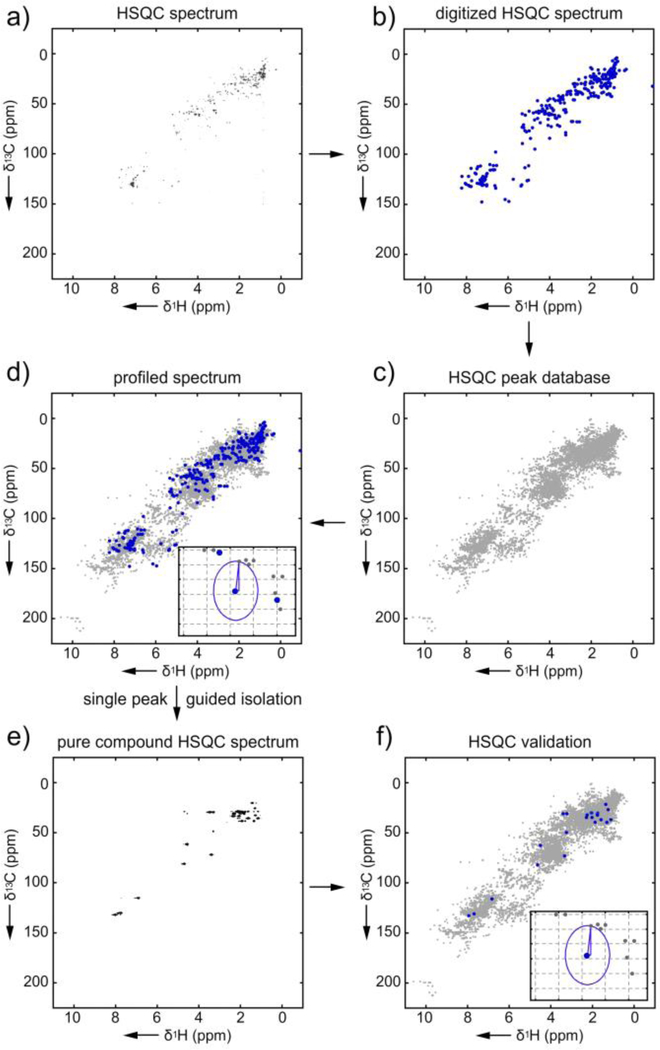
Searching atomic novelty in bromophycolide A. Workflow: a) The process begins by collection of a 1H-13C HSQC spectrum of bromophycolide A. b) Once collected, the peaks are then digitally abstracted to provide the observed peak list (a 10 KB text file). The observed peak list is then compared one peak at a time against the HSQC database (a 850 KB text file) using the Euclidian distance algorithm. c) To illustrate this graphically, we rendered the database as a HSQC spectrum. Here, each peak within the database is represented by a grey dot. d) In a graphical representation, the peaks to be profiled (blue) are then compared to the database peaks (grey). An inset shows graphically the distance calculation made between one of the peaks to be profiled (blue) and its closest database peak (grey). Other than collecting the NMR spectrum, the steps are conducted computationally with peak lists. The graphical representation in c)-d) is provided to visualize this process. This procedure can be used to guide isolation by following the most novel peaks. e) This results in a pure compound whose HSQC data can be f) re-subjected to the atomic novelty prioritization.
We then collected a 1H-13C HSQC spectrum on a 50 μg sample of a model natural product, bromophycolide A[12] (Fig. 1a, Supporting Fig. S4, Supporting Table S1). Automated digital peak picking of this spectrum produced a peak list (Fig. 1b), which was compared against the database (Fig. 1c) to provide a profiled spectrum (Fig. 1d, Supporting Fig. S5). A distance score for each peak in the profiled spectrum (Fig. 1d) was determined by calculating the Euclidean distance to the closest peak in the database (Supporting Table S1). Since the ranges of the 1H and 13C dimensions of a HSQC experiment differ by a factor of more than 10, equal weighting of the dimensions was achieved by dividing the distances in each dimension by the total range of the chemical shifts in the database for that dimension. For the database used here, the 1H chemical shift range was 10.25 ppm and the 13C range 211.6 ppm. The distance score was then expressed as a percentage, which can be thought of as the fraction of the total chemical shift range. Sorting the scores identified the most unusual chemical shifts, an indicator of a structurally unique proton and/or carbon atom.
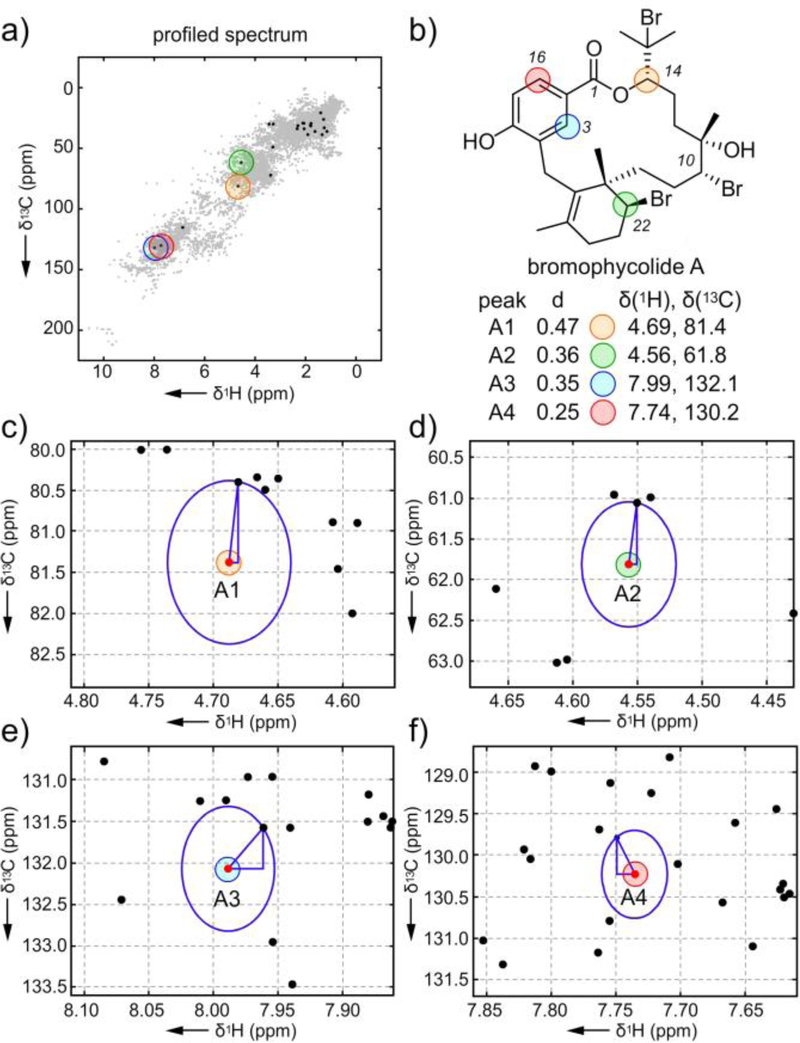
The four peaks A1-A4 (Fig. 2) with the largest distance scores are shown in Fig. 2c–2f. Pleasingly, these peaks corresponded to positions of structural novelty, namely the macrocyclic aryl system at C3 and C16, halogenation at C22 and a uniquely substituted macroaromatic lactone at C14. Similarly, testing the algorithm with strychnine (Supporting Table S2 and Figs. S6–S7), brusatol (Supporting Table S3 and Figs. S8–S9), and paclitaxel (Supporting Table S4 and Figs. S10–S11) also identified patterns of proton and carbon atom novelty. Like algorithms used for automated MS assignment[13] or NMR protein structure elucidation,[14] this scoring system provides critical information with regards to structural assignment as well as identifying regions of novelty.
Figure 2.
An Euclidian distance algorithm for atomic novelty scoring. a) The profiled spectrum of bromophycolide A with the top peaks A1-A4. b) The structure of bromophycolide A with A1-A4 highlighted. c)-f) Graphical rendering of the Euclidian distance evaluations between the bromophycolide A peak (red point) and its closest peak in the database (black points).
After testing with pure compounds, we then evaluated the approach as a method to prioritize natural product isolation. Here, the goal was to use this method to rapidly identify extracts that may have natural products with unique structural features. As illustrated in Fig. 1, the peaks with the highest novelty (Fig. 1d) can be used to guide the isolation of pure materials from the extract (Fig. 1e). 1H-13C HSQC data collected on the pure material (Fig. 1e) can be reapplied to the atomic prioritization as a means of validation (Fig. 1f).
We began by exploring extracts from a marine microbial strain. We prepared EtOAc extracts from the cultivation of a marine-derived Streptomyces sp., strain CNB-982, and collected 1H-13C HSQC data on 52 μg of crude material (Supporting Fig. S12). The peaks from this spectrum were extracted digitally, and compared against the database (Fig. 3b, Supporting Table S5, Supporting Fig. S13). Of the 289 peaks detected, 20 had distance scores greater than or equal to 1%.
Figure 3.
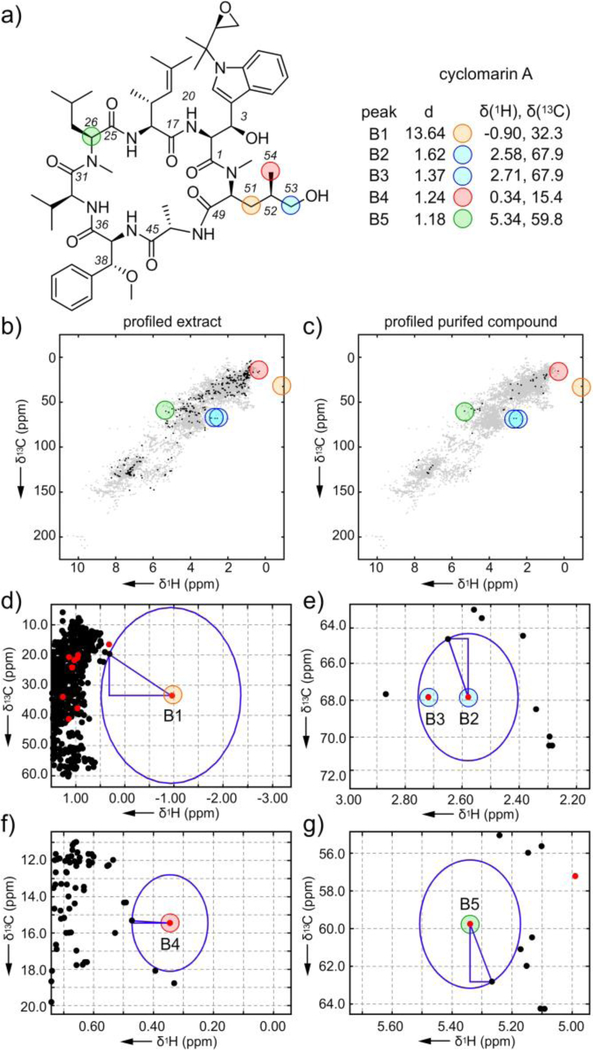
Exploration of the atomic novelty search on the marine microbial extract CNB-982 identifies the cyclic peptide cyclomarin A. a) Structure of cyclomarin A along with the chemical shifts of the top scoring peaks, B1-B5, from its 1H-13C HSQC spectrum in CD3OD. b) Profiled 1H-13C HSQC of the CNB-982 extract. c) Profiled 1H-13C HSQC of the purified cyclomarin A. d)-g) Graphical rendering of the Euclidian distance evaluations between peaks B1-B5 (red points) and closest peaks in the database (black points). Supporting Fig. S1 provides chemical structures of the closest database peaks to B1-B5.
We focused our attention on the top peak in the CNB-982 extract, B1 (δH = −0.91, δC = 32.4, distance = 13.74%, Fig. 3, Supporting Table S5). Using peak B1 to guide selection of chromatography fractions, we isolated 1.8 mg of a pure material. The combination of the exact mass for [M-H2O+H]+ m/z 1025.6062 observed by FAB mass spectrometry along with an expanded NMR data set (Supporting Figs. S16–S19 and Supporting Table S7), enabled the pure material to be identified as cyclomarin A (C56H80O11N8 calcd. 1025.6057) (see an expanded discussion in Supporting Fig. S3).[15] By profiling the pure cyclomarin A against the database (Fig. 3c, Supporting Table S6 and Supporting Fig. S13) we found the top five scoring peaks (Fig. 3a) were observed in the top 16 found in the crude mixture, indicating that much of the novelty came from one compound, therein validating the approach as shown in Fig. 1f.
Inspection of peaks B1-B5 (Fig. 3) was not only useful to guide isolation but provided structural information. As shown in Fig. 3d, we were able to determine that the top peak B1 (orange) was one of the protons at C51, which had an unusual proton chemical shift at −0.90 ppm. Peaks B2 and B3 arose from the geminal protons C53 (blue, Fig. 3e) with uncharacteristic proton shifts at 2.58 and 2.71 ppm. The fourth peak (B4, red, Fig. 3f) arose from the methyl group at C54. Peak B5 (green, Fig. 3g) was assigned to the alpha carbon (C26) of the leucine residue. Interestingly, all of the top four peaks arose from (2S,4R)-2-amino-5-hydroxy-4-methyl-pentanoic acid, a rare amino acid, therein confirming the method’s aptness to find structural novelty. Here, we demonstrated how this tool can be used to prioritize the isolation of materials from a crude extract. In this example, the top peak, B1, provided a clear spectroscopic beacon to guide the isolation process, and comparison with the proximal peaks in the database provided preliminary structural information (Supporting Fig. S8).
Next, we tested the system with extracts from a multicellular model using a marine sponge. A 1H-13C HSQC spectrum was recorded using a 32 μg sample of a CH2Cl2/MeOH extract from the marine sponge Plakortis halichondrioides (specimen code IM06–19) (Supporting Fig. S20). Digital data extraction followed by profiling against the database (Fig. 4b, Supporting Fig. S21) identified several peaks for prioritization (Supporting Table S9).
Figure 4.
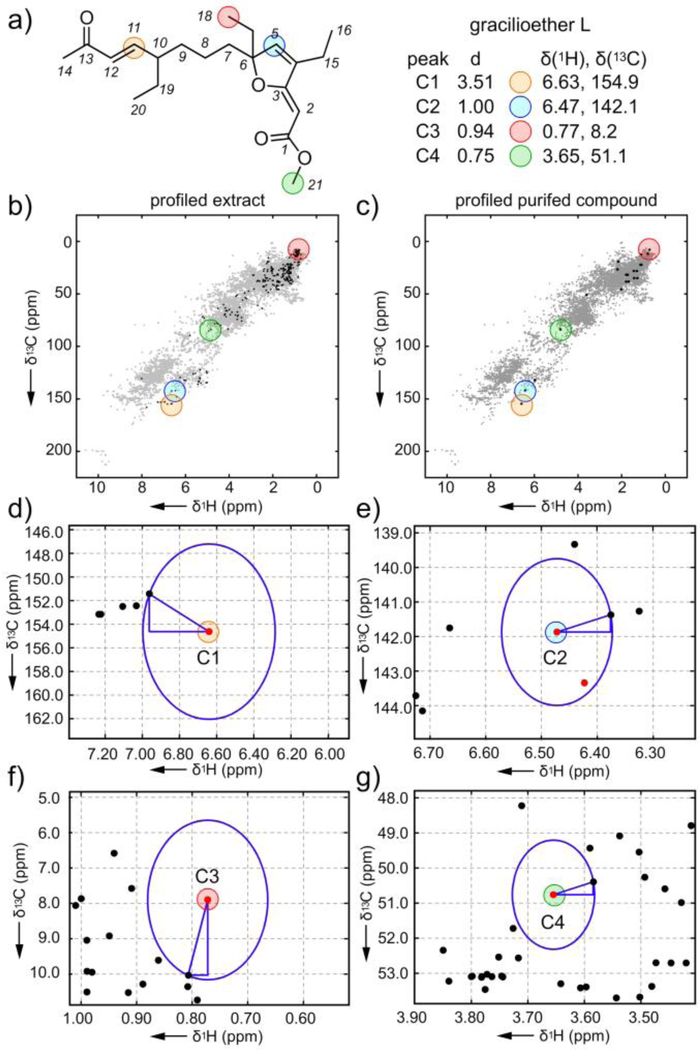
Exploration of the atomic novelty search on the Plakortis halichondrioides extract (IM06–19) identifies gracilioether L. a) Structure of gracilioether L along with the top peaks C1-C4 from 1H-13C HSQC spectrum in CD3OD. b) Profiled 1H-13C HSQC of the IM06–19 extract. c) Profiled 1H-13C HSQC of isolated gracilioether L. d)-g) Graphical rendering of the Euclidian distance evaluations between peaks C1-C4 observed in the spectrum of purified gracilioether L (red points) and its closest peaks in the database (black points). Supporting Fig. S2 provides chemical structures of closest database peaks to C1-C4. The stereochemistry at C6 and C10 was not determined.
Selecting peak C1 as an NMR guide (Fig. 4a), we isolated 1.2 mg of pure material (Fig. 4c, Supporting Figs. S22–S23 and Table S9) from 1.9 g of crude extract with a HRMS sodiated molecular ion with m/z 371.2193 suggesting a formula of C21H32O4Na. Collection and evaluation of 1D and 2D NMR data (Supporting Figs. S24–S27 and Supporting Table S10) identified the material as a new compound, gracilioether L (Fig. 4a, see an expanded discussion in Supporting Fig. S4), a two-carbon chain elongated homologue of gracilioether B.[16] As shown in Fig. 4d–4f, the top three peaks C1-C3 were observed at the C11 trans-olefin (C1, Fig. 4d), furanyl-C4 olefin (C2, Fig. 4e) and terminal carbon C18 of an ethyl group at C6 (C3, Fig. 4f). The novelty search then identified the methyl ester C21 (peak C4, Fig. 4g) as the next unique chemical shift. Interestingly, these atoms are at positions where modifications are commonly observed within this large family of congeners. Further inspection of the entire prioritization (Supporting Table S9) additionally supports this conclusion, suggesting that this tool may also have applications to identify novelty within families of related natural products. Like cyclomarin A, comparing peaks C1-C4 against their proximal database peaks provided a direct structural correlation and was particularly useful in validating peak assignments (Supporting Figs. S2, S4).
Overall, we have demonstrated the application of this tool to autonomously evaluate atomic novelty. These studies demonstrate how one can integrate NMR profiling as a means to identify novelty within an extract and isolate unique materials from these extracts using only micrograms of material. While one often views NMR analysis as expensive and slow, the speed and material requirements, < 6 min using a 35 μL sample, rival those conventionally used by mass spectrometry. The fact that less than 5 min is required for data collection and 1 min for data abstraction and algorithmic processing, clearly demonstrates the practical nature of the process. Here, we found that the prioritizing of peaks was dependent on the quality of the peak list. While noise peaks rarely interfered, we found that two-bond correlations, cross peaks between atoms connected by two bonds instead of one, often scored highly. To flag these peaks we identified 99.99% confidence limits on the database peaks. Peaks falling outside these limits were checked for shared coordinates with two other peaks. Efforts are now underway to expand this tool to flag noise and artifacts, and exclude two-bond correlations.
We foresee this tool expanding to become a multicomponent algorithm that not only incorporates Euclidian distance scoring of 1H-13C HSQC spectra but also includes data obtained from such spectra as 1H-1H-COSY, 1H-1H-TOCSY, 1H-1H-NOESY, 1H-1H-ROESY, 1H-13C-HMBC, 1H-15N-HSQC and 1H-15N-HMBC, collected in a single interleaved experiment.[17] Direct digital extraction of chemical shifts from the raw data[18] will push the protocol closer to native computational interrogation. This in turn will expedite the growth of the database, which we anticipate will eventually be able to assign the structural features of each carbon and proton within a given molecule. While structural assignment is a key facet of the drug discovery process, the ability to search through molecular data one atom at a time offers a new perspective that can enable this system to operate through a conventional online portal, one that ideally will be united with biosynthetic genome mining tools[19] such as antiSMASH,[20] as well as proteomic[21] and transcriptomic[22] data. Ultimately, it will be interesting to understand the correlation between structural novelty and its role in inducing novel biological activity, perhaps done best one atom at a time.
Supplementary Material
Acknowledgements
This program was supported in part by funding from NIH Grant 1SC1GM086271-01A1 awarded to A.D.R., the Xenobe Research Institute to J. J. L. and NIH grant CA044848 to W.F.
References
- [1].a) Cardona ST, Selin C, Gislason AS, Crit. Rev. Microbiol. 2015, 41, 465–472; [DOI] [PubMed] [Google Scholar]; b) La Clair JJ, Nat. Prod. Rep. 2010, 27, 969–995. [DOI] [PubMed] [Google Scholar]
- [2].Eder J, Sedrani R, Wiesmann C, Nat. Rev. Drug. Discov. 2014, 13, 577–587. [DOI] [PubMed] [Google Scholar]
- [3].Leahy DE, Sykora V, Drug Discov. Today Technol. 2013, 10, e437–e441. [DOI] [PubMed] [Google Scholar]
- [4].Neuži P, Giselbrecht S, Länge K, Huang TJ, Manz A, Nat. Rev. Drug Discov. 2012, 11, 620–532; [DOI] [PMC free article] [PubMed] [Google Scholar]
- [5].Quinn RA, Nothias LF, Vining O, Meehan M, Esquenazi E, Dorrestein PC, Trends Pharmacol. Sci. 2017, 38, 143–154. [DOI] [PubMed] [Google Scholar]
- [6].Scheeder C, Heigwer F, M Boutros M. Curr. Opin. Syst. Biol. 2018, 10, 43–52. [DOI] [PMC free article] [PubMed] [Google Scholar]
- [7].Spear KL, Brown SP, Drug Discov. Today Technol. 2017, 23, 61–66 [DOI] [PubMed] [Google Scholar]
- [8].a) Gerwick WH, J. Nat. Prod. 2017, 80, 2583–2588; [DOI] [PubMed] [Google Scholar]; b) Zhang C, Idelbayev Y, Roberts N, Tao Y, Nannapaneni Y, Duggan BM, Min J, Lin EC, Gerwick EC, Cottrell GW, Gerwick WH, Sci. Rep, 2017, 7, 14243; [DOI] [PMC free article] [PubMed] [Google Scholar]; c) Olivon F, Allard PM, Koval A, Righi D, Genta-Jouve G, Neyts J, Apel C, Pannecouque C, Nothias LF, Cachet X, Marcourt L, Roussi F, Katanaev VL, Touboul D, Wolfender JL, Litaudon M, ACS Chem. Biol. 2017, 12, 2644–2651. [DOI] [PubMed] [Google Scholar]
- [9].Wishart DS, Feunang YDD, Marcu A, Guo ACC, Liang K, Vázquez-Fresno R, Sajed T, Johnson D, Li C, Karu N, Sayeeda Z, Lo E, Assempour N, Berjanskii M, Singhal S, Arndt D, Liang Y, Badran H, Grant J, Serra-Cayuela A, Liu Y, Mandal R, Neveu V, Pon A, Knox C, Wilson M, Manach C, Scalbert A, Nucleic Acids Res. 2018, 46, D1. [DOI] [PMC free article] [PubMed] [Google Scholar]
- [10].Ulrich EL, Akutsu H, Doreleijers JF, Harano Y, Ioannidis YE, Lin J, Livny M, Mading S, Maziuk D, Miller Z, Nakatani E, Schulte CF, Tolmie DE, Wenger R. Kent, Yao H, Markley JL, Nucleic Acids Res. 2018, 36, D402–D408. [DOI] [PMC free article] [PubMed] [Google Scholar]
- [11].Gottlieb HEE, Kotlyar V, Nudelman AJ, J. Org. Chem. 1997, 62, 7512–7515. [DOI] [PubMed] [Google Scholar]
- [12].Kubanek J, Prusak AC, Snell TW, Giese RA, Hardcastle KI, Fairchild CR, Aalbersberg W, Raventos-Suarez C, Hay ME, Org. Lett. 2005, 7, 5261–5264. [DOI] [PMC free article] [PubMed] [Google Scholar]
- [13].a) Sandrin TR, Demirev PA, Mass Spectrom. Rev. 2018, 37, 321–349; [DOI] [PubMed] [Google Scholar]; b) Kind T, Tsugawa H, Cajka T, Ma Y, Lai Z, Mehta SS, Wohlgemuth G, Barupal DK, Showalter MR, Arita M, Fiehn O, Mass Spectrom. Rev. 2018, 37, 513–532. [DOI] [PMC free article] [PubMed] [Google Scholar]
- [14].a) Würz JM, Kazemi S, Schmidt E, Bagaria A, Güntert P, Arch. Biochem. Biophys. 2017, 628, 24–32; [DOI] [PubMed] [Google Scholar]; b) Andreas LB, Le Marchand T, Jaudzems K, Pintacuda G, J. Magn. Reson. 2015, 253, 36–49; [DOI] [PubMed] [Google Scholar]; c) Güntert P, Eur Biophys. J. 2009, 38, 129–143; [DOI] [PubMed] [Google Scholar]; d) Zimmerman DE, Montelione GT, Curr. Opin. Struct. Biol. 1995, 5, 664–673; [DOI] [PubMed] [Google Scholar]; e) Andreas LB, Le Marchand T, Jaudzems K, Pintacuda G, J. Magn. Reson. 2015, 253, 36–49. [DOI] [PubMed] [Google Scholar]
- [15].Renner MK, Shen Y-C, Cheng X-C, Jensen PR, Frankmolle W, Kauffman CA, Fenical W, Lobkovsky E, Clardy J, J. Am. Chem. Soc. 1999, 121, 11273–11276. [Google Scholar]
- [16].a) Norris MD, Perkins MV, Sorensen EJ, Org. Lett. 2015, 17, 668–671; [DOI] [PubMed] [Google Scholar]; b) Festa C, Lauro G, De Marino S, D’Auria MV, Monti M, Casapullo C, D’Amore A, Renga B, Mencarelli A, Petek S, Bifulco G, Fiorucci SA, Zampella A. J. Med. Chem. 2012, 55, 8303–8317; [DOI] [PubMed] [Google Scholar]; c) Ueoka R, Nakao Y, Kawatsu S, Yaegashi J, Matsumoto Y, Matsunaga S, Furihata K, van Soest RW, Fusetani N, J. Org. Chem. 2009, 74, 4203–4207; [DOI] [PubMed] [Google Scholar]; d) Carmen F, D’Amore C, Renga B, Gianlugi L, De Marino S, D’Auria MV, Bifulco G, Mar. Drug. 2013, 11, 2314–2328. [DOI] [PMC free article] [PubMed] [Google Scholar]
- [17].Kupče E, Claridge TDW, Angew. Chem. Int. Ed. Engl. 2017, 56, 11779–11783; Angew. Chem. 2017, 129, 11941–11945. [DOI] [PubMed] [Google Scholar]
- [18].a) Krishnamurthy K, Mag. Reson. Chem. 2013, 51, 821–829; [DOI] [PubMed] [Google Scholar]; b) Krishnamurthy K, Sefler AM, Russell D, Mag. Reson. Chem. 2017, 55, 224–232. [DOI] [PubMed] [Google Scholar]
- [19].a) Tran PN, Yen MR, Chiang CY, Lin HC, Chen PY, Appl. Microbiol. Biotechnol. 2019, 103, 3277–3287; [DOI] [PMC free article] [PubMed] [Google Scholar]; b) Foulston L, Curr. Opin. Microbiol. 2019, 51, 1–8; [DOI] [PubMed] [Google Scholar]; c) Alonso-Betanzos A, Bolón-Canedo V, Adv. Exp. Med. Biol. 2018, 1065, 607–626; [DOI] [PubMed] [Google Scholar]; d) Kiran G. Seghal, Ramasamy P, Sekar S, Ramu M, Hassan S, Ninawe AS, Selvin J, Int. J. Biol. Macromol. 2018, 112, 1278–1288. [DOI] [PubMed] [Google Scholar]
- [20].Blin K, Wolf T, Chevrette MG, Lu X, Schwalen CJ, Kautsar SA, Duran H. G. Suarez, de Los Santos ELC, Kim HU, Nave M, Dickschat JS, Mitchell DA, Shelest E, Breitling R, Takano E, Lee SY, Weber T, Medema MH, Nucleic Acids Res. 2017, 45, W36–W41. [DOI] [PMC free article] [PubMed] [Google Scholar]
- [21].a) Griss J, Proteomics 2016, 16, 729–740; [DOI] [PubMed] [Google Scholar]; b) Calderón-González KG, Hernández-Monge J, Herrera-Aguirre ME, Luna-Arias JP, Adv. Exp. Med. Biol. 2016, 919, 281–341; [DOI] [PubMed] [Google Scholar]; c) Turriziani B, von Kriegsheim A, Pennington SR, Adv. Exp. Med. Biol. 2016, 919, 383–396. [DOI] [PubMed] [Google Scholar]
- [22].a) Amos GCA, Awakawa T, Tuttle RN, Letzel AC, Kim MC, Kudo Y, Fenical W, Moore BS, Jensen PR, Proc. Natl. Acad. Sci. USA 2017, 114, E11121-E11130; [DOI] [PMC free article] [PubMed] [Google Scholar]; b) Bauer JS, Fillinger S, Förstner K, Herbig A, Jones AC, Flinspach K, Sharma C, Gross H, Nieselt K, Apel AK, RNA Biol. 2017, 14, 1617–1626. [DOI] [PMC free article] [PubMed] [Google Scholar]
Associated Data
This section collects any data citations, data availability statements, or supplementary materials included in this article.


