Abstract
Background
Bacterial meningitis is a devastating central nervous system (CNS) infection with acute and long-term neurological consequences, including cognitive impairment. The aim of this study was to understand the association between activated microglia-induced neuroinflammation and post-meningitis cognitive impairment.
Method
Meningitis was induced in male Wistar rats by injecting Streptococcus pneumoniae into the brain through the cisterna magna, and rats were then treated with ceftriaxone. Twenty-four hours and 10 days after meningitis induction, rats were imaged with positron emission tomography (PET) using [11C]PBR28, a specific translocator protein (TSPO) radiotracer, to determine in vivo microglial activation. Following imaging, the expression of TSPO, cardiolipin, and cytochrome c, inflammatory mediators, oxidative stress markers, and glial activation markers were evaluated in the prefrontal cortex and hippocampus. Ten days after meningitis induction, animals were subjected to behavioral tests, such as the open-field, step-down inhibitory avoidance, and novel object recognition tests.
Results
Both 24-h (acute) and 10-day (long-term) groups of rats demonstrated increased [11C]PBR28 uptake and microglial activation in the whole brain compared to levels in the control group. Although free from infection, 10-day group rats exhibited increased expression levels of cytokines and markers of oxidative stress, microglial activation (IBA-1), and astrocyte activation (GFAP) similar to those seen in the 24-h group. Acute meningitis induction also elevated TSPO, cytochrome c, and caspase-3 levels with no change in caspase-9 levels. Furthermore, upregulated levels of TSPO, cytochrome c, and caspase-3 and caspase-9 were observed in the rat hippocampus 10 days after meningitis induction with a simultaneous reduction in cardiolipin levels. Animals showed a cognitive decline in all tasks compared with the control group, and this impairment may be at least partially mediated by activating a glia-mediated immune response and upregulating TSPO.
Conclusions
TSPO-PET could potentially be used as an imaging biomarker for microglial activation and long-term cognitive impairment post-meningitis. Additionally, this study opens a new avenue for the potential use of TSPO ligands after infection-induced neurological sequelae.
Keywords: Meningitis, Post-meningitis, Microglia, TSPO, Inflammation, PET, Cognition
Introduction
Meningitis is a devastating disease that causes the inflammation of the meninges and the subarachnoid space and accounts for high rates of morbidity and mortality worldwide [1]. Although the incidence of bacterial meningitis in Western countries has gradually declined from 3 to 4% to 0.7 to 0.9 per 100,000 persons per year over the past 10 to 20 years, in African countries, the incidence rates are steadily rising at 10 to 40 cases per 100,000 persons per year [2]. In addition to acute complications, approximately 10 to 27% of meningitis survivors also suffer from lingering neurological consequences, such as cognitive impairment, including dementia [3]. However, the mechanisms that cause long-term cognitive impairment after meningitis remain elusive.
Evidence suggests a strong association between inflammation and cognitive decline in several models [4]. Microglia, the primary innate immune cells in the central nervous system (CNS), play a critical role in regulating the brain’s inflammatory milieu during healthy and diseased conditions [5]. During CNS insult, the activated microglia transform into an amoeboid phenotype and respond to the pathologic event by releasing a plethora of substances, including cytokines, chemokines, and growth factors [6]. Understanding the activation of microglia is essential, as studies suggest that the activation of microglia could perpetrate neurodegeneration through several mechanisms [7]. For the past few decades, visualizing microglial activation in vivo, after CNS insult, has been enabled by positron emission tomography (PET), an ideal imaging technique. The noninvasive detection of neuroinflammation by PET imaging is used in a broad spectrum of diseases, including neurodegenerative disorders [8, 9] and psychiatric complications [10, 11], by utilizing the pharmacological ligands of the mitochondrial translocator protein (TSPO). In eukaryotes, TSPO, previously known as the peripheral benzodiazepine receptor (PBR), is ubiquitously expressed in the outer mitochondrial membrane in astrocytes and microglial cells. The expression of the neuroimmunomodulatory target TSPO rises after CNS insult due to the presence of infiltrating inflammatory cells and activated microglia [12, 13]. Interacting with voltage-dependent anion channel (VDAC) and the adenine nucleotide translocator (ANT), TSPO modulates the mitochondrial permeability transition pore (MPTP), leading to either cell death via the opening of MPTP or cell protection by blocking MPTP and thereby regulating mitochondrial function [14, 15].
In this context, we hypothesize that persistent microglial activation and perpetuated levels of TSPO expression might play a role in cognitive decline in meningitis survivors. Previously, we reported long-term cognitive impairment after meningitis induced by Escherichia coli [16], Klebsiella pneumoniae [17], Streptococcus agalactiae [18], and Streptococcus pneumoniae [19] in neonatal and adult rats. However, in vivo microglial activation and TSPO levels were not explored to evaluate the mechanistic and diagnostic significance of PET imaging. Hence, we aimed to investigate in vivo microglial activation 24 h (acute) and 10 days (long-term) after experimental meningitis induction as measured by [11C]PBR28 PET/CT imaging. Additionally, we sought to compare the levels of oxidative stress markers, inflammatory mediators, and markers of glial activation in the 24-h and the 10-day groups. We used a battery of behavioral tests to assess habituation memory, aversive memory, and long-term memory, 10 days after meningitis induction. Due to the lack of evidence on the TSPO-mediated mitochondrial pathway after meningitis, we also investigated the cardiolipin, cytochrome-c, and caspase levels in the experimental meningitis models.
Materials and methods
Infectious organism used for the induction of meningitis
The strain used to induce meningitis, namely serotype III S. pneumoniae, was cultured in 5 mL of Todd Hewitt Broth BBL™, diluted in fresh medium, and then grown to the logarithmic phase. The culture was centrifuged for 10 min at 1200 rpm and resuspended in sterile pyrogen-free saline to a concentration of 5 × 10⁹ colony-forming units (CFU) [20].
Animal model of meningitis
Eight-week-old male Wistar rats, weighing 200 to 250 g, purchased from Charles River, were housed at a temperature of 20 °C and a humidity level of 30% on a 12-h light-dark cycle (lights on 0600 hours). Food and water were available ad libitum. All protocols were approved by the Institutional Animal Welfare Committee (AWC) of the Center for Laboratory Animal Medicine and Care (CLAMC) of the University of Texas Health Science Center at Houston (UTHealth), TX, USA (AWC-15-0099). All possible efforts were made to reduce animal suffering and the number of animals used. All bacterial inoculations were performed under anesthesia using 3% isoflurane. The animals received an intracisternal (i.c.) injection of 10 μL of artificial cerebrospinal fluid (CSF) as a placebo or an equivalent volume of S. pneumoniae suspension. The animals received fluid replacement soon after bacterial inoculation and were then returned to their cages. Meningitis was confirmed by incubating a quantitative culture of 5 μL of CSF at 35 °C with 5% CO2 in sheep blood agar [19]. After 18 h of meningitis induction or artificial CSF injection, all animals received ceftriaxone (100 mg/kg, i.p.) twice a day for 7 days [21].
Study design
After 1 week of acclimatization, the rats were grouped into the 24-h or 10-day group. The groups were 24 h control, 24 h meningitis, 10 days control, and 10 days meningitis. Twenty-four hours and 10 days after meningitis induction, all rats were subjected to PET imaging. Rats from the 10-day groups were subjected to behavioral tasks before they underwent PET/CT. We used a separate cohort of rats for each of the different behavioral studies performed. Following PET imaging, rats were euthanized (under 4 to 5% isoflurane) and transcardially perfused with saline followed by 4% paraformaldehyde to collect the brains for immunohistochemistry. For biochemical evaluation, the prefrontal cortex (PFC) and hippocampus were immediately isolated and stored at − 80 °C until further processing.
Small animal PET/CT scan
Control rats and meningitis rats from both the 24-h and 10-day groups were subjected to PET/CT imaging. All rats were manipulated in accordance with the University of Texas MD Anderson department’s IACUC guidelines. To perform the imaging, rats were anesthetized with 2% isoflurane and PET imaging was performed in a dedicated small animal Bruker Albira PET/SPECT/CT scanner (Bruker Biospin Corp., Billerica, MA, USA) with a 10-cm and a 12-cm axial field-of-view (FOV) and transaxial FOV, respectively. An intravenous bolus injection of ~ 300 μCi of [11C]PBR28 in 200 μL saline was given concomitantly via the tail vein along with the acquisition of PET imaging in the list-mode. The PET scan was acquired for 20 min, followed by a CT scan (400 μA, 45 kV, 120 projections) of the head and upper torso for attenuation correction and image registration. The list-mode data were binned into dynamic frames: 15 × 20 s, 5 × 60 s, and 2 × 300 s. The PET images were then reconstructed using the maximum likelihood expectation maximization (MLEM) method with 12 iterations. Scatter, random, decay, and attenuation corrections were applied. The analysis was performed with Pmod (PMOD Technologies Ltd., Zürich, Switzerland). The mean standard uptake volume (SUV)-body weight (g/ml) of the whole brain and normal muscle tissue were measured [22].
Biochemical evaluation
Oxidative stress parameters
Nitrite/nitrate concentration
The tissue samples were homogenized in 1 ml of ice-cold 0.1 M phosphate buffer (pH 7.4). In addition, an aliquot of homogenate was centrifuged at 10000 rpm for 8 min with trichloroacetic acid (TCA) 50% to deproteinization of the sample. Nitrite/nitrate concentration was assayed spectrophotometrically using Griess reagents [1% sulfanilamide in 5% phosphoric acid and 0.1% N-1-naphthylethylenediamine dihydrochloride in distilled H2O (NED solution)] and vanadium (III) chloride. A standard curve was run simultaneously with each set of samples, and the optical density was measured spectrophotometrically at 550 nm [23]. The results were expressed as nmol/mg of protein.
Myeloperoxidase (MPO) activity
The tissue samples were homogenized in 1 ml of ice-cold 0.1 M phosphate buffer (pH 7.4) and 0.5% hexadecyltrimethylammonium bromide (Sigma-Aldrich, Saint Louis, USA). Homogenates were centrifuged at 15000 rpm for 15 min at 4 °C and were used an aliquot of supernatant that was mixed with a solution of 1.6 mM tetramethylbenzidine (TMB) and 1 mM H2O2. The supernatant was mixed with a solution of 1.6 mM tetramethylbenzidine (TMB) and 1 mM H2O2. MPO activity was measured spectrophotometrically at 650 nm at 37 °C [24]. The results were expressed as mU/mg of protein.
Lipid peroxidation
As an index of oxidative damage to lipids, we verified the formation of thiobarbituric acid reactive species (TBARS) in an acid-heating reaction. The tissue samples were homogenized in 1 ml of ice-cold 0.1 M phosphate buffer (pH 7.4). Then, an aliquot of homogenate was centrifuged at 1000 rpm for 10 min with trichloroacetic acid (TCA) 10% to deproteinization. The pellet was discarded and aliquots of supernatants were separated and used for the determination of lipid oxidative damage. TBARS was determined by the absorbance at 535 nm using 1,1,3,3-tetramethoxypropane as an external standard [25]. The results were expressed as malondialdehyde (MDA) equivalents nmol/mg of protein.
Protein carbonyl formation
The tissue samples were homogenized in 1 ml of ice-cold 0.1 M phosphate buffer (pH 7.4). Homogenates were centrifuged at 14000 rpm for 15 min at 4 °C, and supernatants were used for the determination of protein oxidative damage. Protein oxidation was assessed by the determination of carbonyl groups based on the reaction with dinitrophenylhydrazone. Briefly, proteins were precipitated by the addition of 20% trichloroacetic acid and were dissolved in dinitrophenylhydrazone, and the absorbance was read at 370 nm [26]. The results were expressed as protein carbonylation nmol/mg of protein.
Superoxide dismutase (SOD) activity
The tissue samples were homogenized in 1 ml of glycine buffer (pH 10.2). Homogenates were centrifuged at 3000 rpm for 10 min at 4 °C, and supernatants were used for the determination of SOD activity. SOD (EC 1.15.1.1) activity was determined using a spectrophotometric assay based on the superoxide-dependent oxidation of epinephrine to adrenochrome at 32 °C. Absorption was measured at 480 nm [27]. The SOD-specific activity was represented as mU/mg of protein.
Catalase (CAT) activity
The tissue samples were homogenized in 1 ml of ice-cold 0.1 M phosphate buffer (pH 7.4). Homogenates were centrifuged at 3.000 rpm for 10 min at 4 °C. The pellet was discarded, and aliquots of supernatants were separated and used for the determination of catalase. CAT (EC 1.11.1.6) activity was assayed by measuring the decrease in absorbance at 240 nm in a reaction medium containing 20 mM H2O2, 0.1% Triton X-100, 10 mM potassium phosphate buffer, at a pH 7.0, and supernatants containing 0.1–0.3 mg protein/mL [28]. The specific activity was expressed as mU/mg of protein.
Immunoblot analysis
Protein determination
The results were normalized by the protein content, following Lowry’s method using bovine serum albumin (BSA) as a standard. The absorbance was read at 700 nm, and the results were expressed as mg of protein [29].
Isolation of mitochondria
Mitochondrial isolation was performed according to the manufacturer’s instructions (Catalog no. 89801, Thermo ScientificTM, USA). Briefly, the tissue (50–200 mg) was disrupted using a homogenizer in PBS and then centrifuged at 1000×g for 3 min at 4 °C. The pellet was suspended in 800 μL BSA/reagent A solution, then the suspension was vortexed at medium speed for 5 s and incubated on ice for exactly 2 min afterward. Then, 10 μL of mitochondria isolation reagent B was added, and it was vortexed at maximum speed for 5 s. Approximately 800 μL of mitochondria isolation reagent C was added to the tube, which was then inverted several times and centrifuged at 700×g for 10 min at 4 °C. The supernatant was then centrifuged at 3000×g for 15 min at 4 °C. The mitochondrial pellet was collected and washed.
Western blot analysis
Western blot analysis was performed as per the protocols of previous studies [30]. The PFC and hippocampus regions of the rat brains were thawed and homogenized using Complete Protease Inhibitor Cocktail tablets (Roche, Diagnostics, IN, USA). The homogenate was centrifuged at 12000 rpm for 20 min at 4 °C. Protein concentrations in tissue were determined using the bicinchoninic acid (BCA) assay method. For the western blot run, equal amounts of proteins (30-50 μg) for each sample were loaded in Mini-Protean TGX precast gels (Bio-Rad, CA, USA). Proteins were transferred onto polyvinylidenedifluoride (PVDF) membranes using a Trans-Blot® Turbo™ system (Bio-Rad, CA, USA). Then, the PVDF membranes were blocked with 5% nonfat dry milk (Bio-Rad) in Tris-buffered saline plus 0.1% Tween 20 buffer (TBST, Bio-Rad, CA, USA) for 1 h at room temperature (RT) and kept overnight in a cold room on a shaker with primary antibodies afterward. The primary antibodies used for mitochondrial fractions were TSPO (1:500, LS Bio, LS-B14234), VDAC (1:1000, Thermo, PA1-954A), and ANT (1:1000, Abcam, ab102032). The primary antibodies used in tissue homogenate were glial fibrillary acidic protein (GFAP) (1:1000, Abcam, ab7260), CD 11B (1:1000, Abcam, ab75476), ionized calcium-binding adaptor molecule (IBA)-1 (1:1000, Abcam, ab108539), anti-oligodendrocyte (Oligo, 1:1000, Abcam, ab53041), NeuN (1:1000, Abcam, ab177487), and cytochrome-c (1:1000, Abcam, ab13575). The following day, the blots were washed three times in TBST and incubated with a horseradish peroxidase-conjugated secondary antibody (1:10000) for 1 h at RT. After three final washes of 10 min each with TBST, bands were detected using enhanced chemiluminescence (Clarity Western ECL Substrate; Bio-Rad, CA, USA) with the ChemiDoc MP (Bio-Rad, CA, USA) western blotting imaging system. After imaging, the blots were incubated in the stripping buffer (Thermo Fisher Scientific; 46430, IL, USA) for 10–15 min at RT followed by three washes with TBST. The stripped blots were incubated in blocking solution (5% nonfat dry milk in TBST) for 1 h and then incubated with the primary antibody directed against β-tubulin (1:5000, Abcam, ab6046) or COX IV (1:5000, Abcam, ab16056) as a loading control. Densitometric analysis of each protein was conducted using Image Lab™ software (Bio-Rad, CA, USA). The results were expressed as the ratio between the loading control and the target protein.
Multiplex assay for the quantification of the inflammatory cytokines
Cytokine levels were assayed using multiplex fluorescent immunoassay kits (Bio-Plex Pro™ Rat Cytokine 14-Plex Assay) [31]. The xMAP platform used here was based on rules-based medicine (RBM) fluorescent beads and antibody pairs. These are sensitive, specific, and widely used reagents, produced by manufacturers, and data collected using xMAP multiplex beads have been widely reported in the literature, in studies in which multiple proteins are assayed simultaneously. Tissue lysates were prepared according to the instructions provided by the Bio-Plex Cell lysis kit (#171304011) with a protease inhibitor cocktail (Sigma-Aldrich, St. Louis, MO, USA), followed by centrifugation at 4 °C for 10 min at 10000×g. The assays were conducted in 96-well polystyrene, round-bottom microplates. Initially, a 50 μL aliquot of the working bead mixture was transferred into the wells, and the plate was washed two times by adding 100 μL of assay buffer into each well. Then, 50 μL of the standard, control, or total extracts were added to each well. The plate was incubated on a plate shaker (850 rpm) in the dark at RT for 60 min. The plate was then placed in the magnetic separator and incubated for separation for 60 s. The supernatant was carefully removed from each well by manual inversion. Beads were then washed three times by adding 100 μL of assay buffer into each well, to ensure the removal of any undesirable or nonspecifically bound antibodies. After this protocol, 25 μL of a detection antibody was added to each well. Incubation was again conducted in the dark and at RT on a plate shaker (850 rpm) for 30 min, and washing was performed as previously described. Finally, 50 μL of streptavidin-PE was added to each well. The plate was incubated on a plate shaker (850 rpm) in the dark at RT for 10 min. After the magnetic separation of the beads, the supernatant was carefully removed by manual inversion, and washing was performed as previously described. Assay buffer (125 μL) was added to each well, and the plate was placed onto a plate shaker for approximately 30 s to achieve gentle agitation of the beads. Samples were run in duplicates using a Bio-Plex system (Bio-Plex 200 Systems, Bio-Rad, Hercules, CA), and data analysis was conducted in Bio-Plex Manager 4.0 using a five-parameter logistic regression model.
Immunofluorescence
The rats were anesthetized with isoflurane and were transcardially perfused with PBS followed by 4% paraformaldehyde to fix the brain. For the immunofluorescence (IF) assay, the brain was fixed in 4% buffered formaldehyde solution and embedded in optimum cutting temperature (OCT). The coronal sections were cut to 8 μm and blocked in 3% BSA and horse serum. After blocking, the sections were incubated overnight with antibodies for IBA-1, unconjugated, rabbit polyclonal with reactivity to human, mouse, cat, and rat (1:1000, Wako, 019-19741) and GFAP, unconjugated, rabbit polyclonal with reactivity to human, mouse, cat, and dog (1:1000, Abcam, ab7260). The next day, after washing three times with PBS, goat anti-rabbit secondary antibody, Alexa Fluor Plus 488 (1:1000, Invitrogen, A13201) and to stain nuclei DAPI were applied for each section. To ensure the labeling in the experiment, we performed the primary antibody controls, secondary antibody controls, and label (endogenous tissue background) controls. The tissue sections were imaged using the confocal laser scanning microscopy platform Leica TCS SP8. We used the ImageJ software to count the number of cells from confocal images (https://imagej.nih.gov/ij/).
ELISA
The assays for caspase-3 (MBS018987), caspase-9 (MBS088765), and cardiolipin (MBS721201) were performed using an ELISA kit as recommended by the manufacturers.
Behavioral assessment
Open-field task
The apparatus was a 40 × 60 cm open field surrounded by 50-cm-high dark gray walls with a front glass wall. Black lines divided the floor of the open field into nine rectangles. Each rat was gently placed in the center of the open field and was allowed to explore the arena for 5 min (training session; on day 9). The number of crossings (i.e., the number of times that the animal crossed the black lines) and rearing movements (exploratory behavior) were measured. Immediately after this task, the animals were returned to their home cages. During the test session, which was performed 24 h after the training session, all rats were subjected to a second open-field task (on day 10). In both sessions, crossings and rearing behaviors were counted for 5 min. A reduction in the number of crossings and rearings across the two sessions was taken as a measure of memory retention [32].
Step-down inhibitory avoidance task
The dimensions of the acrylic box used to test inhibitory avoidance were 50 × 25 × 25 cm (Albarsch, Porto Alegre, Brazil). The floor was made up of parallel stainless steel bars (1-mm diameter) spaced 1 cm apart. A 7-cm-wide, 2.5-cm-high platform was placed on the floor of the box against the left wall. During the training trial (on day 9), animals were placed on the platform, and their latency to step-down on the grid with all four paws was measured. Immediately after stepping down on the grid, the animals received a 0.4-mA, 2.0-s footshock and were then returned to their home cage. Retention or test trial was performed 24 h after training (on day 10). The retention trial was identical to the training trial, except that no footshock was given. The latency time to step-down (maximum, 180 s) was used as a measure of inhibitory avoidance retention [33].
Novel object recognition test
On day 8, after the induction of meningitis, rats were subjected to a novel object recognition (NOR) test. The first day was dedicated to a habituation session. Animals were placed in a NOR chamber in an open field (60 × 40 cm) surrounded by 50-cm-high plexiglass walls and were allowed to explore freely for 5 min. On day 9, rats were exposed to two identical objects for 10 min (acquisition trial). The objects used in this experiment were square wooden cases of the same color. The heights of the objects were comparable, and the objects were heavy enough to ensure that the animals would not displace them. On the following day (day 10), one of the square wooden cases was replaced by a novel object, and the rat was allowed to explore the familiar and novel object in the test box for 5 min (retention trial) [34]. The recognition index was calculated for each animal and was reported as the ratio TB/(TA + TB) (TA = time spent exploring the familiar object, A; TB = time spent exploring the novel object, B).
Statistical analysis
Data from the open-field task groups were compared using paired Student’s t test and analysis of variance followed by Tukey’s post hoc test. Comparisons among groups in the step-down inhibitory avoidance task were performed using a Mann–Whitney U test. Intragroup comparisons were performed using the Wilcoxon signed-rank test. For all the analyses, the results were expressed as the mean ± SEM. The differences between groups were analyzed by unpaired Student’s t tests. The statistically significant results are indicated by *P < 0.05. All statistical analyses were performed using GraphPad Prism 7.0 (GraphPad Software, Inc., La Jolla, CA, USA).
Results
Increased in vivo microglial activation evidenced by elevated [11C]PBR28 uptake
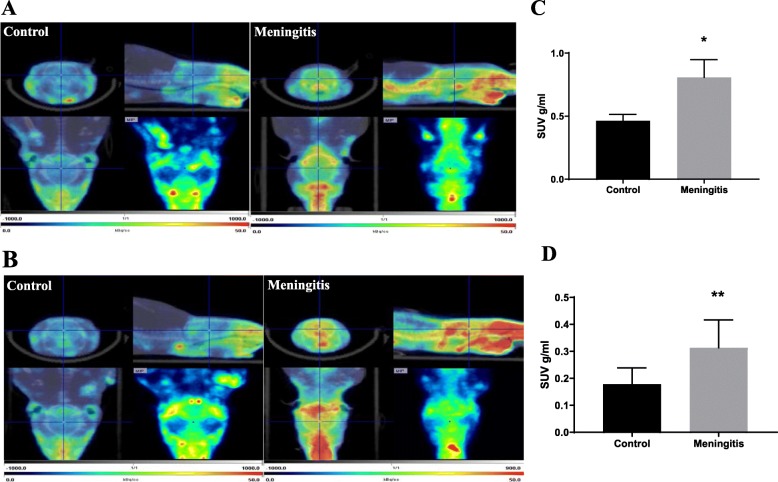
To investigate whether microglia are activated during acute meningitis, animals were subjected to [11C]PBR28, a TSPO-PET tracer that has been widely used for both preclinical and clinical investigations [35, 36]. We subjected both 24-h and 10-day groups to a TSPO-PET scan followed by CT imaging. The SUV was calculated using the following formula: SUV = r/(a'/w), where r is the radioactivity concentration expressed as kBq/ml, which is measured by the PET scanner within a region of interest (ROI); a' is the injected radiolabeled tracer (decay-corrected) expressed as kBq; and w is the weight of the animal. As shown in Fig. 1, the whole brain uptake of [11C]PBR28 was significantly increased in rats, 24 h (P < 0.05) and 10 days (P < 0.01) after the induction of meningitis. The increase in [11C]PBR28 uptake suggests the overexpression of TSPO and increased microglial activation after experimental meningitis. Persistent microglial activation was present, as demonstrated by the increased uptake of the radiotracer even after 10 days when the animals were free from infection.
Fig. 1.
In vivo PET imaging of TSPO using [11C]PBR28. Representative summed images from the dynamic reconstruction of simultaneously acquired PET/CT scans from 10-week-old male Wistar rats subjected to experimental meningitis and controls, 60 min after intravenous injection of [11C]PBR28. The coronal, sagittal, and dorsal orientations of the brain are presented, showing increased brain [11C]PBR28 uptake in the experimental meningitis model than in controls. a Twenty-four hours after experimental meningitis induction. b Ten days after experimental meningitis induction. The SUV scale represents the standardized uptake value (SUV). Quantification of [11C]PBR28 uptake detected in the experimental meningitis model was significantly higher than that in the controls based on measures of brain/muscle. c SUV 24 h after experimental meningitis induction. d SUV 10 days after experimental meningitis induction. The results are expressed as the mean ± SEM for n = 5–8 rats. *P < 0.05, **P < 0.01 compared to controls
Elevated levels of oxidative stress markers observed after experimental meningitis
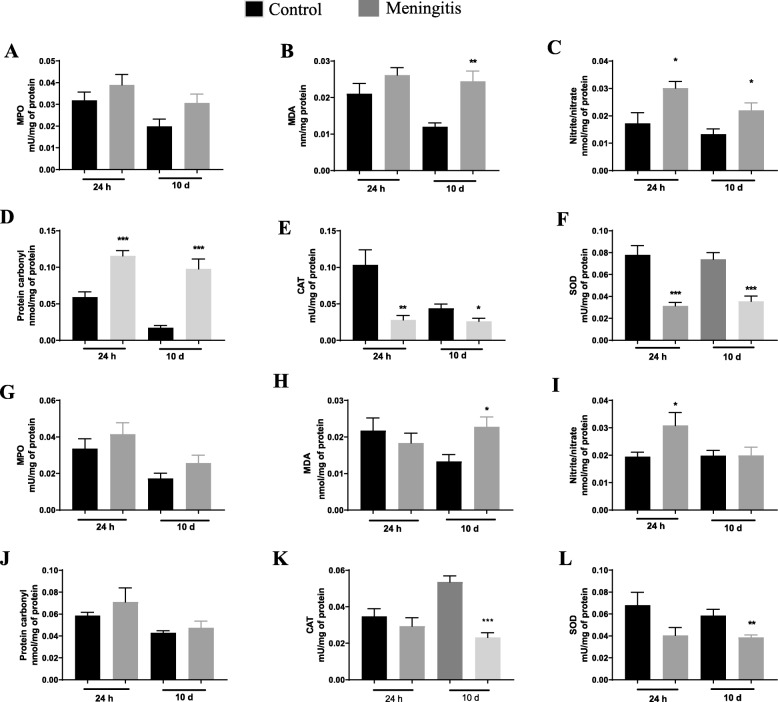
We have previously demonstrated increased levels of oxidative stress parameters in experimental meningitis models induced by E. coli K1, S. agalactiae, and S. pneumoniae [16, 18, 37]. In this study, oxidative damage in the PFC and hippocampus were evaluated in both the 24-h and 10-day groups (Fig. 2). We found no significant changes in MPO activity in both PFC and hippocampus in either the 24-h or10-day groups. However, we observed a significant increase in lipid peroxidation marker, TBARS, levels in the PFC (P < 0.01), and hippocampus (P < 0.05) in the meningitis group compared to the control group. In the PFC, elevated nitrite/nitrate concentrations (P < 0.05 and P < 0.05, respectively) and protein carbonyl levels (P < 0.001 and P < 0.001, respectively) were observed in both 24-h and 10-day groups. In the hippocampus, only the 24-h group demonstrated elevated nitrite/nitrate concentrations (P < 0.05), but no significant change was observed in the 10-day group for either nitrite/nitrate concentrations or protein carbonyl levels. As expected, the experimental meningitis group showed decreased CAT levels in the PFC in both the 24-h (P < 0.01) and 10-day (P < 0.05) groups. Only the 10-day group showed a significant decrease in CAT levels (P < 0.001) in the hippocampus. Levels of another antioxidant enzyme, SOD, were also decreased in the PFC in both the 24-h (P < 0.001) and 10-day (P < 0.001) groups. We also found decreased levels of SOD in the hippocampus of the 10-day (P < 0.01) group animals (Fig. 2). The meningitis group demonstrated a decrease in complex III activity in the hippocampus only in the 24-h group. There was no significant change in complex I, II, and IV activity in either the 24-h or the 10-day group (data not shown).
Fig. 2.
Elevated oxidative stress and reduced enzymatic defense after experimental meningitis. PFC levels of a MPO, b TBARS, c nitrite/nitrate, d protein carbonyl, e CAT, and f SOD in experimental meningitis and control animals 24 h and 10 days after meningitis induction. Hippocampal levels of g MPO, h TBARS, i nitrite/nitrate, j protein carbonyl, k CAT, and l SOD in experimental meningitis and control animals 24 h and 10 days after meningitis induction. The results are expressed as the mean ± SEM for n = 6 rats. *P < 0.05, **P < 0.01, **P < 0.001 compared to controls
Increased levels of inflammatory mediators after experimental meningitis
The first line of defense in response to S. pneumoniae bacterial invasion during meningitis is achieved by the host immune response and the production of inflammatory mediators [38]. Previously, we have reported a kinetic study of cytokine and chemokine release after experimental meningitis [18]. In the current study, 24 h and 10 days after meningitis, the expression of cytokines and chemokines (IL1-α, IL1-β, IL-4, IL-6, IL-7, IL-10, IL-12, IL-13, IL-17, IL-18, TNF-α, and INF-γ) was evaluated using the Multiplex assay (Tables 1 and 2). As expected, in the PFC, we observed increased levels of pro-inflammatory cytokines such as IL1-α, IL1-β, IL-6, IL-17, TNF-α, and INF-γ (P < 0.05) and decreased levels of IL-7, IL-10, and IL-13 (P < 0.05) in the 24-h meningitis group (Table 1). In the hippocampus, we observed increased levels of pro-inflammatory cytokines, such as IL1-α, IL1-β, IL-6, IL-18, TNF-α, and INF-γ (P < 0.05) in the 24-h meningitis group (Table 1). Although the CSF tested negative for organisms (data not shown) 10 days after the infection, the levels of TNF-α (P < 0.05) were still high in the PFC compared to the respective control groups, with a simultaneous decrease in IL-12 and IL-17 (P < 0.05) (Table 2). We also observed increased IL-4 levels (P < 0.05) and decreased IL-17 levels (P < 0.05) in the meningitis rat hippocampus, 10 days after the infection (Table 2).
Table 1.
Increased inflammatory mediator levels 24 h after experimental meningitis induction in the PFC and hippocampus. The results are expressed as the mean ± SEM for n = 5–6 rats
| Cytokines (pg/μg) | PFC—24 h | Hippocampus—24 h | ||
|---|---|---|---|---|
| Control | Meningitis | Control | Meningitis | |
| IL-1a | 0.018 ± 0.001 | 0.711 ± 0.222* | 0.014 ± 0.001 | 0.199 ± 0.020* |
| IL-1β | 0.165 ± 0.009 | 1.569 ± 0.256* | 0.107 ± 0.008 | 0.267 ± 0.027* |
| IL-4 | 0.009 ± 0.001 | 0.007 ± 0.001 | 0.005 ± 0.0004 | 0.005 ± 0.0009 |
| IL-5 | 0.052 ± 0.003 | 0.046 ± 0.009 | 0.034 ± 0.002 | 0.315 ± 0.003 |
| IL-6 | 0.077 ± 0.005 | 0.984 ± 0.030* | 0.059 ± 0.005 | 0.447 ± 0.050* |
| IL-7 | 0.010 ± 0.0007 | 0.007 ± 0.0008* | 0.003 ± 0.0002 | 0.002 ± 0.0008 |
| IL-10 | 0.033 ± 0.004 | 0.019 ± 0.001* | 0.022 ± 0.001 | 0.023 ± 0.001 |
| IL-12 | 0.013 ± 0.001 | 0.006 ± 0.008 | 0.009 ± 0.001 | 0.009 ± 0.0008 |
| IL-13 | 0.027 ± 0.001 | 0.012 ± 0.0008* | 0.012 ± 0.0008 | 0.011 ± 0.001 |
| IL-17 | 0.021 ± 0.002 | 0.041 ± 0.001* | 0.011 ± 0.0002 | 0.014 ± 0.001 |
| IL-18 | 0.037 ± 0.003 | 0.050 ± 0.006 | 0.031 ± 0.002 | 0.043 ± 0.003* |
| TNF-α | 0.054 ± 0.004 | 0.312 ± 0.029* | 0.041 ± 0.005 | 0.059 ± 0.003* |
| INF-γ | 0.021 ± 0.002 | 0.070 ± 0.006* | 0.023 ± 0.002 | 0.069 ± 0.006* |
*P < 0.05 compared to controls
Table 2.
Increased inflammatory mediator levels 10 days after experimental meningitis induction in the PFC and hippocampus. The results are expressed as the mean ± SEM for n = 5–6 rats
| Cytokines (pg/μg) | PFC—10 days | Hippocampus—10 days | ||
|---|---|---|---|---|
| Control | Meningitis | Control | Meningitis | |
| IL-1a | 0.1083 ± 0.012 | 0.133 ± 0.016 | 0.082 ± 0.013 | 0.096 ± 0.014 |
| IL-1β | 0.347 ± 0.029 | 0.316 ± 0.026 | 0.212 ± 0.015 | 0.175 ± 0.009 |
| IL-4 | 0.009 ± 0.001 | 0.006 ± 0.001 | 0.010 ± 0.001 | 0.022 ± 0.002* |
| IL-6 | 0.423 ± 0.048 | 0.480 ± 0.067 | 0.198 ± 0.031 | 0.199 ± 0.025 |
| IL-10 | 0.084 ± 0.006 | 0.110 ± 0.016 | 0.029 ± 0.004 | 0.031 ± 0.004 |
| IL-12 | 0.192 ± 0.022 | 0.085 ± 0.011* | 0.08 ± 0.013 | 0.086 ± 0.009 |
| IL-17 | 0.088 ± 0.008 | 0.043 ± 0.008* | 0.040 ± 0.006 | 0.019 ± 0.003* |
| IL-18 | 0.043 ± 0.004 | 0.039 ± 0.004 | 0.077 ± 0.011 | 0.073 ± 0.004 |
| TNF-α | 0.022 ± 0.001 | 0.032 ± 0.002* | 0.019 ± 0.002 | 0.019 ± 0.001 |
| INF-γ | 0.093 ± 0.007 | 0.101 ± 0.006 | 0.082 ± 0.008 | 0.074 ± 0.004 |
*P < 0.05 compared to controls
Upregulation of glial cell activation after experimental meningitis
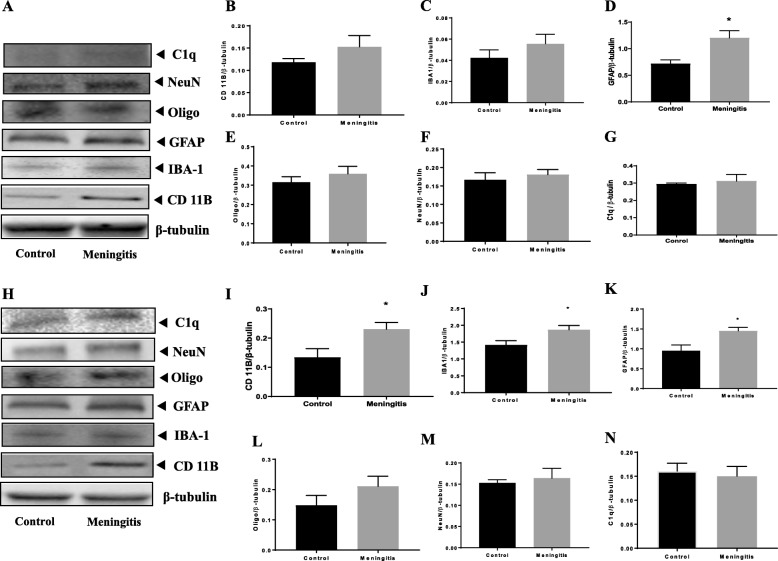
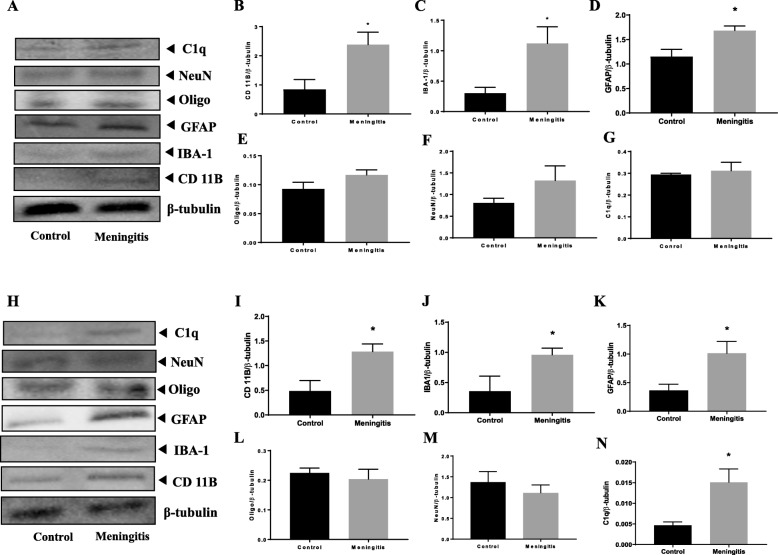
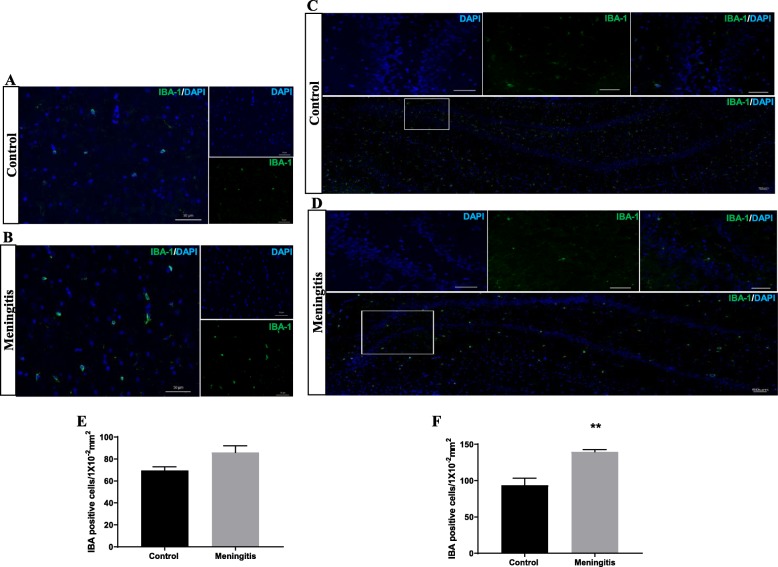
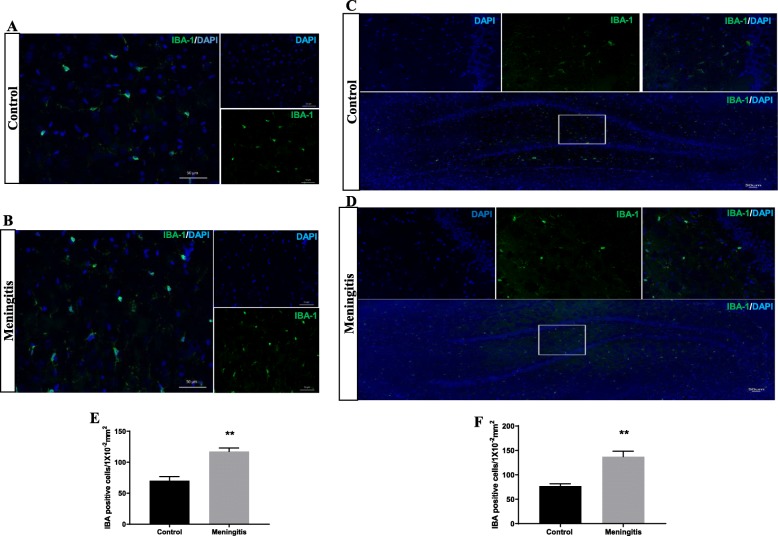
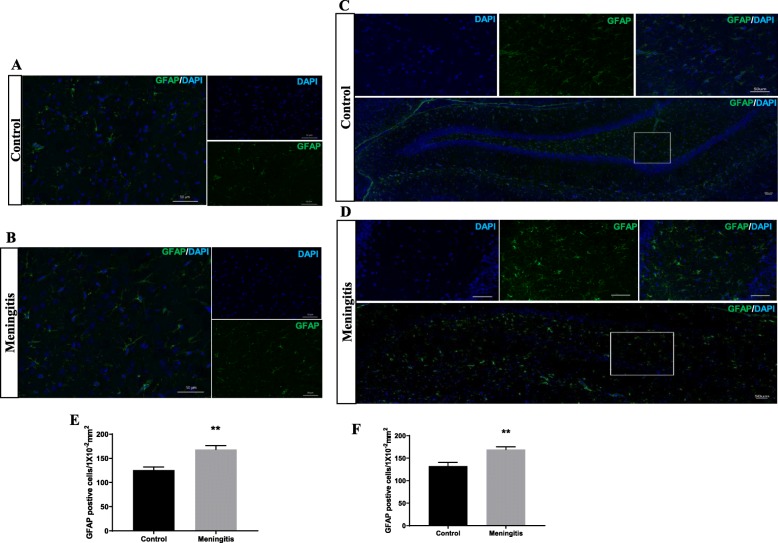
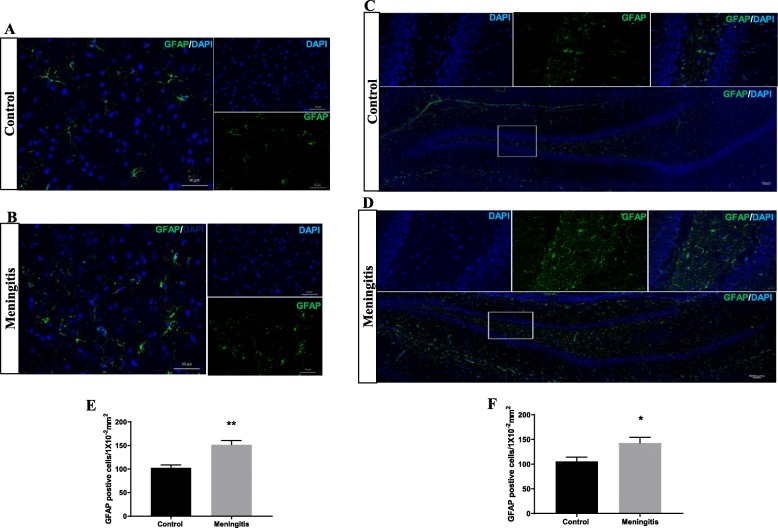
To understand the glial contribution after meningitis, we evaluated the levels of microglial (IBA-1, CD 11B), astrocyte (GFAP), oligodendrocyte (Oligo), and neuronal (NeuN) markers 24 h and 10 days after experimental meningitis induction. In the meningitis group, we observed increased expression of GFAP (P < 0.05), a marker of astrocytes, 24 h after infection, with no significant change in IBA-1, Oligo, and NeuN levels in the PFC (Fig. 3). However, in the hippocampus, we found a significant increase in the expression of microglial markers IBA-1 (P < 0.05) and CD 11B (P < 0.05) and astrocyte marker GFAP (P < 0.05) in the meningitis group after 24 h of infection (Fig. 3). We observed increased expression of IBA-1 (P < 0.05), CD 11B (P < 0.05), and GFAP (P < 0.05) 10 days after infection, with no significant changes in Oligo or NeuN levels in either the PFC or the hippocampus (Fig. 4). We also observed increased expression of C1q, the first subcomponent of the C1 complex in the classical pathway of complement activation, 10 days after meningitis induction (Fig. 4), but no change was observed 24 h after infection (Fig. 3). Furthermore, to confirm glial expression and morphology, we performed IF analysis. The results from IF demonstrated a significant increase in the expression of IBA-1-positive nuclei (P < 0.01) in the hippocampus 24 h after infection (Fig. 5) in the meningitis group. The expression of IBA-1 was increased in both the PFC (P < 0.01) and hippocampus (P < 0.01) in the 10-day meningitis group (Fig. 6). We also observed a significant increase in the expression of GFAP-positive cells in the PFC (P < 0.01) and hippocampus (P < 0.01) of the meningitis group, 24 h after infection, as compared to the levels in the control group (Fig. 7). Interestingly, persistent microglial activation was observed even 10 days after experimental meningitis. Similarly, the expression of GFAP was also elevated in both the PFC (P < 0.01) and hippocampus (P < 0.05) of the 10-day meningitis group compared to the levels of the controls (Fig. 8).
Fig. 3.
Upregulation of glial markers 24 h after experimental meningitis induction in the PFC and hippocampus. Western blot analysis of the tissue protein levels of glial and neuronal markers. Quantification of immunoblot data using the densitometric analysis of each protein was carried out using Image Lab™ software (Bio-Rad, CA, USA). Representative immunoblots and quantification of CD 11B, IBA-1, GFAP, Oligo, NeuN, C1q, and β-tubulin in the PFC (a–g) and hippocampus (h–n). The values for all protein levels were normalized to those of β-tubulin. The results are expressed as the mean ± SEM for n = 4–5 rats. *P < 0.05 compared to controls
Fig. 4.
Upregulation of glial markers 10 days after experimental meningitis induction in the PFC and hippocampus. Western blot analysis of the tissue protein levels of glial and neuronal markers. Quantification of the immunoblot data using the densitometric analysis of each protein was carried out using Image Lab™ software (Bio-Rad, CA, USA). Representative immunoblots and quantification of CD 11B, IBA-1, GFAP, Oligo, NeuN, C1q, and β-tubulin in the PFC (a–g) and hippocampus (h–n). The values for all protein levels were normalized to those of β-tubulin. The results are expressed as the mean ± SEM for n = 4–5 rats. *P < 0.05 compared to controls
Fig. 5.
Increased microglial activation 24 h after experimental meningitis induction. Immunofluorescence analysis for IBA-1-positive cells in experimental meningitis rats and control rats. a, b Representative microscopic field images (magnification, × 400) immunostained with IBA-1 antibodies in the PFC for 24 h. c, d Representative microscopic field images (magnification, × 200) immunostained with IBA-1 antibodies in the hippocampus for 24 h. The number of IBA-1-positive cells/1 × 10−2 mm2 in the e PFC and f hippocampus after 24 h. The results are expressed as the mean ± SEM for n = 4–5 rats. **P < 0.01 compared to controls
Fig. 6.
Increased microglial activation 10 days after experimental meningitis induction. Immunofluorescence analysis for IBA-1-positive cells in experimental meningitis rats and control rats. a, b Representative microscopic field images (magnification, × 400) immunostained with IBA-1 antibodies in the PFC for 24 h. c, d Representative microscopic field images (magnification, × 200) immunostained with IBA-1 antibodies in the hippocampus for 24 h. The number of IBA-1-positive cells/1 × 10−2 mm2 in the e PFC and f hippocampus after 24 h. The results are expressed as the mean ± SEM for n = 4–5 rats. **P < 0.01 compared to controls
Fig. 7.
Increased astroglial activation 24 h after experimental meningitis induction. Immunofluorescence analysis for GFAP-positive cells in experimental meningitis rats and control rats. a, b Representative microscopic field images (magnification, × 400) immunostained with GFAP antibodies in the PFC for 24 h. c, d Representative microscopic field images (magnification, × 200) immunostained with GFAP antibodies in the hippocampus for 24 h. The number of GFAP-positive cells/1 × 10−2 mm2 in the e PFC and f hippocampus after 24 h. The results are expressed as the mean ± SEM for n = 4–5 rats. **P < 0.01 compared to controls
Fig. 8.
Increased astroglial activation 10 days after experimental meningitis induction. Immunofluorescence analysis for GFAP-positive cells in experimental meningitis rats and control rats. a, b Representative microscopic field images (magnification, × 400) from the 10-day group immunostained with GFAP antibodies in the PFC. c, d Representative microscopic field images (magnification, × 200) from the 10-day group immunostained with GFAP in the hippocampus. The number of GFAP-positive cells/1 × 10−2 mm2 in e PFC and f hippocampus in the 10-day group. The results are expressed as the mean ± SEM for n = 4–5 rats. *P < 0.05, **P < 0.01 compared to controls
Upregulation of TSPO expression and mitochondrial dysfunction after experimental meningitis
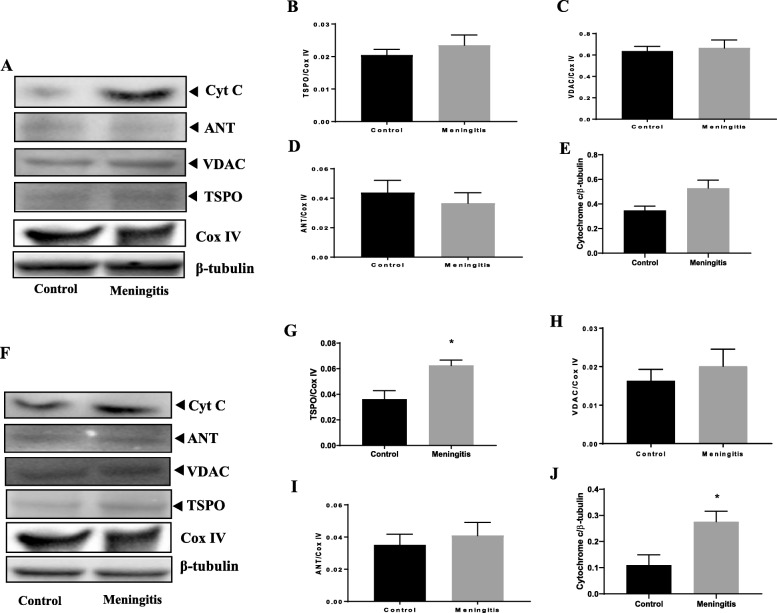
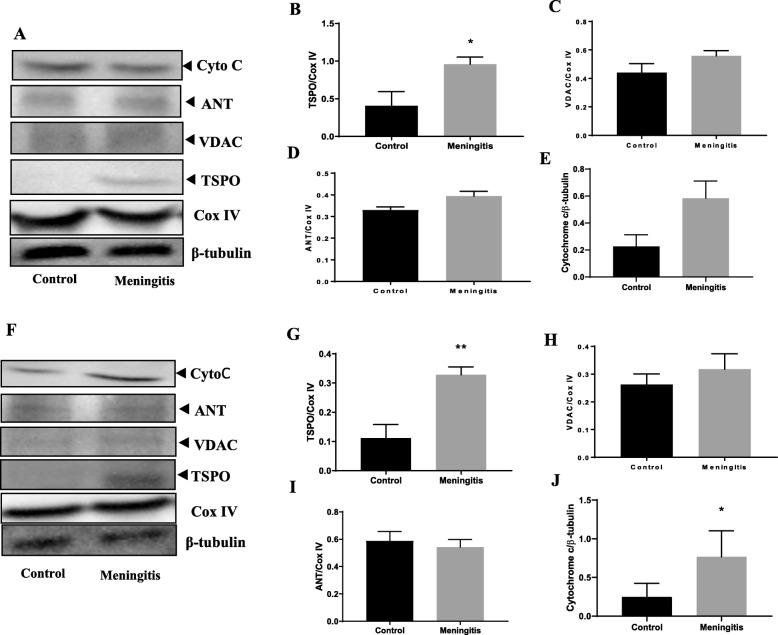
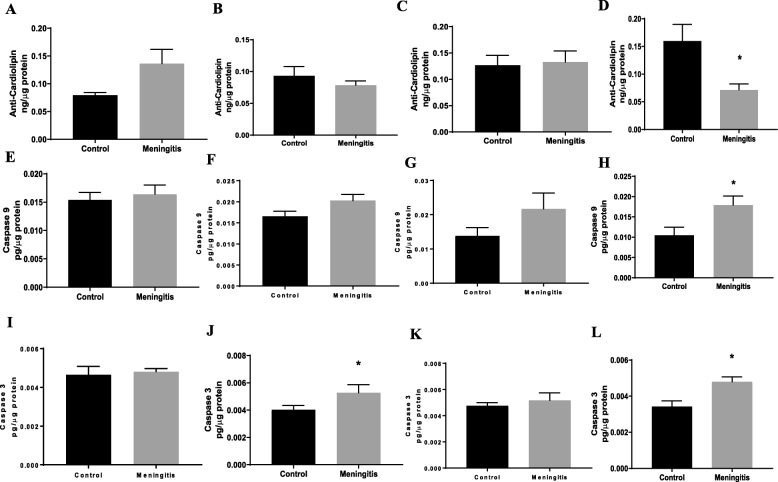
To understand the TSPO-mediated mitochondrial pathway, we measured the protein levels of the outer mitochondrial proteins TSPO and VDAC and inner mitochondrial protein ANT. Additionally, the levels of cytochrome-c, cardiolipin, caspase-3, and caspase-9 were evaluated in both the 24-h and 10-day groups. There was no significant change in the expression of TSPO, VDAC, and ANT at 24 h after meningitis induction, between the control and meningitis groups (Fig. 9). We observed elevated levels of hippocampal TSPO and cytochrome-c expression (P < 0.05) in the meningitis group, 24 h after meningitis induction, with no change in VDAC and ANT expression. Interestingly, the expression levels of TSPO in the meningitis group increased 10 days after infection in both the PFC (P < 0.05) and hippocampus (P < 0.01) (Fig. 10). These results are consistent with TSPO expression and reactive gliosis following CNS injury, in which glial cells upregulate TSPO [39]. In our study, TSPO expression was accompanied by the simultaneous upregulation of cytochrome-c levels (P < 0.05) in the 10-day group, with no significant change in VDAC and ANT levels. As we found an increase in cytochrome-c levels, we also analyzed the levels of cardiolipin using ELISA. We observed decreased hippocampal cardiolipin levels (P < 0.05) 10 days after meningitis infection (Fig. 11). To finish evaluating the mitochondrial pathway, we measured the levels of caspase-3 and caspase-9. Ten days after meningitis induction, the levels of both the cellular markers, caspase-3 and caspase-9, were increased (P < 0.05) in the hippocampus with no significant changes in the 24-h group except caspase-3 which was increased significantly (P < 0.05) in meningitis group hippocampus (Fig. 11).
Fig. 9.
Upregulation of the expression of the neuroimmunomodulatory target TSPO 24 h after experimental meningitis induction in the PFC and hippocampus. Western blot analysis of the tissue protein levels of mitochondrial proteins. Quantification of the immunoblot data using the densitometric analysis of each protein was carried out using Image Lab™ software (Bio-Rad, CA, USA). Representative immunoblots and the quantification of TSPO, VDAC, ANT, cytochrome-c and loading controls, COX IV, and β-tubulin in PFC (a–e) and hippocampus (f–j). The values of all protein levels were normalized to COX IV or β-tubulin levels. The results are expressed as the mean ± SEM for n = 4–5 rats. *P < 0.05 compared to controls
Fig. 10.
Upregulation of the expression of the neuroimmunomodulatory target TSPO 10 days after experimental meningitis induction in the PFC and hippocampus. Western blot analysis of the tissue protein levels of mitochondrial protein. Quantification of the immunoblot data using the densitometric analysis of each protein was carried out using Image Lab™ software (Bio-Rad, CA, USA). Representative immunoblots and the quantification of TSPO, VDAC, ANT, cytochrome-c and loading controls, COX IV, and β-tubulin in PFC (a–e) and hippocampus (f–j). The values of all protein levels were normalized to COX IV or β-tubulin levels. The results are expressed as the mean ± SEM for n = 4–5 rats. *P < 0.05 compared to controls
Fig. 11.
Decreased cardiolipin levels and elevated caspase levels after experimental meningitis. ELISA analysis for tissue protein levels of cardiolipin in experimental meningitis and control rats in the a PFC and b hippocampus 24 h after meningitis induction and in the c PFC and d hippocampus 10 days after induction. ELISA analysis for tissue protein levels of caspase-3 in experimental meningitis rats and control rats in the e PFC and f hippocampus 24 h after meningitis induction and in the g PFC and h hippocampus 10 days after induction. ELISA analysis for tissue protein levels of caspase-9 in experimental meningitis and control rats in the i PFC and j hippocampus 24 h after meningitis induction and in the k PFC and l hippocampus 10 days after induction. The results are expressed as the mean ± SEM for n = 5 rats. *P < 0.05 compared to controls
Cognitive decline assessed in meningitis survivor rats
Open-field test
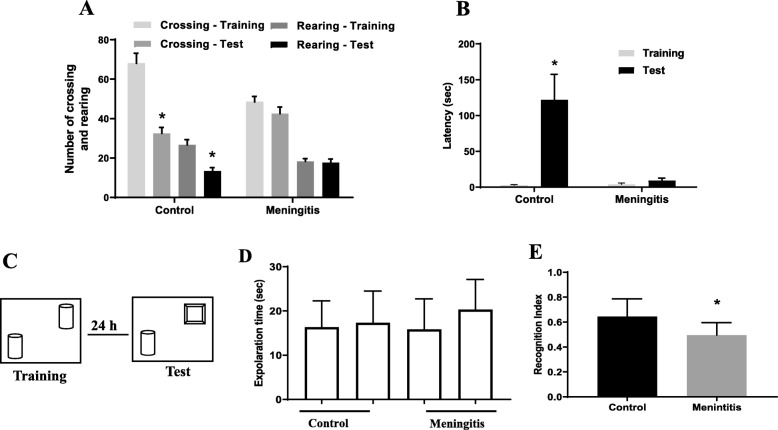
The open-field test is used to evaluate habituation memory in rodents [40]. In the control group, we found significant differences between the training and test sessions, as measured by the number of crossings and rearings (P < 0.05). However, impairment in habituation memory was recognized in meningitis rats, with no difference in behavior between the training and test sessions (Fig. 12a).
Fig. 12.
a Open-field test. b Step-down inhibitory avoidance task. c Schematic representation of the NOR test. d Locomotor activity. e Recognition index. The results are expressed as the mean ± SEM for n = 10 rats. *P < 0.05 compared to controls
Step-down inhibitory avoidance test
Aversive memory in rodents is evaluated by the step-down inhibitory avoidance test [41]. We found no difference in the latency to step-down in seconds between the training and test sessions in the experimental meningitis rats, demonstrating a decline in aversive memory. Conversely, in the control rats, there was a significant increase in the latency time, demonstrating aversive memory retention (P < 0.05; Fig. 12b).
Novel object recognition test
The novel object recognition task tests for recognition of familiar and novel objects and involves recollection and familiarity. The successful retrieval of the contextual details accompanying the learning episode denotes recollection. Familiarity involves identifying the item that was presented earlier [42]. We found that the rats subjected to experimental meningitis spent less time with the novel object. The meningitis group showed a significantly decreased recognition index (P < 0.05) compared to the control group. However, there were no significant differences in locomotor activity between the two groups (Fig. 12c–e).
Discussion
Inflammation, the major immune response of CNS, is mediated by nonneuronal cells, which include the brain sentinels microglia and astrocytes. Although the initial neuroinflammatory response is essential to regulate the brain homeostasis, chronic or maladaptive inflammation leads to detrimental effects [43]. In line with this fact, we tested the experimental meningitis-induced inflammatory response in acute (24 h) and long-term (10 days) conditions. Twenty-four hours after meningitis induction, we observed increased in vivo microglial activation in the meningitis groups by TSPO-PET imaging. The trajectories of inflammation were further evidenced by increases in the levels of inflammatory cytokines, oxidative stress markers, and markers of glial activation in the 24-h group. As stated above, the initial increase in the inflammatory response after meningitis induction is imperative to eliminate the pathogen and to regulate brain equilibrium. However, it was intriguing to note that although the rats in the 10-day meningitis groups were free from infection, an increase in the inflammation was evidenced by a greater SUV of [11C]PBR28 in their whole brains. The subcellular changes that occur in the inflammatory marker TSPO levels upon the activation of microglia are not known. Upon activation, microglia change from a ramified morphology to an amoeboid morphology [44]. Transition to an amoeboid morphology may result in an increase in the mitochondrial population without a change in the amount of TSPO per mitochondrion. One possibility is that increased TSPO levels in activated microglia reflect an increase in the mitochondrial number. An increase in the amount of TSPO per mitochondrion without changes in the number of mitochondria might be the other possibility. Although it is not experimentally confirmed, the number of mitochondria, as well as the amount of TSPO per mitochondria, both likely increase with microglial activation, and these changes may have detrimental effects on the cells [7].
Consistent with our previous report, 10-day meningitis group rats demonstrated significant cognitive impairment in the battery of behavioral tests [17, 21]. The meningitis rats spent less time with novel objects, demonstrating recognition memory loss, as observed in the NOR test. In the step-down inhibitory avoidance task, we found no difference in the latency time between the test and training sessions, demonstrating a cognitive decline in meningitis rats. Furthermore, impairment in habituation memory was evidenced by the open-field task, in the meningitis group. Thus, we hypothesize that persistent microglial activation followed by TSPO-mediated neuroinflammation might play a role in the long-term cognitive decline exhibited in meningitis animals. TSPO is an evolutionarily conserved protein, and its primary function is to transport cholesterol to the inner mitochondrial membrane for the production of steroids. TSPO also plays a role in the regulation of many cellular processes, including inflammatory response, cytokine production, oxidative stress, mitochondrial homeostasis, and cell death [45, 46].
Knowing the role of TSPO in redox homeostasis, it is noteworthy to evaluate oxidative stress after meningitis [47]. We found exaggerated oxidative and nitrative stress markers, such as MDA, protein carbonyl, and nitrite/nitrate levels, in the PFC of the meningitis rats compared to those of the controls. A decrease in enzymatic defense, such as SOD and CAT levels, was observed in both the PFC and hippocampus of the meningitis rats. Srivastava et al. have reported clinical evidence for an increase in MDA, protein carbonyl, and nitrite levels and a decrease in enzymatic defense levels in the plasma and CSF of meningitis patients [48]. We also measured mitochondrial complex I, II, III, and IV activity in the PFC and hippocampus, and in the 24-h group, we found a decrease in complex III activity in the meningitis group compared to that in the control group (data not shown). Activated microglia and astrocytes in the CNS are the primary sources of cytokines during a reactive, inflammatory response [49]. The results from this study demonstrate a storm of inflammatory cytokines, such as IL1-α, IL-1β, IL-6, IL-18, TNF-α, and INF-γ, in the 24-h meningitis group. The persistent activation of microglia leads to increased inflammatory protein TNF-α and IL-4 levels, 10 days after meningitis induction. A recent study by Hennessy et al. has reported that elevated TNF-α levels have robust acute effects on brain function, including depression, delirium, and postoperative cognitive dysfunction [50]. Interestingly, other experimental evidence suggests that elevated IL-4 levels demonstrated hippocampal neuroinflammation and cognitive decline in a mouse model. IL-4 also plays a crucial role in hepatitis B vaccination-induced brain development and cognition [51].
In addition to the evaluation of microglial activation in vivo, we also confirmed the protein markers of glial cells in the PFC and hippocampus using conventional techniques. We found increased expression of microglial markers IBA-1 and CD11B in the meningitis rat hippocampus 10 days after meningitis induction. The strong association between the overexpression of glial proteins and cognitive impairment has been reported in different disease models [52, 53]. Because TSPO overexpression was also detected in reactive astrocytes [54], we determined GFAP protein expression, which was increased in both the 24-h and 10-day meningitis groups. Recently, a report from Clarke et al. revealed that pro-inflammatory microglia secrete IL-1α, TNF, and C1q, and these cytokines are sufficient to activate astrocytes, termed as A1 reactive astrocytes [55]. Furthermore, it was stated that A1-reactive astrocytes fail to perform normal functions and produce complement components that release toxic factors that, in turn, damage neurons and oligodendrocytes, thereby contributing to the cognitive decline in vulnerable brain regions in normal aging [55]. Interestingly, we found elevated TNF and C1q levels in the hippocampal region after 10 days of meningitis induction, suggesting the possibility of A1-reactive astrocytes induction after experimental meningitis. Although we found no difference in oligodendrocyte and neuronal protein expression, the cognitive decline recognized in meningitis survivors may be partially explained by persistent activation of microglia and astrocytes after experimental meningitis.
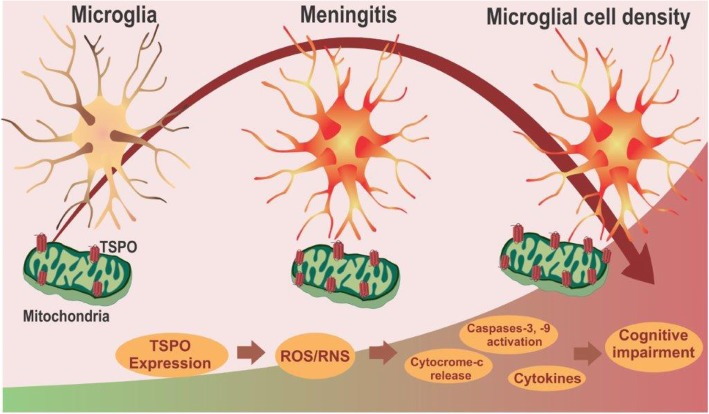
Recent emerging evidence strongly supports the use of TSPO as a neuroimmunomodulatory target to detect neuroinflammation in neurological and psychiatric disorders [56]. However, the role of TSPO in infection-induced inflammatory changes has not yet been explored. In our study, we confirmed the enhanced expression of TSPO in vivo, as well in the PFC and hippocampus of meningitis survivor rats. However, we found no differences in the levels of other mitochondrial proteins, namely, VDAC and ANT, but we documented increased expression of cytochrome-c in the hippocampus of meningitis rats at 10 days. It is important to note that cytochrome-c has been identified as a critical signaling molecule of apoptosis [57]. For the intrinsic apoptotic program, the redistribution of cardiolipin from the inner mitochondrial membrane to the outer mitochondrial membrane and the subsequent accumulation of cardiolipin oxidation products, catalyzed by cytochrome-c, are needed [58]. Oxidized cardiolipin causes the release of pro-apoptotic factors, including cytochrome-c, from mitochondria into the cytosol, which activates the caspases [58]. Cardiolipin content loss also contributes to the age-related phenotype generally associated with mitochondrial dysfunction and oxidative stress [59]. We found a significant increase in cytochrome-c levels 10 days after meningitis induction, with a simultaneous reduction in cardiolipin levels. The increased levels of cytochrome-c activated the caspase pathway by stimulating caspase-3 and caspase-9 levels, which were detected by ELISA. Our results are consistent with earlier reports by Bifrare et al. that confirmed the presence of apoptosis by documenting positive staining for activated, apoptosis-specific caspase-3 in an experimental meningitis model [60]. The current study demonstrated the presence of microglial activation in vivo by [11C]PBR28-PET imaging. Furthermore, the results also demonstrated the upregulation of TSPO, oxidative stress markers, and inflammatory mediator levels not only in the acute context but also in the long-term context (Fig. 13). Thus, in summary, it may be postulated that TSPO-dependent negative regulatory effects may play a role in the cognitive impairment affecting meningitis survivors.
Fig. 13.
Experimental meningitis induced microglial activation. Induction of experimental meningitis increased the microglial activation, which in turn elevated the levels of TSPO expression. Further increase in oxidative and nitrosative stress and the interplay between activated glia-mediated immune responses through the TSPO mechanism underpins the cognitive decline observed in meningitis survivors
Conclusion
Based on our results, we posit that the dynamic interplay between the activated glia-mediated immune responses through the TSPO mechanism underpins the cognitive decline observed in meningitis survivors. Thus, [11C]PBR28-PET could be used as an imaging marker for the longitudinal monitoring of neuroinflammation in meningitis patients affected by progressive, long-term cognitive impairment. The limitations of the TSPO polymorphism can be bypassed by genotyping TSPO rs6971 and excluding individuals with the rare, low-affinity binding genotype. Additionally, these results also open a new avenue to target TSPO ligands in infection-induced long-term cognitive dysfunction.
Acknowledgements
The University of Texas Health Science Center at Houston (UTHealth); University of Southern Santa Catarina (UNESC); National Council for Scientific and Technological Development (CNPq); and Fundação de Amparo à Pesquisa e Inovação de Santa Catarina (FAPESC). This work was supported by grants to TB from Alzheimer’s Association® AARGDNTF-19-619645.
Abbreviations
- ANT
Adenine nucleotide translocator
- BCA
Bicinchoninic acid
- BSA
Bovine serum albumin
- CAT
Catalase
- CFU
Colony-forming units
- CNS
Central nervous system
- CSF
Cerebrospinal fluid
- FOV
Field-of-view
- GFAP
Glial fibrillary acidic protein
- i.c.
Intracisternal
- IBA-1
Ionized calcium-binding adaptor molecule 1
- IL
Interleukin
- INF
Interferon
- MDA
Malondialdehyde
- MLEM
Maximum likelihood expectation maximization
- MPO
Myeloperoxidase
- MPTP
Mitochondrial permeability transition pore
- PBR
Peripheral benzodiazepine receptor
- PET
Positron emission tomography
- PFC
Prefrontal cortex
- PVDF
Polyvinylidenedifluoride
- RT
Room temperature
- SOD
Superoxide dismutase
- SUV
Standard uptake volume
- TBARS
Thiobarbituric acid reactive species
- TNF
Tumor necrosis factor
- TSPO
Translocator protein
- VDAC
Voltage-dependent anion channel
Authors’ contributions
TB and VGV designed the experiments and performed the experiments. VGV analyzed the results. VGV wrote the manuscript. AC and JSG performed the antioxidant assays. GS performed the multiplex assay. RW analyzed immunofluorescence. SS, RH, FD, FP, VG, and TB critically revised the manuscript. All authors read and approved the final manuscript.
Funding
This work was supported by The University of Texas Health Science Center at Houston and grants to TB from Alzheimer’s Association® AARGDNTF-19-619645.
Availability of data and materials
The datasets used and/or analyzed during the current study are available from the corresponding author on reasonable request.
Ethics approval and consent to participate
Not applicable
Consent for publication
Not applicable
Competing interests
SS has obtained intravenous citalopram from Lundbeck UK for research purposes, and he is an investigator for a depression treatment clinical trial for COMPASS Pathways. SS has ownership interests in Flow MedTech, Inc. All the other authors declare that they have no competing interests.
Footnotes
Publisher’s Note
Springer Nature remains neutral with regard to jurisdictional claims in published maps and institutional affiliations.
References
- 1.van de Beek D, Brouwer M, Hasbun R, Koedel U, Whitney CG, Wijdicks E. Community-acquired bacterial meningitis. Nature Reviews Disease Primers. 2016;2:16074. doi: 10.1038/nrdp.2016.74. [DOI] [PubMed] [Google Scholar]
- 2.Brouwer MC, van de Beek D. Epidemiology of community-acquired bacterial meningitis. Current opinion in infectious diseases. 2018;31(1):78–84. doi: 10.1097/qco.0000000000000417. [DOI] [PubMed] [Google Scholar]
- 3.Kamei S (2016) Cognitive impairment in patients with bacterial meningitis and encephalitides. Brain and nerve = Shinkei kenkyu no shinpo 68 (4):317-327. doi:10.11477/mf.1416200400 [DOI] [PubMed]
- 4.Metti AL, Yaffe K, Boudreau RM, Simonsick EM, Carnahan RM, Satterfield S, Harris TB, Ayonayon HN, Rosano C, Cauley JA. Trajectories of inflammatory markers and cognitive decline over 10 years. Neurobiology of aging. 2014;35(12):2785–2790. doi: 10.1016/j.neurobiolaging.2014.05.030. [DOI] [PMC free article] [PubMed] [Google Scholar]
- 5.Butovsky O, Weiner HL. Microglial signatures and their role in health and disease. Nature reviews Neuroscience. 2018;19(10):622–635. doi: 10.1038/s41583-018-0057-5. [DOI] [PMC free article] [PubMed] [Google Scholar]
- 6.Wolf SA, Boddeke HW, Kettenmann H. Microglia in physiology and disease. Annual review of physiology. 2017;79:619–643. doi: 10.1146/annurev-physiol-022516-034406. [DOI] [PubMed] [Google Scholar]
- 7.Venneti S, Lopresti BJ, Wiley CA. The peripheral benzodiazepine receptor (translocator protein 18kDa) in microglia: from pathology to imaging. Progress in neurobiology. 2006;80(6):308–322. doi: 10.1016/j.pneurobio.2006.10.002. [DOI] [PMC free article] [PubMed] [Google Scholar]
- 8.Shen Z, Bao X, Wang R. Clinical PET imaging of microglial activation: implications for microglial therapeutics in Alzheimer’s disease. Frontiers in aging neuroscience. 2018;10:314. doi: 10.3389/fnagi.2018.00314. [DOI] [PMC free article] [PubMed] [Google Scholar]
- 9.Dupont Anne-Claire, Largeau Bérenger, Santiago Ribeiro Maria, Guilloteau Denis, Tronel Claire, Arlicot Nicolas. Translocator Protein-18 kDa (TSPO) Positron Emission Tomography (PET) Imaging and Its Clinical Impact in Neurodegenerative Diseases. International Journal of Molecular Sciences. 2017;18(4):785. doi: 10.3390/ijms18040785. [DOI] [PMC free article] [PubMed] [Google Scholar]
- 10.Di Biase MA, Zalesky A, O'Keefe G, Laskaris L, Baune BT, Weickert CS, Olver J, McGorry PD, Amminger GP, Nelson B, Scott AM, Hickie I, Banati R, Turkheimer F, Yaqub M, Everall IP, Pantelis C, Cropley V. PET imaging of putative microglial activation in individuals at ultra-high risk for psychosis, recently diagnosed and chronically ill with schizophrenia. Translational psychiatry. 2017;7(8):e1225. doi: 10.1038/tp.2017.193. [DOI] [PMC free article] [PubMed] [Google Scholar]
- 11.Setiawan E, Attwells S, Wilson AA, Mizrahi R, Rusjan PM, Miler L, Xu C, Sharma S, Kish S, Houle S, Meyer JH. Association of translocator protein total distribution volume with duration of untreated major depressive disorder: a cross-sectional study. The lancet Psychiatry. 2018;5(4):339–347. doi: 10.1016/s2215-0366(18)30048-8. [DOI] [PubMed] [Google Scholar]
- 12.Beckers L, Ory D, Geric I, Declercq L, Koole M, Kassiou M, Bormans G, Baes M. Increased expression of translocator protein (TSPO) marks pro-inflammatory microglia but does not predict neurodegeneration. Molecular imaging and biology : MIB : the official publication of the Academy of Molecular Imaging. 2018;20(1):94–102. doi: 10.1007/s11307-017-1099-1. [DOI] [PubMed] [Google Scholar]
- 13.Raghavendra Rao VL, Dogan A, Bowen KK, Dempsey RJ. Traumatic brain injury leads to increased expression of peripheral-type benzodiazepine receptors, neuronal death, and activation of astrocytes and microglia in rat thalamus. Experimental neurology. 2000;161(1):102–114. doi: 10.1006/exnr.1999.7269. [DOI] [PubMed] [Google Scholar]
- 14.Barichello T, Simoes LR, Collodel A, Giridharan VV, Dal-Pizzol F, Macedo D, Quevedo J. The translocator protein (18kDa) and its role in neuropsychiatric disorders. Neuroscience and biobehavioral reviews. 2017;83:183–199. doi: 10.1016/j.neubiorev.2017.10.010. [DOI] [PubMed] [Google Scholar]
- 15.Elkamhawy A, Park JE, Hassan AHE, Pae AN, Lee J, Park BG, Paik S, Do J, Park JH, Park KD, Moon B, Park WK, Cho H, Jeong DY, Roh EJ. Design, synthesis, biological evaluation and molecular modelling of 2-(2-aryloxyphenyl)-1,4-dihydroisoquinolin-3(2H)-ones: a novel class of TSPO ligands modulating amyloid-beta-induced mPTP opening. European journal of pharmaceutical sciences : official journal of the European Federation for Pharmaceutical Sciences. 2017;104:366–381. doi: 10.1016/j.ejps.2017.04.015. [DOI] [PubMed] [Google Scholar]
- 16.Giridharan VV, Simoes LR, Dagostin VS, Generoso JS, Rezin GT, Florentino D, Muniz JP, Collodel A, Petronilho F, Quevedo J, Barichello T. Temporal changes of oxidative stress markers in Escherichia coli K1-induced experimental meningitis in a neonatal rat model. Neuroscience letters. 2017;653:288–295. doi: 10.1016/j.neulet.2017.06.002. [DOI] [PubMed] [Google Scholar]
- 17.Barichello T, Simoes LR, Valvassori SS, Generoso JS, Aveline PE, Dominguini D, Elias SG, Vilela MC, Quevedo J, Teixeira AL. Klebsiella pneumoniae meningitis induces memory impairment and increases pro-inflammatory host response in the central nervous system of Wistar rats. Journal of medical microbiology. 2014;63(Pt 1):111–117. doi: 10.1099/jmm.0.063289-0. [DOI] [PubMed] [Google Scholar]
- 18.Barichello T, Lemos JC, Generoso JS, Cipriano AL, Milioli GL, Marcelino DM, Vuolo F, Petronilho F, Dal-Pizzol F, Vilela MC, Teixeira AL. Oxidative stress, cytokine/chemokine and disruption of blood-brain barrier in neonate rats after meningitis by Streptococcus agalactiae. Neurochemical research. 2011;36(10):1922–1930. doi: 10.1007/s11064-011-0514-2. [DOI] [PubMed] [Google Scholar]
- 19.Simoes LR, Abreu R, Generoso JS, Goularte JA, Collodel A, Giridharan VV, Arumanayagam ACS, Valvassori SS, Quevedo J, Barichello T. Prevention of memory impairment and neurotrophic factors increased by lithium in Wistar rats submitted to pneumococcal meningitis model. Mediators of inflammation. 2017;2017:6490652. doi: 10.1155/2017/6490652. [DOI] [PMC free article] [PubMed] [Google Scholar]
- 20.Barichello Tatiana, Generoso Jaqueline S., Simões Lutiana R., Elias Samuel G., Tashiro Michael H., Dominguini Diogo, Comim Clarissa M., Vilela Márcia Carvalho, Teixeira Antonio Lucio, Quevedo João. Inhibition of indoleamine 2,3-dioxygenase prevented cognitive impairment in adult Wistar rats subjected to pneumococcal meningitis. Translational Research. 2013;162(6):390–397. doi: 10.1016/j.trsl.2013.08.001. [DOI] [PubMed] [Google Scholar]
- 21.Barichello T, Goncalves JC, Generoso JS, Milioli GL, Silvestre C, Costa CS, Coelho Jda R, Comim CM, Quevedo J. Attenuation of cognitive impairment by the nonbacteriolytic antibiotic daptomycin in Wistar rats submitted to pneumococcal meningitis. BMC neuroscience. 2013;14:42. doi: 10.1186/1471-2202-14-42. [DOI] [PMC free article] [PubMed] [Google Scholar]
- 22.Toth M, Doorduin J, Haggkvist J, Varrone A, Amini N, Halldin C, Gulyas B. Positron emission tomography studies with [11C]PBR28 in the healthy rodent brain: validating SUV as an outcome measure of neuroinflammation. PloS one. 2015;10(5):e0125917. doi: 10.1371/journal.pone.0125917. [DOI] [PMC free article] [PubMed] [Google Scholar]
- 23.Green LC, Wagner DA, Glogowski J, Skipper PL, Wishnok JS, Tannenbaum SR. Analysis of nitrate, nitrite, and [15 N]nitrate in biological fluids. Analytical biochemistry. 1982;126(1):131–138. doi: 10.1016/0003-2697(82)90118-X. [DOI] [PubMed] [Google Scholar]
- 24.De Young LM, Kheifets JB, Ballaron SJ, Young JM. Edema and cell infiltration in the phorbol ester-treated mouse ear are temporally separate and can be differentially modulated by pharmacologic agents. Agents and actions. 1989;26(3-4):335–341. doi: 10.1007/BF01967298. [DOI] [PubMed] [Google Scholar]
- 25.Draper HH, Hadley M. Malondialdehyde determination as index of lipid peroxidation. Methods in enzymology. 1990;186:421–431. doi: 10.1016/0076-6879(90)86135-I. [DOI] [PubMed] [Google Scholar]
- 26.Levine RL, Garland D, Oliver CN, Amici A, Climent I, Lenz AG, Ahn BW, Shaltiel S, Stadtman ER. Determination of carbonyl content in oxidatively modified proteins. Methods in enzymology. 1990;186:464–478. doi: 10.1016/0076-6879(90)86141-H. [DOI] [PubMed] [Google Scholar]
- 27.Bannister JV, Calabrese L. Assays for superoxide dismutase. Methods of biochemical analysis. 1987;32:279–312. doi: 10.1002/9780470110539.ch5. [DOI] [PubMed] [Google Scholar]
- 28.Aebi H. Catalase in vitro. Methods in enzymology. 1984;105:121–126. doi: 10.1016/S0076-6879(84)05016-3. [DOI] [PubMed] [Google Scholar]
- 29.Lowry OH, Rosebrough NJ, Farr AL, Randall RJ. Protein measurement with the Folin phenol reagent. The Journal of biological chemistry. 1951;193(1):265–275. [PubMed] [Google Scholar]
- 30.Dandekar MP, Luse D, Hoffmann C, Cotton P, Peery T, Ruiz C, Hussey C, Giridharan VV, Soares JC, Quevedo J, Fenoy AJ. Increased dopamine receptor expression and anti-depressant response following deep brain stimulation of the medial forebrain bundle. Journal of affective disorders. 2017;217:80–88. doi: 10.1016/j.jad.2017.03.074. [DOI] [PubMed] [Google Scholar]
- 31.Scaini G, Fries GR, Valvassori SS, Zeni CP, Zunta-Soares G, Berk M, Soares JC, Quevedo J. Perturbations in the apoptotic pathway and mitochondrial network dynamics in peripheral blood mononuclear cells from bipolar disorder patients. Translational psychiatry. 2017;7(5):e1111. doi: 10.1038/tp.2017.83. [DOI] [PMC free article] [PubMed] [Google Scholar]
- 32.Stanford SC. The open field test: reinventing the wheel. Journal of psychopharmacology (Oxford, England) 2007;21(2):134–135. doi: 10.1177/0269881107073199. [DOI] [PubMed] [Google Scholar]
- 33.Bernabeu R, Bevilaqua L, Ardenghi P, Bromberg E, Schmitz P, Bianchin M, Izquierdo I, Medina JH. Involvement of hippocampal cAMP/cAMP-dependent protein kinase signaling pathways in a late memory consolidation phase of aversively motivated learning in rats. Proceedings of the National Academy of Sciences of the United States of America. 1997;94(13):7041–7046. doi: 10.1073/pnas.94.13.7041. [DOI] [PMC free article] [PubMed] [Google Scholar]
- 34.Idris N, Neill J, Grayson B, Bang-Andersen B, Witten LM, Brennum LT, Arnt J. Sertindole improves sub-chronic PCP-induced reversal learning and episodic memory deficits in rodents: involvement of 5-HT(6) and 5-HT (2A) receptor mechanisms. Psychopharmacology. 2010;208(1):23–36. doi: 10.1007/s00213-009-1702-5. [DOI] [PubMed] [Google Scholar]
- 35.Albrecht DS, Granziera C, Hooker JM, Loggia ML. In vivo imaging of human neuroinflammation. ACS chemical neuroscience. 2016;7(4):470–483. doi: 10.1021/acschemneuro.6b00056. [DOI] [PMC free article] [PubMed] [Google Scholar]
- 36.Zurcher NR, Loggia ML, Lawson R, Chonde DB, Izquierdo-Garcia D, Yasek JE, Akeju O, Catana C, Rosen BR, Cudkowicz ME, Hooker JM, Atassi N. Increased in vivo glial activation in patients with amyotrophic lateral sclerosis: assessed with [(11)C]-PBR28. NeuroImage Clinical. 2015;7:409–414. doi: 10.1016/j.nicl.2015.01.009. [DOI] [PMC free article] [PubMed] [Google Scholar]
- 37.Barichello T, Santos AL, Savi GD, Generoso JS, Otaran P, Michelon CM, Steckert AV, Mina F, Comim CM, Dal-Pizzol F, Quevedo J. Antioxidant treatment prevents cognitive impairment and oxidative damage in pneumococcal meningitis survivor rats. Metabolic brain disease. 2012;27(4):587–593. doi: 10.1007/s11011-012-9315-9. [DOI] [PubMed] [Google Scholar]
- 38.Scheld WM, Koedel U, Nathan B, Pfister HW. Pathophysiology of bacterial meningitis: mechanism(s) of neuronal injury. The Journal of infectious diseases. 2002;186(Suppl 2):S225–S233. doi: 10.1086/344939. [DOI] [PubMed] [Google Scholar]
- 39.McNeela AM, Bernick C, Hines RM, Hines DJ. TSPO regulation in reactive gliotic diseases. Journal of neuroscience research. 2018;96(6):978–988. doi: 10.1002/jnr.24212. [DOI] [PubMed] [Google Scholar]
- 40.Haleem DJ, Inam QU, Haleem MA. Effects of clinically relevant doses of methyphenidate on spatial memory, behavioral sensitization and open field habituation: a time related study. Behavioural brain research. 2015;281:208–214. doi: 10.1016/j.bbr.2014.12.031. [DOI] [PubMed] [Google Scholar]
- 41.Borba Filho GL, Zenki KC, Kalinine E, Baggio S, Pettenuzzo L, Zimmer ER, Weis SN, Calcagnotto ME, Onofre de Souza D. A new device for step-down inhibitory avoidance task--effects of low and high frequency in a novel device for passive inhibitory avoidance task that avoids bioimpedance variations. PloS one. 2015;10(2):e0116000. doi: 10.1371/journal.pone.0116000. [DOI] [PMC free article] [PubMed] [Google Scholar]
- 42.Squire LR, Wixted JT, Clark RE. Recognition memory and the medial temporal lobe: a new perspective. Nature reviews Neuroscience. 2007;8(11):872–883. doi: 10.1038/nrn2154. [DOI] [PMC free article] [PubMed] [Google Scholar]
- 43.Li Q, Barres BA. Microglia and macrophages in brain homeostasis and disease. Nature Reviews Immunology. 2017;18:225. doi: 10.1038/nri.2017.125. [DOI] [PubMed] [Google Scholar]
- 44.Kreutzberg GW. Microglia: a sensor for pathological events in the CNS. Trends in neurosciences. 1996;19(8):312–318. doi: 10.1016/0166-2236(96)10049-7. [DOI] [PubMed] [Google Scholar]
- 45.Sandiego CM, Gallezot JD, Pittman B, Nabulsi N, Lim K, Lin SF, Matuskey D, Lee JY, O'Connor KC, Huang Y, Carson RE, Hannestad J, Cosgrove KP. Imaging robust microglial activation after lipopolysaccharide administration in humans with PET. Proceedings of the National Academy of Sciences of the United States of America. 2015;112(40):12468–12473. doi: 10.1073/pnas.1511003112. [DOI] [PMC free article] [PubMed] [Google Scholar]
- 46.Bonsack Frederick, Sukumari-Ramesh Sangeetha. TSPO: An Evolutionarily Conserved Protein with Elusive Functions. International Journal of Molecular Sciences. 2018;19(6):1694. doi: 10.3390/ijms19061694. [DOI] [PMC free article] [PubMed] [Google Scholar]
- 47.Batoko H, Veljanovski V, Jurkiewicz P. Enigmatic translocator protein (TSPO) and cellular stress regulation. Trends in biochemical sciences. 2015;40(9):497–503. doi: 10.1016/j.tibs.2015.07.001. [DOI] [PubMed] [Google Scholar]
- 48.Srivastava R, Lohokare R, Prasad R. Oxidative stress in children with bacterial meningitis. Journal of tropical pediatrics. 2013;59(4):305–308. doi: 10.1093/tropej/fmt013. [DOI] [PubMed] [Google Scholar]
- 49.Coughlin JM, Wang Y, Ambinder EB, Ward RE, Minn I, Vranesic M, Kim PK, Ford CN, Higgs C, Hayes LN, Schretlen DJ, Dannals RF, Kassiou M, Sawa A, Pomper MG. In vivo markers of inflammatory response in recent-onset schizophrenia: a combined study using [(11)C]DPA-713 PET and analysis of CSF and plasma. Translational psychiatry. 2016;6:e777. doi: 10.1038/tp.2016.40. [DOI] [PMC free article] [PubMed] [Google Scholar]
- 50.Hennessy E, Gormley S, Lopez-Rodriguez AB, Murray C, Murray C, Cunningham C. Systemic TNF-alpha produces acute cognitive dysfunction and exaggerated sickness behavior when superimposed upon progressive neurodegeneration. Brain, behavior, and immunity. 2017;59:233–244. doi: 10.1016/j.bbi.2016.09.011. [DOI] [PMC free article] [PubMed] [Google Scholar]
- 51.Wang X, Yang J, Xing Z, Zhang H, Wen Y, Qi F, Zuo Z, Xu J, Yao Z. IL-4 mediates the delayed neurobehavioral impairments induced by neonatal hepatitis B vaccination that involves the down-regulation of the IL-4 receptor in the hippocampus. Cytokine. 2018;110:137–149. doi: 10.1016/j.cyto.2018.04.037. [DOI] [PubMed] [Google Scholar]
- 52.Skovira JW, Wu J, Matyas JJ, Kumar A, Hanscom M, Kabadi SV, Fang R, Faden AI. Cell cycle inhibition reduces inflammatory responses, neuronal loss, and cognitive deficits induced by hypobaria exposure following traumatic brain injury. Journal of neuroinflammation. 2016;13(1):299. doi: 10.1186/s12974-016-0769-2. [DOI] [PMC free article] [PubMed] [Google Scholar]
- 53.Flannery BM, Bruun DA, Rowland DJ, Banks CN, Austin AT, Kukis DL, Li Y, Ford BD, Tancredi DJ, Silverman JL, Cherry SR, Lein PJ. Persistent neuroinflammation and cognitive impairment in a rat model of acute diisopropylfluorophosphate intoxication. Journal of neuroinflammation. 2016;13(1):267. doi: 10.1186/s12974-016-0744-y. [DOI] [PMC free article] [PubMed] [Google Scholar]
- 54.Lavisse S, Guillermier M, Herard AS, Petit F, Delahaye M, Van Camp N, Ben Haim L, Lebon V, Remy P, Dolle F, Delzescaux T, Bonvento G, Hantraye P, Escartin C. Reactive astrocytes overexpress TSPO and are detected by TSPO positron emission tomography imaging. The Journal of neuroscience : the official journal of the Society for Neuroscience. 2012;32(32):10809–10818. doi: 10.1523/jneurosci.1487-12.2012. [DOI] [PMC free article] [PubMed] [Google Scholar]
- 55.Clarke LE, Liddelow SA, Chakraborty C, Munch AE, Heiman M, Barres BA. Normal aging induces A1-like astrocyte reactivity. Proceedings of the National Academy of Sciences of the United States of America. 2018;115(8):E1896–e1905. doi: 10.1073/pnas.1800165115. [DOI] [PMC free article] [PubMed] [Google Scholar]
- 56.Rupprecht R, Papadopoulos V, Rammes G, Baghai TC, Fan J, Akula N, Groyer G, Adams D, Schumacher M. Translocator protein (18 kDa) (TSPO) as a therapeutic target for neurological and psychiatric disorders. Nature reviews Drug discovery. 2010;9(12):971–988. doi: 10.1038/nrd3295. [DOI] [PubMed] [Google Scholar]
- 57.Cai J, Yang J, Jones DP. Mitochondrial control of apoptosis: the role of cytochrome c. Biochimica et biophysica acta. 1998;1366(1-2):139–149. doi: 10.1016/S0005-2728(98)00109-1. [DOI] [PubMed] [Google Scholar]
- 58.Ji J, Kline AE, Amoscato A, Samhan-Arias AK, Sparvero LJ, Tyurin VA, Tyurina YY, Fink B, Manole MD, Puccio AM, Okonkwo DO, Cheng JP, Alexander H, Clark RS, Kochanek PM, Wipf P, Kagan VE, Bayir H. Lipidomics identifies cardiolipin oxidation as a mitochondrial target for redox therapy of brain injury. Nature neuroscience. 2012;15(10):1407–1413. doi: 10.1038/nn.3195. [DOI] [PMC free article] [PubMed] [Google Scholar]
- 59.Paradies G, Petrosillo G, Ruggiero FM. Cardiolipin-dependent decrease of cytochrome c oxidase activity in heart mitochondria from hypothyroid rats. Biochimica et biophysica acta. 1997;1319(1):5–8. doi: 10.1016/S0005-2728(97)00012-1. [DOI] [PubMed] [Google Scholar]
- 60.Bifrare YD, Gianinazzi C, Imboden H, Leib SL, Tauber MG. Bacterial meningitis causes two distinct forms of cellular damage in the hippocampal dentate gyrus in infant rats. Hippocampus. 2003;13(4):481–488. doi: 10.1002/hipo.10142. [DOI] [PubMed] [Google Scholar]
Associated Data
This section collects any data citations, data availability statements, or supplementary materials included in this article.
Data Availability Statement
The datasets used and/or analyzed during the current study are available from the corresponding author on reasonable request.


