Abstract
According to cancer genome sequences, more than 90% of cases of pancreatic ductal adenocarcinoma (PDAC) harbor active KRAS mutations. Digital PCR (dPCR) enables accurate detection and quantification of rare mutations. We assessed the dynamics of circulating tumor DNA (ct‐DNA) in patients with advanced PDAC undergoing chemotherapy using dPCR. KRAS G12/13 mutation was assayed by dPCR in 47 paired tissue‐ and ct‐DNA samples. The 21 patients were subjected to quantitative ct‐DNA monitoring at 4 to 8‐week intervals during chemotherapy. KRAS mutation was detected in 45 of those 47 patients using tissue DNA. In the KRAS mutation‐negative cases, next‐generation sequencing revealed KRAS Q61K and NRAS Q61R mutations. KRAS mutation was detected in 23/45 cases using ct‐DNA (liver or lung metastasis, 18/19; mutation allele frequency [MAF], 0.1%‐31.7%; peritoneal metastasis, 3/9 [0.1%], locally advanced, 2/17 [0.1%‐0.2%]). In the ct‐DNA monitoring, the MAF value changed in concordance with the disease state. In the 6 locally advanced cases, KRAS mutation appeared concurrently with liver metastasis. Among the 6 cases with liver metastasis, KRAS mutation disappeared during the duration of stable disease or a partial response, and reappeared at the time of progressive disease. The median progression‐free survival was longer in cases in which KRAS mutation disappeared after an initial course of chemotherapy than in those in which it was continuously detected (248.5 vs 50 days, P < .001). Therefore, ct‐DNA monitoring enables continuous assessment of disease state and could have prognostic utility during chemotherapy.
Keywords: biomarker, circulating tumor DNA, digital PCR, KRAS, pancreatic ductal adenocarcinoma
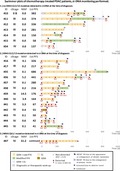
Swimmer plots clearly showing the dynamics of circulating tumor DNA undergoing chemotherapy.
1. INTRODUCTION
Pancreatic ductal adenocarcinoma (PDAC) has a high mortality rate and its incidence is increasing.1 Both early clinical diagnosis and confirmatory pathological diagnosis of PDAC are problematic. Several diagnostic techniques for PDAC have been developed. Among them, endoscopic ultrasound‐guided fine‐needle aspiration (EUS‐FNA) has dramatically improved the sensitivity and accuracy of PDAC diagnosis.2 However, pathological diagnosis is hampered by the small specimen and low purity of tumor cells. Indeed, differential diagnosis of pancreatic solid masses by EUS‐FNA is challenging in approximately 15% of cases.3, 4
Activating KRAS mutations were found in more than 90% cases of PDAC and accumulated on codons 12 and 13 (Figure S1).5, 6, 7, 8 These activating KRAS mutations are reported to impair intrinsic GTPase activity and block the interaction between KRAS and GTPase‐activating proteins, leading to constitutive activation of oncogenic signaling pathways and induction of proliferation, metabolism, and metastasis.9 Furthermore, almost all PDACs develop in a pancreatic intraepithelial neoplasia (PanIN)‐dependent manner and activating KRAS mutations are found in low‐grade PanIN 1A lesions.10, 11 To improve the diagnostic accuracy of PDAC, several prior studies tested for KRAS mutations using EUS‐FNA samples such as Sanger sequencing (sensitivity, ~10%), real time‐quantitative PCR (~1%), amplification‐refractory mutation system (~1%), mutant enriched PCR (~0.1%),3, 12, 13, 14 and next‐generation sequencing (NGS; ~1‐5%).15, 16, 17, 18
Detection of KRAS mutations using EUS‐FNA samples is useful for initial diagnosis. However, it is not always repeatable and is a specific technique. Tumor‐derived DNA circulates in the blood.19 A KRAS mutation at codon 12 and 13, which is harbored by the majority of PDACs, could be a surrogate marker for circulating tumor DNA (ct‐DNA). Furthermore, the amount of ct‐DNA likely reflects the total tumor volume (primary and metastatic lesions), so quantitative monitoring of ct‐DNA could facilitate continuous evaluation of the treatment response and early detection of resistance to chemotherapy, and so improve the clinical outcomes.20
Digital PCR (dPCR), which is efficient and accurate, is based on the compartmentalization of DNA samples into 20 000‐30 000 microdroplets, microchambers, or microwells. This enables amplification, detection, and quantification of rare mutations. Digital PCR allows genetic testing using a small amount of ct‐DNA for the diagnosis and treatment of cancer.21
We assessed the dynamics of ct‐DNA in patients with advanced PDAC undergoing chemotherapy using dPCR and evaluated the utility of ct‐DNA monitoring.
2. MATERIALS AND METHODS
2.1. Subjects and samples
A total of 54 EUS‐FNA tissue samples were collected from patients with a pancreatic tumor who underwent EUS‐FNA due to suspicion of PDAC based on imaging findings (computed tomography [CT] or MRI). The final pathological diagnoses were 47 cases of PDAC and 7 of neuroendocrine tumor (NET). Serum samples were collected from 47 patients with PDAC (female, N = 19; male, N = 28; age, 66 [27‐78] years). The baseline characteristics of the 47 patients with PDAC are shown in Table 1 and Table S1. Among them, from 21 subjects (female, N = 7; male, N = 14; age, 64 [27‐78] years), serum samples were collected every 4‐8 weeks following chemotherapy. Blood samples were obtained by venous puncture and were assayed for the levels of tumor markers (carcinoembryonic antigen [CEA] and carbohydrate antigen 19‐9 [CA19‐9]). The tumor response to chemotherapy was evaluated by imaging according to the RECIST 1.1 criteria.
Table 1.
Baseline characteristics of 47 patients with pancreatic ductal adenocarcinoma
| Total | Locally advanced | Peritoneal metastasis | Liver or lung metastasis | |
|---|---|---|---|---|
| N | 47 | 17 | 9 | 21 |
| Gender; female, male | 19, 28 | 8, 9 | 4, 5 | 7, 14 |
| Age, years; average | 66 | 69 | 70 | 63 |
| (range) | (27‐78) | (57‐77) | (56‐77) | (27‐78) |
| Stage | 4, 3, 10, 30 | 4, 3, 10 | 9 | 21 |
| (UICC 7th) | (ⅡA, ⅡB, Ⅲ, Ⅳ) | (ⅡA, ⅡB, Ⅲ) | (Ⅳ) | (Ⅳ) |
| Location; H, B, T | 28, 9, 10 | 15, 2, 0 | 5, 1, 3 | 8, 6, 7 |
| CEA, ng/mL; average ± SD | 33.4 ± 98.8 | 6.5 ± 9.3 | 15.8 ± 26.7 | 62.7 ± 141.0 |
| CEA > 5 ng/mL | 26 | 7 | 4 | 15 |
| CA19‐9, U/mL; average ± SD | 12 769.2 ± 57 044.1 | 1232.3 ± 3336.8 | 5255.7 ± 7834.4 | 25 328.8 ± 83 413.6 |
| CA19‐9 > 37 U/mL | 41 | 14 | 9 | 18 |
Abbreviations: B, body; CA19‐9, carbohydrate antigen 19‐9; CEA, carcinoembryonic antigen; H, head; T, tail.
The subjects were prospectively recruited at Yokohama City University Hospital and Yokohama City University Medical Center. This prospective multicenter cohort study was approved by the Regional Committee for Medical and Health Research Ethics of Yokohama City University, and all patients provided informed consent prior to EUS‐FNA and chemotherapy.
2.2. Preparation of DNA from tissue and serum samples
The EUS‐FNA tissues were obtained using a 22‐gauge needle. Tissue samples were collected during biopsy for the purpose of histopathological diagnosis and were stored at −80°C in 1 mL RNAlater (#AM7021; Thermo Fisher Scientific). DNA was extracted using a QIAamp DNA Mini Kit (#51304; Qiagen) according to the manufacturer’s instructions. Blood samples were collected in tubes containing a clot activator and polyolefin gel (Venoject II, VP‐AS109K50; Terumo), which is usually used for clinical blood chemistry testing. The blood samples were left to stand for 30 minutes and centrifuged for 10 minutes at 1760 g. The supernatant was collected and stored at −80°C. Before ct‐DNA isolation, the samples were dissolved on ice and centrifuged for 10 minutes at 22 140 g. The supernatant was collected carefully, and 2‐3 mL was used for extraction of ct‐DNA using a QIAamp Circulating Nucleic Acid Kit (#55114, Qiagen) according to the manufacturer’s instructions. The DNA concentration was assayed using the Qubit dsDNA HS Kit and a Qubit 3.0 fluorometer (#Q33231; Thermo Fisher Scientific).
2.3. Detection of mutations by dPCR
To detect KRAS mutation by dPCR in tissue‐ or ct‐DNA samples, we used the LBx Probe for KRAS G12/13 (A183; Riken Genesis), which can detect 16 KRAS mutation patterns (p.G12A/C/D/F/G/L/R/S/V, p.G13A/C/D/G/R/S/V). In a case with WT KRAS and NRAS Q61R mutation revealed by NGS analysis, we used the LBx Probe for NRAS Q61 (A096; Riken Genesis), which can detect seven NRAS mutation patterns (p.Q61R/K/L/H/P/E, p.E62K). Digital PCR was carried out according to the manufacturer’s instructions using 20 ng tissue DNA or more than 10 ng of ct‐DNA and the QX200 instrument (Bio‐Rad); the data were analyzed using Quanta Soft software (Bio‐Rad). We calculated the mutation allele frequency (MAF) value, the ratio of the number of FAM‐negative and HEX‐positive droplets (indicating mutated KRAS G12/13) to the total number of FAM‐ and/or HEX‐positive droplets (no mutated or mutated KRAS G12/13) (Figure 1A).
Figure 1.
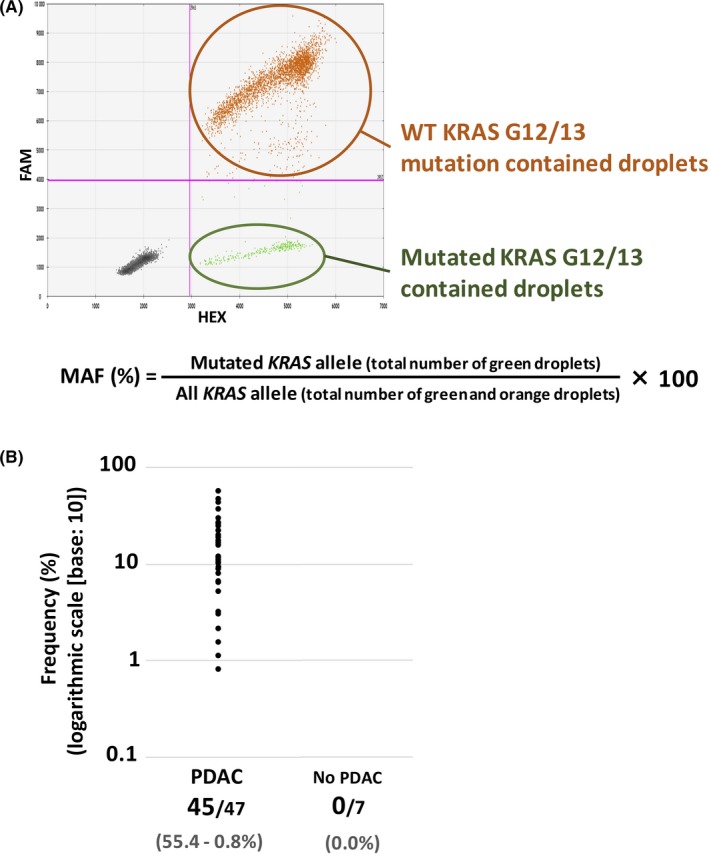
A, A typical case of KRAS G12/13 mutation detected by digital PCR (dPCR). FAM‐ and HEX‐positive droplets (orange) indicate WT KRAS codon 12/13 DNA fraction; FAM‐negative, HEX‐positive (green) droplets indicate mutated KRAS codon G12/13 DNA fraction. B, Detection of mutated KRAS G12/13 by dPCR in 54 tissue DNA samples (pancreatic ductal adenocarcinoma [PDAC], 47; neuroendocrine tumor [NET], 7). KRAS mutation was detected in 45/47 PDAC samples (mutation allele frequency [MAF], 55.4%‐0.8%), whereas no KRAS mutation was detected in non‐PDAC samples
To validate the dPCR data, DNA extracted from human 293T and MIA PaCa‐2 cells was used. The Cancer Cell Line Encyclopedia22 (Wellcome Trust, https://portals.broadinstitute.org/ccle) database showed that 293T cells have WT KRAS, whereas MIA PaCa‐2 cells are homozygous for KRAS G12C.23 DNA was extracted using a QIAamp DNA Mini Kit (#51304; Qiagen) according to the manufacturer’s instructions. A dPCR KRAS copy number variation (CNV) assay was carried out using Prime PCR probes for KRAS and RPP30 (#10031240, #10031244; Bio‐Rad); the latter was used as a reference and is present at 2 copies per diploid genome. The ratio of KRAS to RPP30, which indicates CNV of KRAS, was almost equal to 1 in both cell types (data not shown). Next, we adjusted the DNA concentration of MIA PaCa‐2 cells by adding that of 293T (Table S2) and detected KRAS mutations by dPCR using the LBx Probe. This dPCR mutation detection assay can detect as little as 0.1% mutant allele in a WT allele background, and the MAF value was correlated with that estimated by dilution. Therefore, we defined the lower limit of detection as 0.1%, and samples with MAF values higher than 0.1% were considered positive for KRAS mutation (Table S2).
2.4. Next‐generation sequencing analysis
In the 2 cases of PDAC in which no KRAS G12/13 mutation was detected by dPCR, NGS was carried out using the Ion Ampli‐seq Cancer Hotspot Panel version 2 (CHPv2) (#20019161; Illumina) and the iSeq100 system (Illumina). The data were analyzed using BaseSpace Sequence Hub software (Illumina) and compared with normal DNA from PBMCs.
2.5. Statistical analysis
Progression‐free survival (PFS) was defined as the time from the start of chemotherapy to that of the first event (evaluated as progressive disease [PD] according to RECIST 1.1 criteria). Patients who did not progress during the follow‐up period were censored. Progression‐free survival was evaluated using the Kaplan‐Meier method and was compared by log‐rank test and presented as hazard ratios and 95% confidence intervals. The Kruskal‐Wallis test was used to compare KRAS‐MAF across the 3 disease stage groups (locally advanced, peritoneal metastasis, and liver or lung metastasis). Changes in KRAS‐MAF and tumor marker (CEA and CA19‐9) levels over time were compared by Wilcoxon matched‐pairs signed‐rank test. Correlation tests were carried out between the change of KRAS‐MAF and tumor marker levels by the nonparametric Spearman’s rank correlation coefficient test. A 2‐sided P value of less than 0.05 was considered indicative of statistical significance. Statistical analysis was undertaken using Prism 7 (GraphPad Software).
3. RESULTS
3.1. Detection of KRAS mutations by dPCR and NGS analysis in tissue DNA samples
We evaluated KRAS mutations in EUS‐FNA tissue DNA samples by dPCR. KRAS mutation was detected in 45/47 cases of PDAC and 0/7 cases of NET, pathologically diagnosed (Figure 1B). In the 2 cases of no KRAS G12/13 mutation detected PDAC, NGS analysis confirmed no KRAS G12/13 mutation and revealed 1 case harbored KRAS Q61K (MAF, 38%) and TP53 R213Ter (84%) (Table 2; Table S1, patient [Pat.] #46), and the other harbored NRAS Q61R (52%) (Table 2; Table S1, Pat. #47). The disease history and findings of Pat. #47 are described below (representative case 3).
Table 2.
Somatic mutations identified by next‐generation sequencing analysis in 2 cases of pancreatic ductal adenocarcinoma without KRAS G12/13 mutation detected in digital PCR analysis
| Gene | Mutation | MAF | Clin Var |
|---|---|---|---|
| #46 | |||
| KRAS | p.Q61K | 38% | Pathogenic |
| TP53 | p.R213Ter | 84% | Pathogenic |
| #47 | |||
| NRAS | p.Q61R | 52% | Pathogenic |
Clin Var, Wellcome trust database provided by NCBI (https://www.ncbi.nlm.nih.gov/clinvar/); MAF, mutation allele frequency.
3.2. Detection of KRAS mutation by dPCR in ct‐DNA samples
The KRAS G12/13 mutation detection by dPCR was carried out on ct‐DNA samples extracted from the serum of 45 PDAC patients with KRAS G12/13 mutation, detected in tissue DNA analysis. A preliminary validation study revealed that the lower limit of detection was 0.1% (Table S2), and so samples with a MAF value greater than 0.1% were considered positive for KRAS mutation. KRAS mutation was detected in 2/17 cases of local progression (MAF, 0.1%‐0.2%), 3/9 cases of peritoneal metastasis (MAF, 0.1%), and 18/19 cases of liver or lung metastasis (MAF, 0.1%‐31.7%) (Figure 2). The patients with liver or lung metastasis had higher MAF than those with locally advanced or peritoneal metastatic disease (P < .001).
Figure 2.
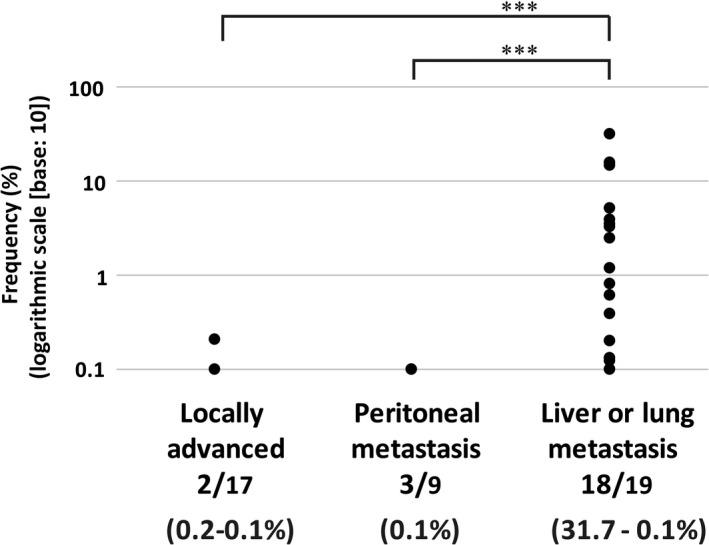
Detection of KRAS G12/13 mutation by digital PCR in circulating tumor DNA samples at the time of diagnosis. KRAS mutation was detected in 2/17 locally advanced cases (mutation allele frequency [MAF], 0.1%‐0.2%), 3/9 peritoneal metastasis cases (MAF, 0.1%), and 18/19 liver or lung metastasis cases (MAF, 31.7%‐0.1%). Those patients with liver or lung metastasis had higher MAF than patients with locally advanced or peritoneal metastatic disease, by Kruskal‐Wallis test (***P < .001)
3.3. Association of baseline tumor marker levels or KRAS mutation detection in ct‐DNA with outcomes
Among the 45 PDAC patients with KRAS G12/13 mutation, 31 underwent chemotherapy. The patients with baseline of tumor markers equal to or above the median value (CEA, 5.6 mg/mL; CA19‐9, 623.0 U/mL) tended to have a worse PFS than those with baseline below the median value (CEA, median 244 vs 195 days, P = .20; CA19‐9, median 281 vs 169 days, P = .10) (Figure 3A,B). Also, the patients with KRAS mutation detected in ct‐DNA at the time of diagnosis (N = 19) tended to have a worse PFS than those with no KRAS mutation detected (N = 12) (median 308.5 vs 168 days, P = .07) (Figure 3C).
Figure 3.
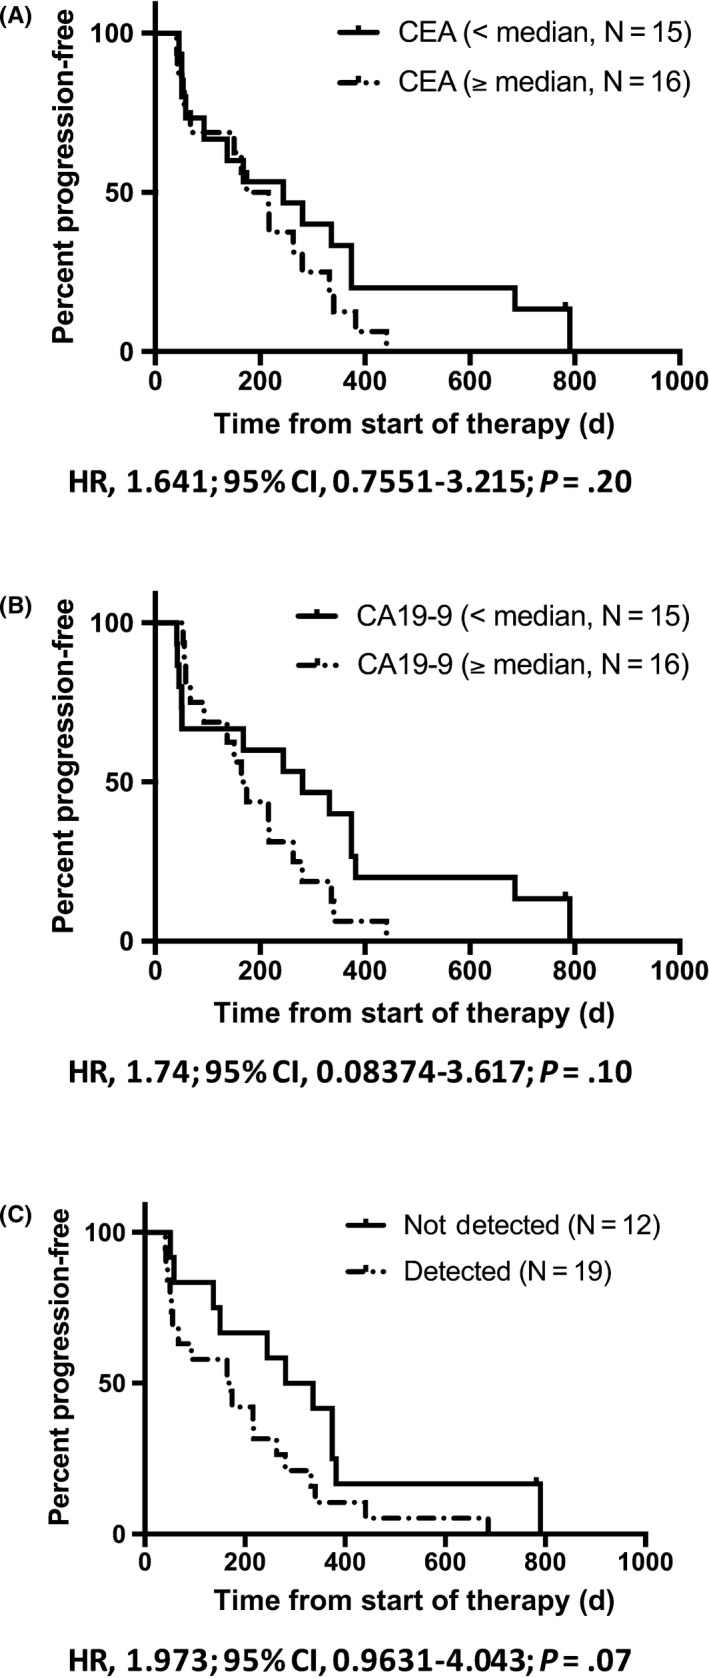
A,B, Kaplan‐Meier plot of progression‐free survival (PFS) during first‐line chemotherapy of cases with baseline of tumor markers below and, equal to or above the median value (carcinoembryonic antigen [CEA], median 244 vs 195 days, P = .20; carbohydrate antigen 19‐9 [CA19‐9], median 281 vs 169 days, P = .10). C, Kaplan‐Meier plot of PFS during first‐line chemotherapy of cases with (N = 19) and without (N = 12) KRAS G12/13 mutation in circulating tumor DNA (ct‐DNA) at the time of diagnosis (in tissue, KRAS G12/13 mutation was detected in all 31 cases). The cases, KRAS mutation detected in the ct‐DNA, had a nonsignificantly worse PFS than those without KRAS mutation (median 308.5 vs 168 days, P = .07). CI, confidence interval; HR, hazard ratio
3.4. Quantitative monitoring of KRAS or NRAS mutation in ct‐DNA
Of the 21 PDAC patients with KRAS or NRAS mutation in the primary tumor (8 locally advanced and 13 liver or lung metastasis), serum samples were collected every 4‐8 weeks for quantitative monitoring of KRAS or NRAS mutation in ct‐DNA from patients undergoing chemotherapy. The baseline characteristics of the patients are shown in Table 3. KRAS‐MAF values determined by dPCR were followed up and compared with the tumor marker levels and the therapeutic response was evaluated by imaging according to the RECIST 1.1 criteria.
Table 3.
Characteristics of patients with pancreatic ductal adenocarcinoma who underwent circulating tumor DNA (ct‐DNA) monitoring
| Total | KRAS G12/13 mutated cases | NRAS‐mutated case | ||||
|---|---|---|---|---|---|---|
| Not detected in ct‐DNA at time of diagnosis | Detected in ct‐DNA at the time of diagnosis | |||||
| Total | Disappeared | Remained | ||||
| N | 21 | 7 | 13 | 8 | 5 | 1 |
| Gender; female, male | 7, 14 | 3, 4 | 3, 10 | 3, 5 | 0, 5 | 1, 0 |
| Age, years; average (range) |
64 (27‐78) |
67 (57‐74) |
65 (42‐78) |
64 (42‐77) |
67 (57‐78) |
27 (27) |
| Stage (UICC 7th) |
1, 7, 13 (ⅡB, Ⅲ, Ⅳ) |
1, 5, 1 (ⅡB, Ⅲ, Ⅳ) |
2, 11 (Ⅲ, Ⅳ) |
2, 6 (Ⅲ, Ⅳ) |
5 (Ⅳ) |
1 (Ⅳ) |
| KRAS G12/13 mutation in tissue DNA | Yes, 20 | Yes, 7 | Yes, 13 | Yes, 8 | Yes, 5 | Yes, 0 |
| No, 1 | No, 0 | No, 0 | No, 0 | No, 0 | No, 1 | |
| (NRAS Q61R detected) | (NRAS Q61R detected) | |||||
|
MAF in ct‐DNA (%) at the time of diagnosis (KRAS or NRAS), average ± SD |
2.8 ± 7.1 | 0.0 ± 0.0 | 2.2 ± 3.9 | 3.1 ± 4.7 | 0.9 ± 1.2 | 31.2 ± 0.0 |
| 1st regimen | GN, 18 | GN, 5 | GN, 12 | GN, 8 | GN, 4 | GN, 1 |
| mFFX, 1 | mFFX, 1 | GEM, 1 | GEM, 1 | |||
| GEM, 1 | S1, 1 | |||||
| S1, 1 | ||||||
| CEA, ng/mL; average ± SD | 42.7 ± 136.4 | 6.0 ± 4.0 | 65.7 ± 169.3 | 21.7 ± 20.4 | 55 476.0 ± 128 563.7 | 1.8 ± 0.0 |
| CEA > 5 ng/mL | 15 | 4 | 11 | 7 | 4 | 0 |
|
CA19‐9 (U/mL) Ave. ± SD |
22 165.8 ± 63 597.2 | 2330.1 ± 4968.2 | 34 550.6 ± 104 272.8 | 136.0 ± 256.5 | 1070.0 ± 1409.6 | 12.0 ± 0.0 |
| CA19‐9 > 37 U/mL | 17 | 6 | 11 | 7 | 4 | 0 |
Abbreviations: CA19‐9, carbohydrate antigen 19‐9; CEA, carcinoembryonic antigen; GEM, gemcitabine; GN, gemcitabine plus nab‐paclitaxel; MAF, mutation allele frequency; mFFX, modified FOLFIRINOX; S1, tegafur (masked compound of 5‐fluorouracil).
Swimmer plots of chemotherapy with ct‐DNA monitoring are shown in Figure 4. Among the 8 locally advanced cases, a KRAS mutation in ct‐DNA was detected in 2 cases at the time of diagnosis (Pat. #16, 17). In these cases, the KRAS mutation disappeared during chemotherapy, but reappeared at the time of PD with liver metastasis. The other 6 locally advanced cases showed no KRAS mutation in ct‐DNA at the time of diagnosis. Among them, 4 cases were detected KRAS mutation in ct‐DNA for the first time at the same time that liver metastasis appeared or earlier (Pat. #10, 11, 12, 15). In the two case, no KRAS mutation was detected at the time 1st PD, due to the enlargement of primary lesion with no distant metastasis (Pat. #12, 13). In the case of Pat. #14, no ct‐DNA sample was obtained at the time of first PD. However, the KRAS mutation appeared at the second PD, due to the enlargement of liver metastatic lesions.
Figure 4.
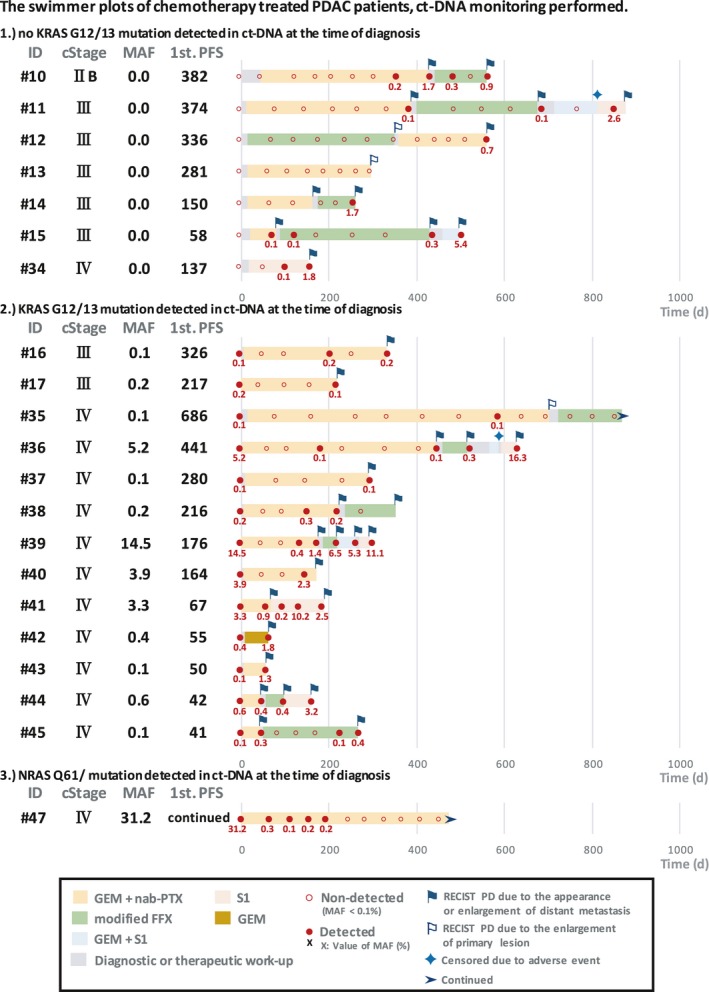
Swimmer plots of chemotherapy‐treated pancreatic ductal adenocarcinoma (PDAC) cases classified into the following groups: (1) KRAS G12/13 mutation detected in tissue DNA but not in circulating tumor DNA (ct‐DNA) at the time of diagnosis (N = 7); (2) KRAS G12/13 mutation detected in both tissue DNA and ct‐DNA at the time of diagnosis (N = 13); and (3) NRAS Q61R mutation detected by next‐generation sequencing (N = 1). Chemotherapy regimens are indicated by colored bars. Filled red circles with value, KRAS or NRAS mutation detected with mutation allele frequency (MAF) values; unfilled red circles, not detected. Blue and white flags, times of RECIST progressive disease (PD) due to appearance or enlargement of distant metastasis and to enlargement of the primary lesion, respectively. FFX, FOLFIRINOX; GEM, gemcitabine; nab‐PTX, nab‐paclitaxel; PFS, progression‐free survival; S1, tegafur (a masked compound of 5‐fluorouracil)
Among the 12 cases with lung or liver metastasis, KRAS mutation in ct‐DNA was detected in 11 cases at the time of diagnosis (the exception being Pat. #34). In the 6 cases with liver metastasis (Pat. #35, 36, 37, 38, 39, 40), KRAS mutation disappeared after the initial course of chemotherapy. During the following period, the tumor response evaluated as stable disease (SD) or partial response (PR), no KRAS mutation was detected, and KRAS mutation reappeared concurrently with or earlier than PD. In the other 5 cases, KRAS mutation did not disappear from the time of diagnosis to that of first PD (Pat. #41, 42, 43, 44, 45). The median PFS was significantly longer in cases in which KRAS mutation disappeared after the initial course of chemotherapy than in those in which it remained (248.5 vs 50 days, P < .001) (Figure 5). In a case with NRAS Q61R mutation detected by NGS, the MAF value of NRAS Q61 mutation was followed up (Pat. #47). The MAF value changed in concordance with the therapeutic response evaluated by CT. The clinical course is described below (representative case #3).
Figure 5.
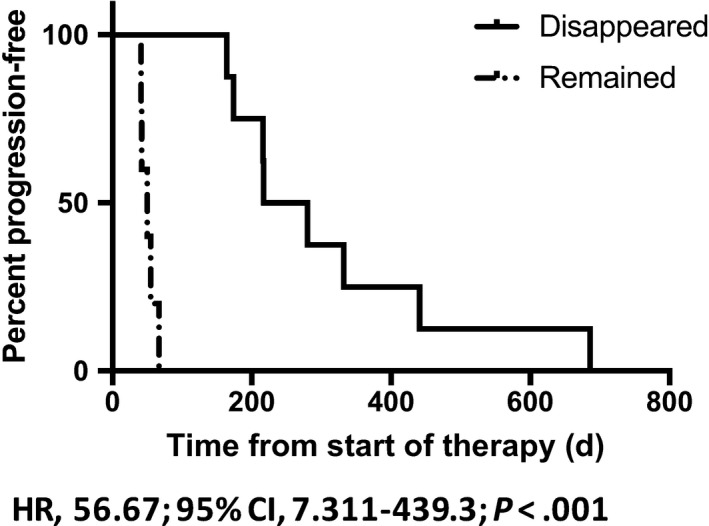
Kaplan‐Meier plot of progression‐free survival (PFS) in pancreatic ductal adenocarcinoma cases in which KRAS G12/13 mutation in circulating tumor DNA (ct‐DNA) disappeared (N = 8) or remained (N = 5) after the initial course of first‐line chemotherapy. Cases in which KRAS G12/13 mutation in ct‐DNA remained had a significantly worse PFS than those in which it disappeared (median 248.5 vs 50 days, P = .001). CI, confidence interval; HR, hazard ratio
3.5. Correlation of KRAS‐MAF with tumor markers
To evaluate the utility of the KRAS‐MAF value as a tumor marker, we compared the changes in the KRAS‐MAF value with those in the CEA and CA19‐9 levels. In the responder group, KRAS mutation disappeared (N = 8; Pat. #16, 17, 35, 36, 37, 38, 39, 40), the KRAS‐MAF value and the levels of CEA and CA19‐9 significantly decreased after the initial course of chemotherapy (Figure 6A). Similarly, in patients with KRAS mutation ct‐DNA monitoring (N = 20), the KRAS‐MAF value and the levels of CEA and CA19‐9 significantly increased in the time of first PD, compared to those at the time 1 course of chemotherapy before (Figure 6B). Furthermore, in each case with these timings (before vs after initial course of chemotherapy, and 1 course of chemotherapy before vs after first PD), there was significant correlation between the change of KRAS‐MAF values (∆KRAS‐MAF) and those of CEA and CA19‐9 levels (%change) (Figure 6C). The KRAS‐MAF values and the levels of CEA and CA19‐9 are individually shown in Table S3. In the comparison of biomarkers, however, CEA or CA19‐9 non‐elevated cases (CEA < 5.0 ng/mL, CA19‐9 < 37.0 U/mL) and no ct‐DNA sample obtained at the time of first PD case (Pat. #14) needed to be omitted.
Figure 6.
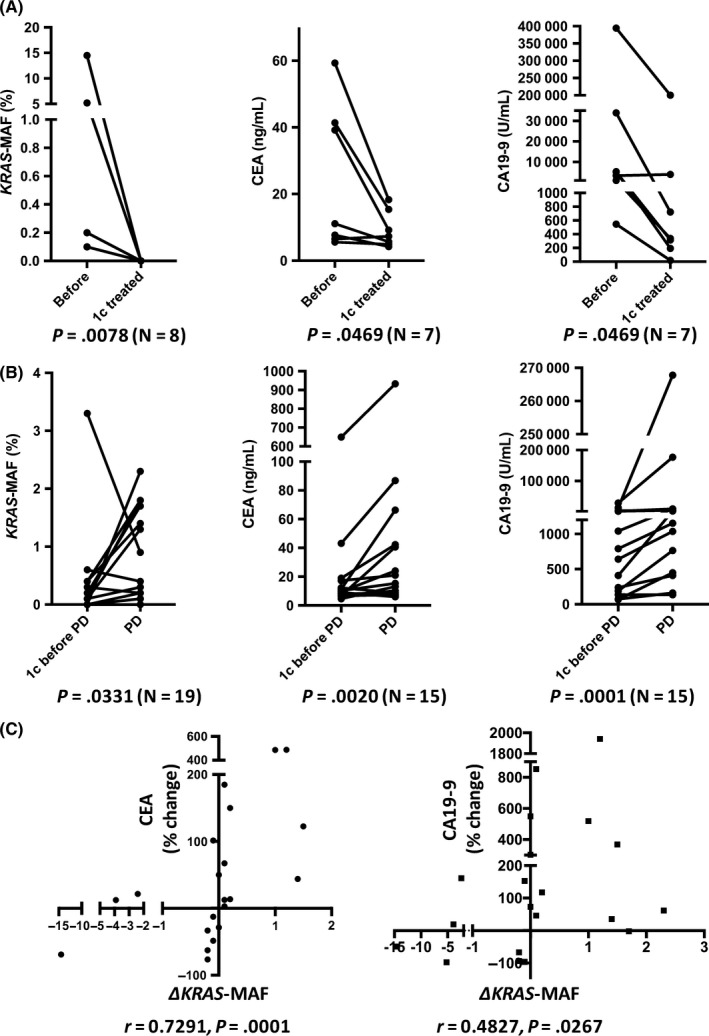
A, Changes in the KRAS mutation allele frequency (MAF) value and the carcinoembryonic antigen (CEA) and carbohydrate antigen 19‐9 (CA19‐9) levels before and after initial course of chemotherapy in pancreatic ductal adenocarcinoma cases in which the KRAS mutation disappeared (N = 8, Pat. #16, 17, 35, 36, 37, 38, 39, 40); cases in which the CEA or CA19‐9 level was not elevated (CEA < 5.0 ng/mL, CA19‐9 < 37.0 U/mL) were omitted. The KRAS‐MAF value and the levels of CEA and CA19‐9 were significantly decreased after initial course of chemotherapy. B, Changes in the KRAS‐MAF value and the CEA and CA19‐9 levels, 1 course of chemotherapy before and after first progressive disease (PD) in cases with KRAS mutation (N = 20); cases in which the CEA or CA19‐9 level was not elevated (CEA < 5.0 ng/mL, CA19‐9 < 37.0 U/mL) and no circulating tumor DNA sample obtained (Pat. #14) were omitted. At the time of the first PD, the KRAS‐MAF value and the levels of CEA and CA19‐9 were significantly increased. C, Changes of KRAS‐MAF value (∆KRAS‐MAF) and those of the CEA and CA19‐9 levels (%change) in each case. ∆KRAS‐MAF significantly correlated with percentage change of CEA or CA19‐9 levels
3.6. Representative case 1 (Pat. #10)
A 57‐year‐old woman with a history of type 2 diabetes mellitus presented to a local outpatient clinic complaining of back pain and weight loss. Abdominal ultrasonography revealed cancer of the pancreatic head, and she was referred to our hospital. Laboratory data revealed high levels of serum bilirubin (total bilirubin, 10.9 mg/dL; direct bilirubin, 8.0 mg/dL), liver enzymes (alanine transaminase [ALT], 131.0 U/L; aspartate transaminase [AST], 263 U/L), and tumor markers (CEA, 13.4 ng/mL; CA19‐9, 294.0 U/mL). Computed tomography findings revealed a 30 × 19 mm mass in the pancreatic head with malignant biliary obstruction, and that the common hepatic artery (CHA) was encased by the tumor. After placement of a plastic stent for biliary drainage, EUS‐FNA resulted in a pathologic diagnosis of pancreatic adenocarcinoma. Therefore, the patient was diagnosed with stage IIB (T3N1M0, UICC 7th) PDAC. Gemcitabine and nab‐paclitaxel (GEM plus nab‐PTX) treatment was initiated as the first‐line regimen (day 45). On day 427, after 21 courses of treatment, the response was evaluated as PD due to appearance of a new hepatic metastatic lesion, and second‐line modified FOLFIRINOX (mFFX) therapy24 was initiated on day 440. On day 560, after 4 courses of treatment, the tumor response was evaluated as PD due to enlargement of the hepatic metastatic lesion.
KRAS G12/13 mutation was detected by dPCR in EUS‐FNA samples, therefore, serum samples were collected every 4‐8 weeks and KRAS mutation was monitored in ct‐DNA (Figure 7).
Figure 7.
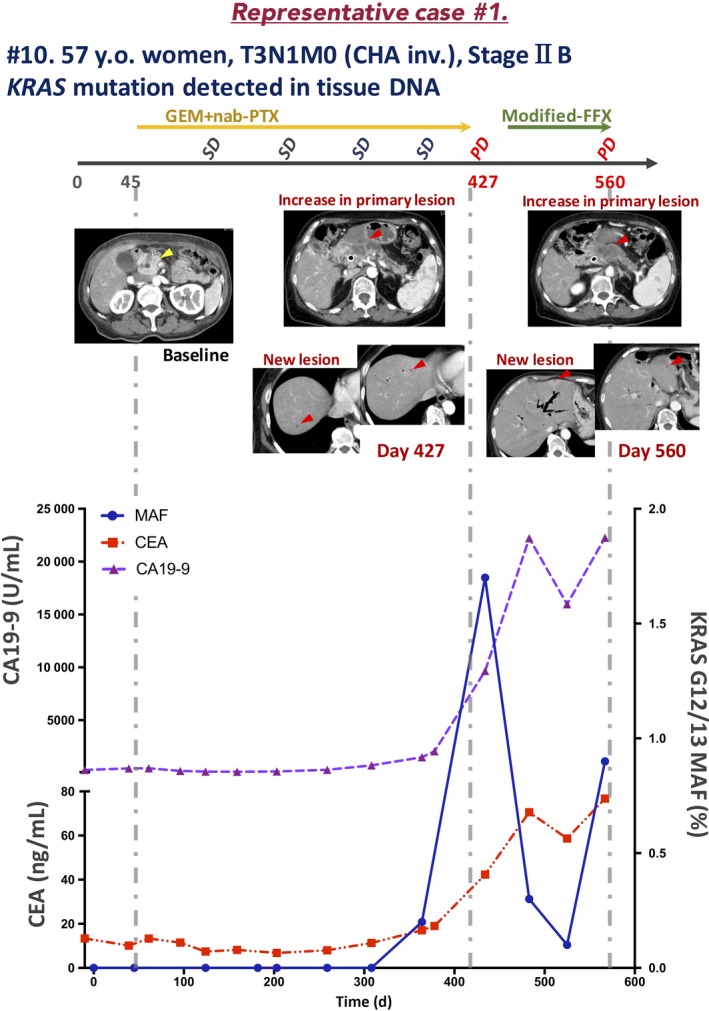
Clinical course of a representative case of locally advanced pancreatic ductal adenocarcinoma (patient [Pat.] #10) in which circulating tumor DNA was monitored during chemotherapy. CA19‐9, carbohydrate antigen 19‐9; CEA, carcinoembryonic antigen; CHA inv., common hepatic artery invasion; FFX, FOLFIRINOX; GEM, gemcitabine; MAF, mutation allele frequency; nab‐PTX, nab‐paclitaxel; PD, progressive disease; SD, stable disease; y.o., years old
In samples at the time of diagnosis and in 6 obtained subsequently, no KRAS mutation was detected. Interestingly, in the day 364 sample, when the tumor response was evaluated as SD, KRAS mutation was detected (MAF, 0.2%). Furthermore, in the day 434 sample, when the tumor response was evaluated as PD, the KRAS‐MAF value was elevated (1.7%). The increase in the KRAS‐MAF value was concurrent with that in the CEA and CA19‐9 levels. The CEA and CA19‐9 levels increased during second‐line chemotherapy; however, the KRAS‐MAF value decreased transiently and subsequently increased at the time of PD.
3.7. Representative case 2 (Pat. #39)
A 59‐year‐old woman presented to a local outpatient clinic complaining of bowel distention and loss of appetite. Abdominal ultrasonography revealed multiple liver masses, and she was referred to our hospital. Laboratory data revealed high levels of liver enzymes (ALT, 219.0 U/L; AST, 271 U/L) and tumor markers (CEA, 59.9 ng/mL; CA19‐9, 394 500.0 U/mL). Computed tomography findings revealed a 61 × 32 mm mass in the pancreatic tail with multiple liver and lung metastases. The celiac artery, superior mesenteric artery, and splenic artery were encased by the tumor. Pancreatic adenocarcinoma was diagnosed based on the pathologic findings of an EUS‐FNA sample. Therefore, the patient was diagnosed with stage IV (T4N1M1, UICC 7th) PDAC. Gemcitabine plus nab‐PTX was started as the first‐line regimen (day 0). On day 176, after 9 courses of treatment, the tumor response was evaluated as PD due to the appearance of a new hepatic metastatic lesion, and mFFX treatment was started as the second line on day 187. On day 218, after 1 course of treatment, the tumor response was evaluated as PD due to enlargement of the hepatic metastatic lesion. On day 219, GEM plus S1 (tegafur, a masked compound of 5‐fluorouracil) treatment was started as the third line, and the tumor response was evaluated as PD due to enlargement of the hepatic metastatic lesion on day 260.
KRAS G12/13 mutation was detected by dPCR. Therefore, we quantitatively monitored KRAS mutation in ct‐DNA every 4 to 8 weeks (Figure 8). KRAS mutation was detected at the time of diagnosis (MAF, 14.5%). Interestingly, in the following 2 samples, KRAS mutation had disappeared. In the day 134 sample, when the tumor response was evaluated as PR, KRAS mutation reappeared (0.4%). Furthermore, in the day 170 sample, when the tumor response was evaluated as PD, the KRAS‐MAF value was elevated (1.4%). The timing of the increase in KRAS‐MAF was identical to that of the elevation of the CEA and CA19‐9 levels. During subsequent second‐ or third‐line chemotherapy, KRAS mutation was detected continuously and the tumor response was evaluated as PD after only 1 course of chemotherapy treatment in each regimen.
Figure 8.
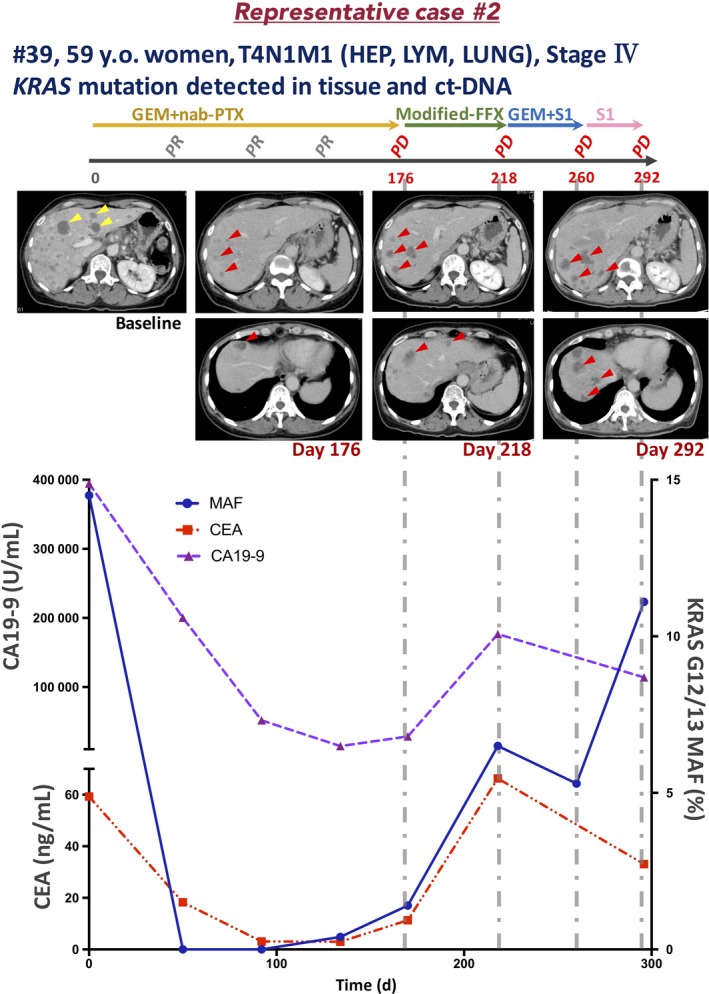
Clinical course of a representative case of pancreatic ductal adenocarcinoma with liver metastasis (patient [Pat.] #39). CA19‐9, carbohydrate antigen 19‐9; CEA, carcinoembryonic antigen; CHA inv., common hepatic artery invasion; FFX, FOLFIRINOX; GEM, gemcitabine; HEP, hepatic metastasis; LUNG, lung metastasis; LYM, lymphatic metastasis; MAF, mutation allele frequency; nab‐PTX, nab‐paclitaxel; PD, progressive disease; PR, partial response; S1, tegafur (a masked compound of 5‐fluorouracil); y.o., years old
3.8. Representative case 3 (Pat. #47)
A 27‐year‐old woman with no obvious medical or familial history presented to a local outpatient clinic complaining of epigastric pain. Abdominal ultrasonography revealed multiple liver masses, and she was referred to our hospital. Laboratory data revealed elevated liver enzyme levels (ALT, 108.0 U/L; AST, 174 U/L), but those of tumor markers—CEA (1.8 ng/mL), CA19‐9 (12.0 U/mL), Dupan‐2 (70.0 U/mL), and Span‐1 (11.0 U/mL)—were within the normal limits. The CT findings revealed a 44.5 × 35 mm mass in the pancreatic tail with multiple liver metastases. In addition, the CHA, portal vein, superior mesenteric vein, and splenic vein were encased by the tumor. The EUS‐FNA resulted in a diagnosis of pancreatic adenocarcinoma. Immunohistochemical analysis showed that the tumor cells were positive for CK7 and negative for CK20. Therefore, the patient was diagnosed with stage IV (T4N1M1, UICC 7th) PDAC. Gemcitabine plus nab‐PTX treatment was started as the first‐line regimen and the tumor volume dramatically decreased. The tumor response was evaluated as PR after day 116 until the time of writing (day 475).
No KRAS G12/13 mutation was detected by dPCR. The NGS analysis using CHPv2 revealed NRAS Q61R. Therefore, we monitored the NRAS Q61 mutation in ct‐DNA at 4‐ to 8‐week intervals (Figure 9). At the time of diagnosis, NRAS mutation was detected (MAF, 31.2%). During chemotherapy, the MAF value decreased dramatically (day 68, 0.3%; day 116, 0.1%). From day 214 to the time of writing (day 475), no NRAS mutation was detected in ct‐DNA samples.
Figure 9.
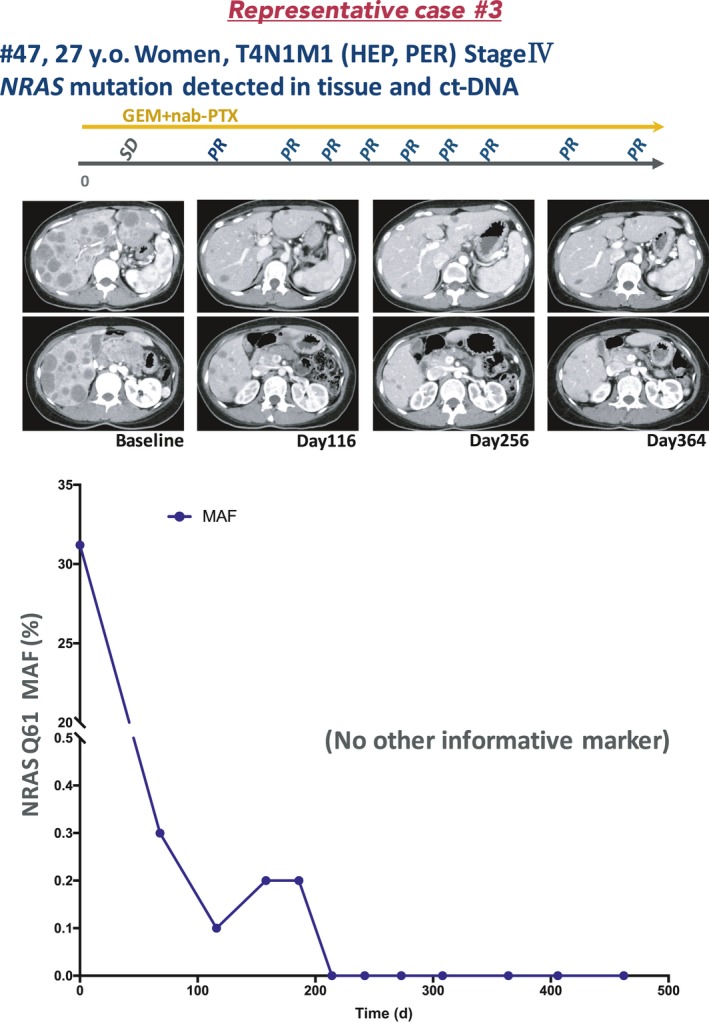
Clinical course of a case of NRAS‐mutated pancreatic ductal adenocarcinoma with liver metastasis (patient [Pat.] #47). ct‐DNA, circulating tumor DNA; GEM, gemcitabine; HEP, hepatic metastasis; MAF, mutation allele frequency; nab‐PTX, nab‐paclitaxel; PER, peritoneal metastasis; PR, partial response; SD, stable disease; y.o., years old
4. DISCUSSION
In the current study, patients with distant metastasis except peritoneal metastasis showed a significantly higher KRAS mutation detection rate in ct‐DNA compared to those with locally advanced disease or peritoneal metastasis. Also, in the patients without KRAS mutation in ct‐DNA at the time of diagnosis, KRAS mutation was detected at the time of PD due to liver metastasis. In the Kaplan‐Meier plot of PFS undergoing first‐line chemotherapy, the patients with KRAS mutation in ct‐DNA tended to have a worse PFS than those without (median, 308.5 vs 168 days, P = .07) (Figure 3C). Also, the patients with baseline tumor markers equal to or above the median value tended to have a worse PFS than those with baseline below the median value (CEA, median 244 vs 195 days, P = .20; CA19‐9, median 281 vs 169 days, P = .10) (Figure 3A,3). Recently, the detection or the concentration of KRAS mutation in ct‐DNA was reported to be one of the most reliable prognostic factors for survival in cases of advanced PDAC and for recurrence in cases of resected PDAC.25, 26, 27, 28, 29, 30 Similarly, our data suggest that detection of KRAS mutation in ct‐DNA or an elevated KRAS‐MAF value indicates PD. Furthermore, up to 15%‐26.4% of patients diagnosed with locally advanced PDAC by preoperative CT had liver metastases by explorative laparoscopy.31, 32 In our cohort, 2 locally advanced cases (without distant metastasis) showed KRAS mutation in ct‐DNA and rapidly developed liver metastasis. Therefore, CT‐occult metastases could exist at the time of diagnosis. These findings need to be verified in a prospective observational study.
The utility of ct‐DNA monitoring during chemotherapy is unclear due to the small number of cases analyzed.33, 34 Two studies have assessed the relationship between changes in the levels of KRAS mutation in ct‐DNA and disease progression. One showed that patients with KRAS mutation in ct‐DNA after 1 month of chemotherapy treatment tended to have a worse PFS than those without.35 The second reported a significant difference in PFS between patients displaying an increase vs decrease in the KRAS mutation level in ct‐DNA at day 15 of first‐line chemotherapy.36 Interestingly, our results showed that, in cases with KRAS mutation in ct‐DNA at the time of diagnosis, the KRAS mutation disappeared after the initial course of chemotherapy and reappeared concurrently with or earlier than PD (Pat. #16, 17, 35, 36, 37, 38, 39, 40) (Figure 4). In contrast, cases in which KRAS mutation remained after the initial course of chemotherapy (Pat. #32, 34, 37, 38, 41) showed a significantly worse PFS than those in whom it disappeared (median 248.5 vs 50 days, P = .001) (Figure 5). Moreover, the changes in the KRAS‐MAF value were concurrent with those in the CEA and CA19‐9 levels (before vs after initial course of chemotherapy, and 1 course of chemotherapy before vs after first PD) and there was significant correlation between the change of KRAS‐MAF values (∆KRAS‐MAF) and those of CEA and CA19‐9 levels (%change) in each case with the above timings (Figure 6; Table S3). In cases in which the CEA or CA19‐9 level was not elevated (CEA < 5.0 ng/mL, CA19‐9 < 37.0 U/mL), which is often experienced in clinical practice (Tables 1 and 3; Table S1), the KRAS‐MAF value might be more useful for monitoring KRAS‐mutated PDAC during chemotherapy. Also, during monitoring of NRAS Q61R‐mutated PDAC (a rare mutation in PDAC) (Figure S1) in patients without elevated CEA, CA19‐9, Span‐1, or Dupan‐2 levels, the changes in the NRAS‐MAF value seemed to be correlated with the disease state. Therefore, monitoring of tumor‐derived DNA enables continuous assessment of the disease state during chemotherapy.
Several prior studies have been aimed at detecting mutated KRAS in the ct‐DNA of PDAC cases.25 Using methods different from those in this study (ie, the dPCR probe, sample preparation [serum or plasma], and the sensitivity cut‐off), KRAS mutation was detected at a high frequency in cases with distant metastasis, similar to our findings. In contrast, detection of mutated KRAS in patients with early PDAC is challenging. The previous fundamental study revealed circulating DNA is mainly excreted by the liver and kidney.37 Therefore, tumor DNA derived from the primary pancreatic lesion is likely to be excreted in the liver and so is difficult to detect in peripheral blood. To define the lower limit of detection MAF value may enable to detect KRAS mutation in ct‐DNA on the no‐distant metastasis stage, however, it may worsen the specificity for the PDAC diagnosis, due to the existence of KRAS mutation detectable pancreatitis cases.38, 39 In a preliminary study, we detected mutated KRAS by dPCR in tissue samples of 2 of 17 cases of mass‐forming pancreatitis.
Integration of the KRAS‐MAF value and multiple markers reportedly improved the diagnostic accuracy of PDAC40; however, there is no evidence supporting the clinical utility of ct‐DNA detection for early‐stage diagnosis.41 Compared to prior reports, KRAS mutation was detected in locally advanced or peritoneal metastatic PDAC cases at a low rate.25, 27 This might be because we used a different probe (LBx probe for KRAS G12/13, which can detect 16 KRAS mutation patterns). However, the LBx probe for KRAS G12/13 enables the detection of more types of KRAS G12/13 mutations than other probes (Table S4). Another possibility is that we use ct‐DNA extracted from serum, not plasma, samples. We believe that serum samples are easier to handle than other types of sample, including plasma.
In conclusion, the quantitative monitoring of ct‐DNA by dPCR enables continuous evaluation of the disease state. Although further analysis is needed, the disappearance of KRAS mutation in ct‐DNA during chemotherapy could be predictive factor for disease progression of patients with PDAC.
DISCLOSURE STATEMENT
The authors declare that they have no conflicts of interest.
Supporting information
ACKNOWLEDGMENTS
Supported in part by a Grant‐in‐Aid for Scientific Research (KAKENHI).
Sugimori M, Sugimori K, Tsuchiya H, et al. Quantitative monitoring of circulating tumor DNA in patients with advanced pancreatic cancer undergoing chemotherapy. Cancer Sci. 2020;111:266–278. 10.1111/cas.14245
Funding information
Grant‐in‐Aid for Scientific Research (KAKENHI), (Grant/Award No: 17K09465)
REFERENCES
- 1. Rahib L, Smith BD, Aizenberg R, Rosenzweig AB, Fleshman JM, Matrisian LM. Projecting cancer incidence and deaths to 2030: the unexpected burden of thyroid, liver, and pancreas cancers in the United States. Cancer Res. 2014;74(11):2913‐2921. [DOI] [PubMed] [Google Scholar]
- 2. Mitselos IV, Karoumpalis I, Theopistos VI, Tzilves D, Christodoulou DK. Endoscopic ultrasonography in pancreatic diseases: advances in tissue acquisition. Endosc Int Open. 2019;7(7):E922‐E930. [DOI] [PMC free article] [PubMed] [Google Scholar]
- 3. Fuccio L, Hassan C, Laterza L, et al. The role of K‐ras gene mutation analysis in EUS‐guided FNA cytology specimens for the differential diagnosis of pancreatic solid masses: a meta‐analysis of prospective studies. Gastrointest Endosc. 2013;78(4):596‐608. [DOI] [PubMed] [Google Scholar]
- 4. Hewitt MJ, McPhail MJ, Possamai L, Dhar A, Vlavianos P, Monahan KJ. EUS‐guided FNA for diagnosis of solid pancreatic neoplasms: a meta‐analysis. Gastrointest Endosc. 2012;75(2):319‐331. [DOI] [PubMed] [Google Scholar]
- 5. Bailey P, Chang DK, Nones K, et al. Genomic analyses identify molecular subtypes of pancreatic cancer. Nature. 2016;531(7592):47‐52. [DOI] [PubMed] [Google Scholar]
- 6. Alexandrov LB, Nik‐Zainal S, Wedge DC, et al. Signatures of mutational processes in human cancer. Nature. 2013;500(7463):415‐421. [DOI] [PMC free article] [PubMed] [Google Scholar]
- 7. Biankin AV, Waddell N, Kassahn KS, et al. Pancreatic cancer genomes reveal aberrations in axon guidance pathway genes. Nature. 2012;491(7424):399‐405. [DOI] [PMC free article] [PubMed] [Google Scholar]
- 8. Witkiewicz AK, McMillan EA, Balaji U, et al. Whole‐exome sequencing of pancreatic cancer defines genetic diversity and therapeutic targets. Nat Commun. 2015;6:6744. [DOI] [PMC free article] [PubMed] [Google Scholar]
- 9. Eser S, Schnieke A, Schneider G, Saur D. Oncogenic KRAS signalling in pancreatic cancer. Br J Cancer. 2014;111(5):817‐822. [DOI] [PMC free article] [PubMed] [Google Scholar]
- 10. Morris JP, Wang SC, Hebrok M. Wnt and the twisted developmental biology of pancreatic ductal adenocarcinoma. Nat Rev Cancer. 2010;10(10):683‐695. [DOI] [PMC free article] [PubMed] [Google Scholar]
- 11. Kanda M, Matthaei H, Wu J, et al. Presence of somatic mutations in most early‐stage pancreatic intraepithelial neoplasia. Gastroenterology. 2012;142(4):730‐3.e9. [DOI] [PMC free article] [PubMed] [Google Scholar]
- 12. Trisolini E, Armellini E, Paganotti A, et al. KRAS mutation testing on all non‐malignant diagnosis of pancreatic endoscopic ultrasound‐guided fine‐needle aspiration biopsies improves diagnostic accuracy. Pathology. 2017;49(4):379‐386. [DOI] [PubMed] [Google Scholar]
- 13. Sho S, Court CM, Kim S, et al. Digital PCR Improves Mutation Analysis in Pancreas Fine Needle Aspiration Biopsy Specimens. PLoS ONE. 2017;12(1):e0170897. [DOI] [PMC free article] [PubMed] [Google Scholar]
- 14. Bournet B, Selves J, Grand D, et al. Endoscopic ultrasound‐guided fine‐needle aspiration biopsy coupled with a KRAS mutation assay using allelic discrimination improves the diagnosis of pancreatic cancer. J Clin Gastroenterol. 2015;49(1):50‐56. [DOI] [PubMed] [Google Scholar]
- 15. de Biase D, Visani M, Baccarini P, et al. Next generation sequencing improves the accuracy of KRAS mutation analysis in endoscopic ultrasound fine needle aspiration pancreatic lesions. PLoS ONE. 2014;9(2):e87651. [DOI] [PMC free article] [PubMed] [Google Scholar]
- 16. Gleeson FC, Kerr SE, Kipp BR, et al. Targeted next generation sequencing of endoscopic ultrasound acquired cytology from ampullary and pancreatic adenocarcinoma has the potential to aid patient stratification for optimal therapy selection. Oncotarget. 2016;7(34):54526‐54536. [DOI] [PMC free article] [PubMed] [Google Scholar]
- 17. Kameta E, Sugimori K, Kaneko T, et al. Diagnosis of pancreatic lesions collected by endoscopic ultrasound‐guided fine‐needle aspiration using next‐generation sequencing. Oncol Lett. 2016;12(5):3875‐3881. [DOI] [PMC free article] [PubMed] [Google Scholar]
- 18. Imaoka H, Sasaki M, Hashimoto Y, Watanabe K, Ikeda M. New era of endoscopic ultrasound‐guided tissue acquisition: next‐generation sequencing by endoscopic ultrasound‐guided sampling for pancreatic cancer. J Clin Med. 2019;8(8):1173. [DOI] [PMC free article] [PubMed] [Google Scholar]
- 19. Leon SA, Shapiro B, Sklaroff DM, Yaros MJ. Free DNA in the serum of cancer patients and the effect of therapy. Can Res. 1977;37(3):646‐650. [PubMed] [Google Scholar]
- 20. Diehl F, Schmidt K, Choti MA, et al. Circulating mutant DNA to assess tumor dynamics. Nat Med. 2008;14(9):985‐990. [DOI] [PMC free article] [PubMed] [Google Scholar]
- 21. Ulrich BC, Paweletz CP. Cell‐free DNA in oncology: gearing up for clinic. Ann Lab Med. 2018;38(1):1‐8. [DOI] [PMC free article] [PubMed] [Google Scholar]
- 22. Barretina J, Caponigro G, Stransky N, et al. The cancer cell line encyclopedia enables predictive modelling of anticancer drug sensitivity. Nature. 2012;483(7391):603‐607. [DOI] [PMC free article] [PubMed] [Google Scholar]
- 23. Gradiz R, Silva HC, Carvalho L, Botelho MF, Mota‐Pinto A. MIA PaCa‐2 and PANC‐1 ‐ pancreas ductal adenocarcinoma cell lines with neuroendocrine differentiation and somatostatin receptors. Sci Rep. 2016;6:21648. [DOI] [PMC free article] [PubMed] [Google Scholar]
- 24. Ozaka M, Ishii H, Sato T, et al. A phase II study of modified FOLFIRINOX for chemotherapy‐naive patients with metastatic pancreatic cancer. Cancer Chemother Pharmacol. 2018;81(6):1017‐1023. [DOI] [PubMed] [Google Scholar]
- 25. Kim MK, Woo SM, Park B, et al. Prognostic Implications of multiplex detection of KRAS mutations in cell‐free DNA from patients with pancreatic ductal adenocarcinoma. Clin Chem. 2018;64(4):726‐734. [DOI] [PubMed] [Google Scholar]
- 26. Pietrasz D, Pécuchet N, Garlan F, et al. Plasma circulating tumor DNA in pancreatic cancer patients is a prognostic marker. Clin Cancer Res. 2017;23(1):116‐123. [DOI] [PubMed] [Google Scholar]
- 27. Bernard V, Kim DU, San Lucas FA, et al. Circulating nucleic acids are associated with outcomes of patients with pancreatic. Cancer. Gastroenterology. 2019;156(1):pp. 108–18 e4. [DOI] [PMC free article] [PubMed] [Google Scholar]
- 28. Lee B, Lipton L, Cohen J, et al. Circulating tumor DNA as a potential marker of adjuvant chemotherapy benefit following surgery for localised pancreatic cancer. Ann Oncol. 2019. [DOI] [PMC free article] [PubMed] [Google Scholar]
- 29. Groot VP, Mosier S, Javed AA, et al. Circulating tumor DNA as a clinical test in resected pancreatic cancer. Clin Cancer Res. 2019. [DOI] [PMC free article] [PubMed] [Google Scholar]
- 30. Kinugasa H, Nouso K, Miyahara K, et al. Detection of K‐ras gene mutation by liquid biopsy in patients with pancreatic cancer. Cancer. 2015;121(13):2271‐2280. [DOI] [PubMed] [Google Scholar]
- 31. Karabicak I, Satoi S, Yanagimoto H, et al. Risk factors for latent distant organ metastasis detected by staging laparoscopy in patients with radiologically defined locally advanced pancreatic ductal adenocarcinoma. J Hepatobiliary Pancreat Sci. 2016;23(12):750‐755. [DOI] [PubMed] [Google Scholar]
- 32. Liu X, Fu Y, Chen Q, et al. Predictors of distant metastasis on exploration in patients with potentially resectable pancreatic cancer. BMC Gastroenterol. 2018;18(1):168. [DOI] [PMC free article] [PubMed] [Google Scholar]
- 33. Perets R, Greenberg O, Shentzer T, et al. Mutant KRAS circulating tumor DNA is an accurate tool for pancreatic cancer monitoring. Oncologist. 2018;23(5):566‐572. [DOI] [PMC free article] [PubMed] [Google Scholar]
- 34. Cheng HE, Liu C, Jiang J, et al. Analysis of ctDNA to predict prognosis and monitor treatment responses in metastatic pancreatic cancer patients. Int J Cancer. 2017;140(10):2344‐2350. [DOI] [PubMed] [Google Scholar]
- 35. Tjensvoll K, Lapin M, Buhl T, et al. Clinical relevance of circulating KRAS mutated DNA in plasma from patients with advanced pancreatic cancer. Mol Oncol. 2016;10(4):635‐643. [DOI] [PMC free article] [PubMed] [Google Scholar]
- 36. Del Re M, Vivaldi C, Rofi E, et al. Early changes in plasma DNA levels of mutant KRAS as a sensitive marker of response to chemotherapy in pancreatic cancer. Sci Rep. 2017;7(1):7931. [DOI] [PMC free article] [PubMed] [Google Scholar]
- 37. Tsumita T, Iwanaga M. Fate of injected deoxyribonucleic acid in mice. Nature. 1963;198:1088‐1089. [DOI] [PubMed] [Google Scholar]
- 38. Lohr M, Kloppel G, Maisonneuve P, Lowenfels AB, Luttges J. Frequency of K‐ras mutations in pancreatic intraductal neoplasias associated with pancreatic ductal adenocarcinoma and chronic pancreatitis: a meta‐analysis. Neoplasia. 2005;7(1):17‐23. [DOI] [PMC free article] [PubMed] [Google Scholar]
- 39. Le Calvez‐Kelm F, Foll M, Wozniak MB, et al. KRAS mutations in blood circulating cell‐free DNA: a pancreatic cancer case‐control. Oncotarget. 2016;7(48):78827‐78840. [DOI] [PMC free article] [PubMed] [Google Scholar]
- 40. Cohen JD, Javed AA, Thoburn C, et al. Combined circulating tumor DNA and protein biomarker‐based liquid biopsy for the earlier detection of pancreatic cancers. Proc Natl Acad Sci U S A. 2017;114(38):10202‐10207. [DOI] [PMC free article] [PubMed] [Google Scholar]
- 41. Sato Y, Matoba R, Kato K. Recent advances in liquid biopsy in precision oncology research. Biol Pharm Bull. 2019;42(3):337‐342. [DOI] [PubMed] [Google Scholar]
Associated Data
This section collects any data citations, data availability statements, or supplementary materials included in this article.
Supplementary Materials


