Abstract
Photoacoustic (PA) dyes, which absorb near-infrared (NIR) light to generate an ultrasonic signal, can be detected at centimeter depths in tissues with significantly higher resolution than dyes imaged with fluorescence-based methods. As such, PA agents show great promise as research tools for the study of live-animal disease models. However, the development of activatable PA probes has been hampered by the relative scarcity of appropriate PA-active molecular platforms with properties that can be manipulated in a rational manner. Herein we synthesized and evaluated six modifications to the aza-BODIPY dye platform with respect to their absorbance, fluorescence, and PA properties. We identified a promising conformationally restricted aza-BODIPY (CRaB) scaffold that prioritizes three criteria necessary for the design of stimulus-responsive dyes with optimal ratiometric PA response: absorbance at NIR wavelengths, strong PA intensity, and large Δλ upon interaction with the desired stimulus. Using this scaffold, we synthesized three chemically diverse stimulus-responsive PA probes and demonstrated between 2- and 8-fold improvements in theoretical ratiometric response in vitro. This suggests that improvements in PA parameters are generalizable. Finally, we validated the in vitro turnover of each CRaB PA probe and demonstrated the in vivo potential of the CRaB scaffold by direct comparison to an established hypoxia-responsive probe for the detection of tumor hypoxia.
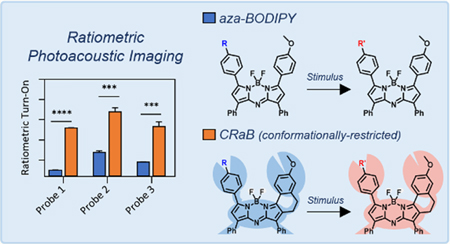
Graphical Abstract
INTRODUCTION
Selective, stimulus-responsive molecular imaging agents have become invaluable components of the chemical biologist’s toolkit. These probes have enabled the detection of metal ions, signaling molecules, enzymatic activity, and various other analytes by generating a upon engagement target analyte or environment.1–3 As a result, stimulus-responsive probes can help shed light on complex molecular pathways and biological mechanisms
The development, availability, and usage of stimulus-responsive probes have skyrocketed in recent years. In particular, the design of fluorescent probes has been facilitated by an understanding of the mechanisms driving fluorescence enhancement,4 including photoinduced electron transfer (PeT),5,6 Förster resonance energy transfer (FRET),7,8 intramolecular charge transfer (ICT), and aggregation-induced emission (AIE).9,10 These principles aid in the rational design of probes that yield an intensity-based turn-on (or turn-off) response or a ratiometric fluorescence response. While fluorescence-based methods provide exquisite resolution in cell culture and in shallow (<1.5 mm) tissue samples,11 the image resolution drops drastically at the greater depths that are required for noninvasive live-animal imaging. This highlights the need for probes that can respond to stimuli via alternative imaging modalities that enable enhanced depth penetration
Photoacoustic (PA) imaging agents, which generate contrast via the use of innocuous near-infrared (NIR) light coupled to an ultrasonic readout, fulfill these requirements. PA tomography can penetrate up to 10 cm in tissue with depth-dependent image resolution,12 and PA stimulus-responsive probes (both turn-on13–15 and ratiometric16–26) have been developed for the detection of a variety of analytes.27 Ratiometric imaging is preferable to intensity-based methods, as it accounts for experimental variability in probe distribution between the heterogeneous tissue types in live animal specimens.28 Therefore, our efforts are focused on designing tools with enhanced ratiometric response.
Ideal stimulus-responsive PA probes should satisfy three major criteria to provide a strong ratiometric turn-on in deep tissues. First, probes must absorb in the NIR to ensure that excitation light can sufficiently penetrate the tissue of interest. Second, probes must produce a strong PA signal that can be detected above the background produced by endogenous species.28 This signal strength is correlated with high extinction coefficient (ε) and low fluorescence quantum yield (Φ), among other parameters. Third, the overlap between the absorbance profiles of the probe and its product should be minimized. This can often be achieved by ensuring that probes undergo a large shift in PA wavelength (Δλ) in response to a target stimulus. In summary, probe/product pairs that maintain strong PA signals (at distinct NIR wavelengths, λblue and λred) and demonstrate large peak separation (Δλ) will be most effective. Although various fluorescent probes have been employed as PA contrast agents,18,29–38 no studies optimizing these dyes for ratiometric PA probe development have yet been reported.
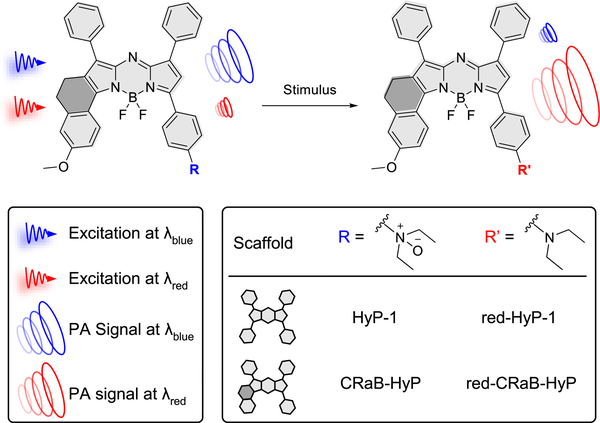
In this work, we sought to explore strategies to improve the PA intensity and Δλ of the aza-BODIPY platform. We were inspired by a small structural modification to the aza-BODIPY scaffold that restricts the rotation of the pendant phenyl groups, yielding an improvement in absorptivity without adding additional conjugation or significant steric bulk.39,40 We hypothesized that such modifications should produce a concomitant increase in PA signal, and we were interested in determining how these modifications would impact the Δλ of various probes. To thoroughly investigate these parameters, we synthesized a panel of conformationally restricted analogues of our previously developed hypoxia-responsive probe/product pair (HyP-1/red-HyP-1) and assessed the effect of these restrictions on extinction coefficient, Δλ, quantum yield, and PA signal (Figure 1).13 We identified a promising conformationally restricted aza-BODIPY (CRaB) platform and demonstrated the generality of its improved photophysical properties across a variety of stimulus-responsive molecular handles in vitro. Finally, we showed that the selected modification yielded improved ratiometric PA response in an in vivo study of tumor hypoxia.
Figure 1.
Stimulus-responsive PA probes.
RESULTS AND DISCUSSION
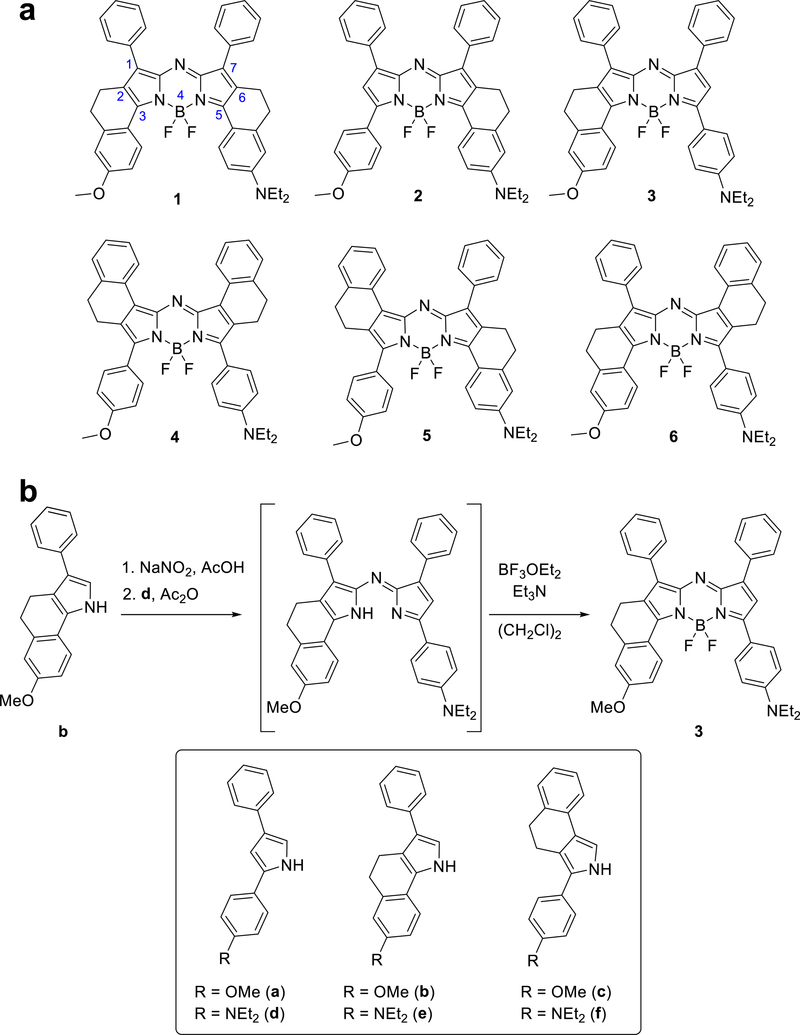
We anticipated that all conformationally restricted red-HyP-1 analogues (dyes 1–6, Figure 2a) would demonstrate improvements in molar absorptivity due to increased coplanarity between the pendant phenyl rings and the azadipyrromethene core.41 Because computational studies suggest that the phenyl substituents at the 3- and 5-aryl positions on the dipyrromethene core of the BODIPY scaffold contribute more significantly to the dye’s HOMO than substituents at the 1- and 7-aryl positions,42 we hypothesized that aza-BODIPY dyes 1–3 would show greater improvements in absorptivity relative to dye 4. This hypothesis was also supported by literature studying dyes similar to 1, which reported high absorptivity with minimal effect on quantum yield.39 Moreover, previous literature suggested that conformational restriction of the upper rings (4–6) would enhance both the absorptivity and the fluorescence quantum yields of the compounds.43 Because we expected these factors to counteract one another, we hypothesized that 4–6 would result in modest changes in PA signal, whereas dyes 1–3 would demonstrate strong PA enhancement.
Figure 2.
(a) Analogues 1–6 of red-HyP-1. The locants for the azadipyrromethene core are in blue. (b) Representative synthesis of compound 3. Compounds 1–6 were synthesized from the substituted pyrroles a–f (boxed).
The red-HyP-1 analogues 1–6 were accessed from the corresponding pyrrole monomers [see the Supporting Information (SI) for pyrrole synthesis]. The methoxy-substituted pyrroles were nitrosated in sodium nitrite and acetic acid followed by addition of the amine-substituted pyrroles in acetic anhydride to afford the unsymmetrical azadipyrromethene intermediates. Subsequent BF2 incorporation of the crude dimer yielded the final products (Figure 2b).
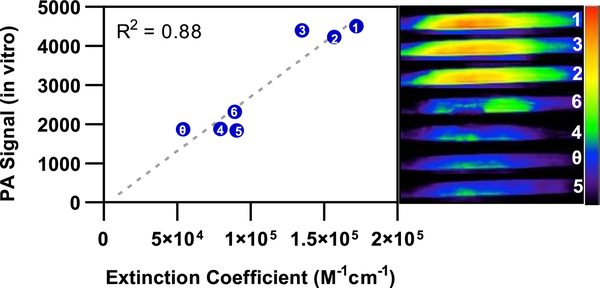
The photophysical properties of dyes 1–6 were assessed [Table 1 and Figure S1 (SI)]. The absorbance and emission wavelengths, molar absorptivity, and fluorescence quantum yield of each compound were compared to the properties of red-HyP-1. In addition, in vitro PA spectra were acquired to identify the wavelengths corresponding to their PA maxima (Figure S2 and Table S1, SI), and PA images were collected at these wavelengths (Figure 3). PA images were acquired through a tissue-mimicking phantom that evenly scatters incident excitation light to enable consistent irradiation across the sample.
Table 1.
Photophysical Propertiesa of red-HyP-1 and Analogues
| compd | λabs (nm) | λem (nm) | ε (M−1·cm−1) | Φb | fold PAc |
|---|---|---|---|---|---|
| red-HyP-1 | 760 | 798 | 5.4 × 10⁴ | 0.043 | 1.00 |
| 1 | 796 | 813 | 1.72 × 10⁵ | 0.122 | 2.42 |
| 2 | 759 | 791 | 1.57 × 10⁵ | 0.195 | 2.26 |
| 3 | 789 | 822 | 1.35 × 10⁵ | 0.054 | 2.36 |
| 4 | 757 | 803 | 7.95 × 10⁴ | 0.047 | 1.00 |
| 5 | 759 | 785 | 9.05 × 10⁴ | 0.195 | 0.99 |
| 6 | 782 | 818 | 8.92 × 10⁴ | 0.061 | 1.24 |
Characterized in CHCl3.
Fluorescence quantum yield (CHCl3) relative to indocyanine green (ICG) (DMSO).
Fold increase in PA signal relative to red-HyP-1.
Figure 3.
Linear correlation between extinction coefficient and measured in vitro PA signal (10 μM, CHCl3, in tissue-mimicking phantom) of red-HyP-1 (indicated by the θ) and analogues 1–6 (labeled in white). Representative in vitro PA images are displayed on the right, in decreasing order of intensity.
While all conformational restrictions yielded an increase in extinction coefficient, the largest improvements (>2-fold) were seen in dyes 1–3. Improvements within this series of compounds were correlated with in vitro improvements in PA signal (Figure 3), satisfying our second criterion. This evidence supported 1–3 as promising candidates for a general scaffold for ratiometric PA probes.
We next investigated the Δλ associated with hypoxia-dependent conversion of HyP to red-HyP for each of our analogues. Conveniently, we found that the absorbance spectrum of red-HyP-1 in its protonated state closely mimics the absorbance spectrum of HyP-1. As a result, we surmised that protonation of the red-HyP analogues 1–6 could be used as a proxy for N-oxide formation, enabling a rapid qualitative comparison of the absorbance properties of the HyP analogues. Compounds 1–6 were dissolved in chloroform containing 1% trifluoroacetic acid, and their absorbance maxima were identified (Table 2). Protonation of compounds 1, 2, and 5 resulted in narrower Δλ than red-HyP-1. Meanwhile, 4 and 6 yielded Δλ on par with that of red-HyP-1. Interestingly, only 3 resulted in a greater Δλ than that of red-HyP-1, satisfying our third criterion for enhanced ratiometric response. Similar results were found under aqueous conditions (Table S2, SI). These observations suggest that flexibility of the aryl group containing the stimulus-responsive moiety (in this case, the aniline/N-oxide nitrogen) is necessary for maximizing the Δλ.
Table 2.
Effect of Protonation on red-HyP Analogues as a Proxy for HyP N-Oxidesa
| compd | λabs (nm) | λabs (1% TFA) (nm) | Δλ (nm) |
|---|---|---|---|
| red-HyP-1 | 760 | 669 | 91 |
| 1 | 796 | 719 | 77 |
| 2 | 759 | 699 | 60 |
| 3 | 789 | 686 | 103 |
| 4 | 757 | 675 | 88 |
| 5 | 759 | 697 | 62 |
| 6 | 782 | 690 | 88 |
Characterized in CHCl3.
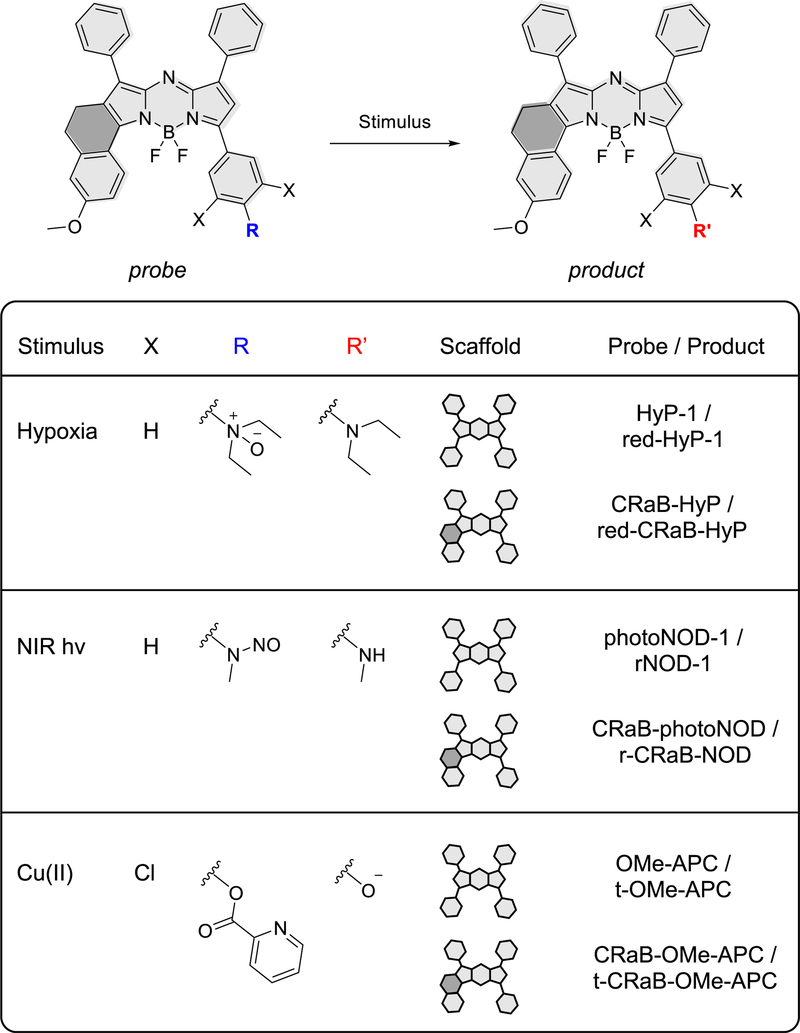
Because compound 3 (hereafter named red-CRaB-HyP) satisfied all three criteria for improved ratiometric PA response, we synthesized and characterized the corresponding hypoxia probe, CRaB-HyP, and confirmed that the Δλ predicted by our protonation studies (103 nm) was a good approximation for authentic CRaB-HyP (98 nm) (Table 3). Given the promising in vitro properties of the CRaB-HyP/red-CRaB-HyP pair, we next sought to determine if the CRaB scaffold would confer generalizable improvements in PA properties to aza-BODIPY dyes decorated with diverse substituents, as would be required for other activatable PA probes. To this end, we synthesized and characterized CRaB analogues of two other stimulus-responsive aza-BODIPY-based probes reported previously by our group: photoNOD-1 (a NIR-activated nitric oxide donor) and an analogue of APC [a probe for Cu(II)] (Figures 4, S4).16,24
Table 3.
Characterization of CRaB Analogues and Unrestricted Aza-BODIPY Parent Compounds in Chloroforma
| unrestricted |
CRaB |
|||||||||
|---|---|---|---|---|---|---|---|---|---|---|
| λabs (nm) | λem (nm) | ε (M−1·cm−1) | Φ | PA | λabs (nm) | λem (nm) | ε (M−1·cm−1) | Φ | PA | |
| HyPb | 670 | 697 | 1.50 × 10⁴ | 0.472 | 145.84 | 691 | 713 | 2.95 × 10⁴ | 0.574 | 177.84 |
| red-HyPc | 760 | 798 | 5.40 × 10⁴ | 0.043 | 839.23 | 789 | 822 | 1.35 × 10⁵ | 0.054 | 2667.97 |
| PhotoNODb | 682 | 715 | 5.59 × 10⁴ | 0.432 | 374.06 | 700 | 728 | 9.21 × 10⁴ | 0.393 | 756.71 |
| RNODc | 734 | 771 | 6.34 × 10⁴ | 0.108 | 1,099.30 | 761 | 790 | 9.35 × 10⁴ | 0.096 | 1228.32 |
| OMe-APCb | 672 | 702 | 6.98 × 10⁴ | 0.699 | 609.09 | 687 | 714 | 1.13 × 10⁵ | 0.646 | 1038.26 |
| t-OMe-APCc,d | 753 | 795 | 7.95 × 10⁴ | 0.003 | 2,002.18 | 780 | 814 | 1.13 × 10⁵ | 0.011 | 2756.02 |
PA signals were acquired for 10 μM solutions and were measured in a tissue-mimicking phantom.
Fluorescence quantum yields were measured using a known methoxy-substituted tetraaryl aza-BODIPY as a reference.40,44
Fluorescence quantum yields were measured using ICG as a reference.
Solvent was supplemented with 1% Et3N.
Figure 4.
CRaB analogues of HyP-1, photoNOD-1, and OMe-APC and their turnover products.
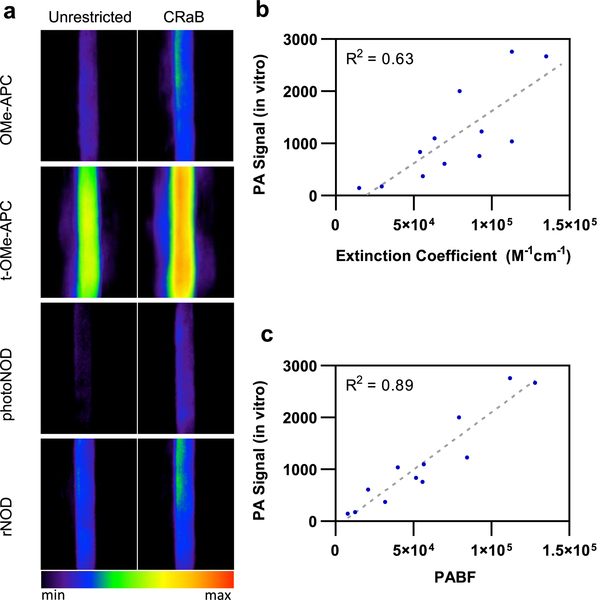
Substitution of the unrestricted aza-BODIPY core with the selected CRaB scaffold consistently increased the extinction coefficient within this series of molecules, with enhancements ranging from 1.4-fold (for the CRaB-APC turnover product) to 2.5-fold (for red-CRaB-HyP) (Table 3). We acquired PA spectra (680–900 nm) for each of these compounds to identify the appropriate PA wavelengths for the probes (λblue) and their reaction-based products (λred) (Table S3, SI). The improvements in extinction coefficient generated in vitro PA signals up to 3.2-fold higher (for red-CRaB-HyP) than the dyes’ unrestricted counterparts (Table 3, Figure 5a). The absorbance maxima of all compounds were red-shifted by ≥15 nm. Moreover, the CRaB scaffold consistently widened the Δλ for each probe–product pair [Tables 3 and S4 (SI)]. These data support the hypothesis that the CRaB scaffold provides generalizable improvements to the photophysical characteristics of aza-BODIPY dyes that are important for developing stimulus-responsive PA probes.
Figure 5.
(a) Representative in vitro PA images showing improved PA signal for CRaB compounds vs analogous unrestricted aza-BODIPY dyes at their corresponding PA maxima. (b) Correlations between in vitro PA signal vs extinction coefficient or (c) PABF for all 12 compounds listed in Table 3.
Interestingly, we found a much weaker correlation between PA intensity and extinction coefficient among these molecules (Figure 5b) than we had previously identified for our initial data set of red-HyP analogues 1–6 (Figure 3). Since PA intensity is related to both extinction coefficient and quantum yield, we reasoned that the low correlation coefficient could be due in part to the broader range of fluorescence quantum yields for these molecules (0.003–0.699, Table 3) relative to our original set of red-HyP analogues (0.043–0.195, Table 1). Inspired by the concept of fluorescence brightness (which is proportional to εΦ),45 we defined an analogous PA brightness factor (PABF, eq 1) and plotted this against our in vitro PA signal to investigate the impact of both extinction coefficient and quantum yield on PA signal (Figure 5c). Although a variety of factors are known to affect PA signal, we were delighted to find a linear correlation between our PABF and the in vitro PA signal for the 12 compounds we assessed.
| (1) |
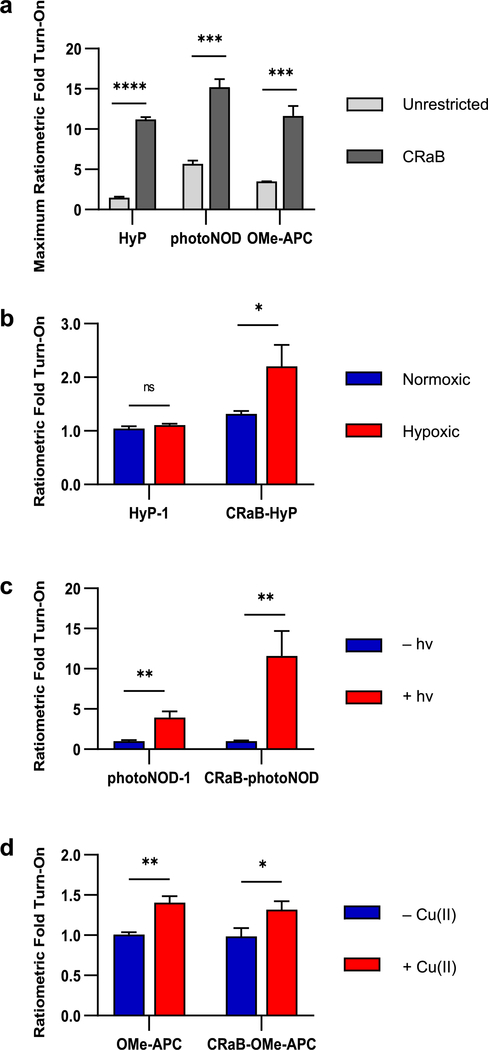
Given the promising characteristics of the CRaB probe/product pairs (Table 3), we next sought to determine the maximum theoretical ratiometric fold turn-on (eq 2) that could be observed under experimentally relevant solvent conditions. PA spectra of the probe−product pairs were collected in the relevant solvents (see Experimental Details) to identify λred and λblue for each experiment (Figure S4 and Table S3, SI). Remarkably, each of the CRaB analogues demonstrated a dramatic increase in theoretical ratiometric PA fold turn-on (Figure 6a). While complete turnover of HyP-1 would result in up to 1.48-fold turn-on, the maximum response of CRaB-HyP increased to 11.2-fold. Similarly, the theoretical response of photoNOD-1 was improved from 5.70- to 15.2- fold with conformational restriction, and that of OMe-APC was improved from 3.50- to 11.6-fold. This data further validates the CRaB scaffold as a generalizable tool to improve the photophysical properties required for reaction-based, ratiometric PA probes.
Figure 6.
(a) Theoretical ratiometric fold turn-on of the CRaB probes compared to their unrestricted counterparts, as determined from characterization of the probes and their authentic turnover products. In vitro ratiometric fold turn-on of the conformationally restricted probes compared to their unrestricted counterparts upon exposure to (b) hypoxia, (c) NIR irradiation, or (d) Cu(II). Results are presented as mean ± SD (n = 3); *p < 0.05, **p < 0.01, and ***p < 0.001.
| (2) |
After establishing our theoretical improvements, we sought to ensure that conformational restriction would not abrogate the ability of these probes to respond to their target stimuli in vitro. We directly compared the PA response and ratiometric fold turn-on of HyP-1, photoNOD-1, and OMe-APC to those of their CRaB analogues upon exposure to their target stimuli in vitro (Figure 6b–d). While HyP-1 failed to yield a ratiometric turn-on response, conformational restriction over-came this constraint (2.20-fold turn-on). CRaB-photoNOD also generated an improvement in ratiometric PA turn-on (11.6-fold) in response to irradiation relative to photoNOD-1 (3.96-fold). On other hand, in spite of the theoretical improvement in the Cu(II)-dependent ratiometric response of CRaB-OMe-APC, in practice, the turn-on of CRaB-OMe-APC (1.32-fold) did not improve relative to that of OMe-APC (1.41-fold) owing to decreased solubility in aqueous media, which hampers the probe’s access to free Cu(II).
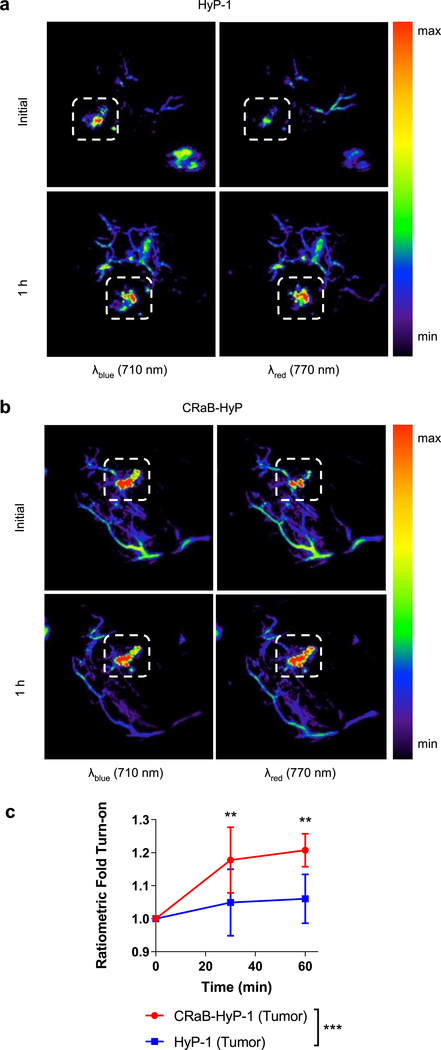
Finally, we assessed the potential of the CRaB scaffold to confer PA improvements in vivo. We obtained in vivo PA spectra for HyP-1, red-HyP-1, CRaB-HyP, and red-CRaB-HyP to determine the appropriate λblue and λred for imaging the probe–product pairs (Figure S6, SI). We then injected CRaB-HyP or HyP-1 intratumorally in an in vivo hypoxic tumor model and identified regions of interest (ROIs) containing pooled dye (Figures S7 and S8, Table S5, SI). To monitor the conversion of the N-oxide probes to their corresponding products, the PA intensities of the selected ROIs were monitored at λblue and λred over the course of 1 h (Figure 7a,b). The ratiometric fold turn-on response was then evaluated at each time point. To our satisfaction, CRaB-HyP demonstrated a significantly stronger ratiometric fold turn-on in response to tumor hypoxia than the parent compound HyP-1 (Figure 7c) at multiple doses (Figure S9, SI).
Figure 7.
Representative PA images showing tumors injected with (a) HyP-1 and (b) CRaB-HyP at λblue and λred just after local injection and after 1 h in hypoxic tumor tissue. White boxes indicate pooled dye ROIs that were quantified for further analysis. (c) Ratiometric fold turn-on of HyP-1 vs CRaB-HyP in hypoxic tumors over time. Data are presented as mean ± SD (n = 6). Statistical analysis between HyP-1 and CRaB-HyP was performed using two-way ANOVA. Ratiometric fold turn-on was compared at each time point using Sidak’s multiple comparison test (α = 0.05); *p < 0.0 and **p < 0.01.
CONCLUSION
This work represents the first focused effort toward investigating the effects of structural modifications and photophysical parameters on ratiometric PA signal output. We examined six different structural modifications to the aza-BODIPY dye platform and rigorously studied their absorbance, fluorescence, and PA properties to identify the most promising candidate for stimulus-responsive PA probe development. We found that rotational flexibility of the aryl ring containing the stimulus-responsive group was essential to maximizing Δλ, whereas restriction of the opposite aryl ring enhanced the PA signal by increasing the extinction coefficient without markedly increasing fluorescence quantum yield.
These improvements in PA intensity and peak separation enhanced the PA theoretical dynamic range in vitro for three different stimulus-responsive PA probes. The CRaB modifications more than doubled the theoretical ratiometric turn-on response of photoNOD-1 to NIR irradiation, tripled the theoretical response of OMe-APC to Cu(II), and increased the theoretical maximum response of HyP-1 to hypoxia by more than 7 times relative to the unmodified aza-BODIPY platform under in vitro conditions. In addition, we showed the potential of this scaffold for improved ratiometric PA imaging in vivo with the hypoxia-responsive probe CRaB-HyP. While CRaB-HyP and CRaB-photoNOD showed improved PA response to their target stimuli in vitro, CRaB-OMe-APC demonstrated no improvement in detection of its target stimulus. We hypothesize that this may be due to a decrease in solubility resulting from the added hydrophobic character of the Cu(II)-reactive picolinic ester moiety. We anticipate that further optimization of the CRaB scaffold will make the theoretical dynamic range of these probes more accessible.
Moreover, within our collection of unrestricted and CRaB probe/product pairs, we identified a correlation between PABF and in vitro PA intensity. While this correlation may be unique to this set of molecules, we look forward to further investigating the scope of this trend with the hope that it may be a useful method to estimate the PA potential of various aza-BODIPY modifications. Since PABF can be easily calculated from extinction coefficient and fluorescence quantum yield, validation of such a trend could enable research groups to assess the PA potential of other designs or modifications, even in the absence of PA imaging technologies, thereby broadening the accessibility of PA imaging to researchers in diverse fields.
Lastly, we highlight this work as an important step toward the rational design of functional, responsive PA imaging agents. Rather than settling on a dye platform with the greatest PA intensity or the farthest push into the NIR, our strategy prioritizes a scaffold with the most dynamic PA response to changes in substituent electronics, which is critical for differentiating the probe before and after engagement with its target stimulus. Just as the discovery of quenching by photoinduced electron transfer facilitated the design and broad use of xanthene-based fluorescent probes as research tools, we envision that this and future studies that focus on understanding aza-BODIPY dyes will broaden the utility of these molecules for PA imaging.
EXPERIMENTAL DETAILS
Synthetic Methods.
General Procedure for Compounds 1–6. A RBF was charged with pyrrole a/b/c (1.0 equiv), sodium nitrite (1.0 equiv), and acetic acid (10 mL per mmol pyrrole). The reaction mixture was stirred at room temperature fore 20 min. Pyrrole d/e/f (1.0 equiv) and acetic anhydride (4 mL per mmol of pyrrole) were added. The reaction mixture was stirred for 20 min at room temperature and then 30 min at 80 °C. The reaction mixture was cooled, diluted with a cold saturated solution of sodium bicarbonate, and filtered to isolate the heterodimer as a dark solid. The solid was suspended in dichloroethane (20 mL per mmol of dimer), and triethylamine (17 equiv) and BF3OEt2 (19 equiv) were added. The reaction mixture was stirred for 20 min at room temperature and 30 min at 80 °C. The reaction mixture was then cooled, diluted with water, and extracted with dichloromethane. The organic layer was washed with saturated sodium bicarbonate, dried over sodium sulfate, and concentrated. The resulting solid was purified as described below.
Compound 1.
Compound 1 was synthesized from pyrroles b and e (0.20 mmol each) using the general procedure. The product was purified by recrystallization in dichloromethane/hexanes (85.0 mg, 0.13 mmol, 65% yield over two steps). 1H NMR (500 MHz, DMSO-d6): δ 8.58 (d, J = 9.4 Hz, 1H), 8.45 (d, J = 8.9 Hz, 1H), 7.78–7.73 (m, 2H), 7.73–7.66 (m, 2H), 7.51 (dd, J = 8.4, 7.0 Hz, 2H), 7.47 (t, J = 7.7 Hz, 2H), 7.44–7.40 (m, 1H), 7.37–7.32 (m, 1H), 7.03–6.96 (m, 2H), 6.93 (dd, J = 9.4, 2.7 Hz, 1H), 6.81 (d, J = 2.7 Hz, 1H), 3.86 (s, 3H), 3.57 (q, J = 7.1 Hz, 4H), 2.98–2.77 (m, 8H), 1.21 (q, J = 6.8 Hz, 7H). 13C NMR (126 MHz, DMSO-d6): δ 159.91, 154.15, 151.18, 146.61, 146.31, 143.48, 142.15, 142.04, 136.00, 133.57, 132.64, 131.49, 131.33, 130.03, 129.91, 128.37, 128.14, 128.03, 127.42, 120.97, 114.25, 113.09, 112.53, 111.71, 111.23, 55.32, 44.33, 29.99, 29.87, 21.51, 20.98, 12.81. 19F NMR (471 MHz, DMSO-d6): δ −134.40 (dd, J = 68.0, 29.5 Hz). 11B NMR (161 MHz, DMSO-d6): δ 1.42 (t, J = 34.1 Hz).
Compound 2.
Compound 2 was synthesized from pyrroles a and e (0.4 mmol each) using the general procedure. The product was purified by recrystallization in dichloromethane/hexanes (90 mg, 0.14 mmol, 36% yield over two steps). 1H NMR (500 MHz, CDCl3): δ 8.69 (d, J = 9.3 Hz, 1H), 8.11–8.04 (m, 2H), 8.01 (d, J = 8.3 Hz, 2H), 7.80–7.73 (m, 2H), 7.49 (t, J = 7.6 Hz, 2H), 7.45–7.40 (m, 1H), 7.36 (dd, J = 8.4, 6.9 Hz, 2H), 7.28 (d, J = 7.4 Hz, 1H), 7.04–6.98 (m, 2H), 6.83 (s, 1H), 6.74 (d, J = 9.0 Hz, 1H), 6.54 (s, 1H), 3.89 (s, 3H), 3.49 (s, 4H), 2.99 (s, 2H), 2.92 (dd, J = 7.9, 5.6 Hz, 2H), 1.26 (t, J = 7.1 Hz, 6H). 13C NMR (151 MHz, CDCl3): δ 160.27, 157.01, 151.42, 149.44, 148.02, 146.29, 142.72, 137.93, 135.75, 134.13, 133.91, 133.59, 133.51, 132.11, 130.76, 130.55, 128.68, 128.52, 128.41, 128.22, 127.59, 126.37, 115.16, 114.27, 113.94, 111.86, 110.80, 55.43, 45.00, 31.07, 22.36, 13.02, 12.95. 19F NMR (471 MHz, CDCl3): δ −134.18 (dd, J = 65.7, 31.9 Hz). 11B NMR (161 MHz, CDCl3): δ 1.37 (t, J = 33.1 Hz).
Compound 3 (red-CRaB-HyP).
Compound 3 was synthesized from pyrroles b and d (0.30 mmol each) using the general procedure. The product was purified by silica column chromatography (3:1 dichloromethane/hexanes with 0.1% Et3N) to yield the product (112 mg, 0.18 mmol, 60% yield over two steps). 1H NMR (500 MHz, CDCl3): δ 8.72 (d, J = 8.9 Hz, 1H), 8.23–8.16 (m, 2H), 8.13–8.06 (m, 2H), 7.77–7.70 (m, 2H), 7.48 (t, J = 7.6 Hz, 2H), 7.43–7.37 (m, 3H), 7.37–7.33 (m, 1H), 7.15 (s, 1H), 6.97 (dd, J = 8.9, 2.7 Hz, 1H), 6.83 (d, J = 2.7 Hz, 1H), 6.78 (d, J = 8.7 Hz, 2H), 3.89 (s, 3H), 3.48 (q, J = 7.1 Hz, 4H), 2.93 (s, 4H), 1.25 (t, J = 7.1 Hz, 6H). 13C NMR (126 MHz, CDCl3): δ 161.43, 157.24, 150.28, 149.98, 146.09, 144.99, 143.70, 141.35, 135.82, 132.91, 132.88, 132.33, 130.71, 130.52, 130.31, 129.11, 128.77, 128.49, 128.15, 127.96, 121.17, 118.26, 118.13, 114.41, 112.97, 111.58, 55.52, 44.75, 30.88, 21.90, 12.92. 19F NMR (471 MHz, CDCl3): δ –134.18 (dd, J = 66.5, 33.2 Hz). 11B NMR (161 MHz, CDCl3): δ 1.51 (t, J = 33.4 Hz).
Compound 4.
Compound 4 was synthesized from pyrroles c and f (0.96 mmol each) using the general procedure. The product was purified by alumina column chromatography (1:1 dichloromethane/hexanes) to yield a deep purple solid (33.2 mg, 0.51 mmol, 53% yield over two steps). 1H NMR (500 MHz, CDCl3): δ 8.61 (dd, J = 7.7, 1.3 Hz, 1H), 8.55 (d, J = 7.6 Hz, 1H), 7.83–7.77 (m, 2H), 7.75–7.70 (m, 2H), 7.37 (dtd, J = 8.8, 7.4, 2.7 Hz, 2H), 7.31 (td, J = 7.4, 1.4 Hz, 1H), 7.29–7.26 (m, 3H), 7.01–6.96 (m, 2H), 6.71 (d, J = 8.7 Hz, 2H), 3.86 (s, 3H), 3.43 (q, J = 7.1 Hz, 4H), 2.94 (q, J = 7.3 Hz, 4H), 2.88–2.79 (m, 2H), 2.72 (dd, J = 8.5, 6.4 Hz, 2H), 1.22 (t, J = 7.1 Hz, 6H). 13C NMR (126 MHz, CDCl3): δ 160.45, 158.77, 151.00, 149.79, 145.45, 142.71, 138.18, 137.64, 137.51, 134.93, 132.71, 131.95, 131.67, 131.06, 130.36, 128.99, 128.48, 128.26, 128.12, 127.42, 127.12, 127.02, 124.29, 117.23, 113.72, 110.87, 55.40, 44.66, 30.03, 29.71, 21.92, 20.96, 12.85. 19F NMR (471 MHz, CDCl3): δ –131.44 (dd, J = 63.5, 31.5 Hz). 11B NMR (161 MHz, CDCl3): δ 0.89 (t, J = 31.8 Hz).
Compound 5.
Compound 5 was synthesized from pyrroles c and e (0.090 mmol each) using the general procedure. The product was purified by alumina column chromatography (2:1 chloroform/hexanes) to yield a deep purple solid (44.8 mg, 0.069 mmol, 76% yield over two steps). 1H NMR (500 MHz, CDCl3): δ 8.61 (d, J = 9.3 Hz, 1H), 8.42–8.37 (m, 1H), 7.81–7.77 (m, 2H), 7.75 (d, J = 8.6 Hz, 2H), 7.52 (dd, J = 8.4, 6.9 Hz, 2H), 7.48–7.42 (m, 1H), 7.24–7.13 (m, 3H), 7.04–6.99 (m, 2H), 6.73–6.66 (m, 1H), 6.52 (s, 1H), 3.89 (s, 3H), 3.47 (q, J = 7.1 Hz, 4H), 2.98 (t, J = 7.0 Hz, 2H), 2.91 (t, J = 7.4 Hz, 4H), 2.71 (dd, J = 8.5, 6.3 Hz, 2H), 1.24 (t, J = 7.1 Hz, 6H). 13C NMR (126 MHz, CDCl3): δ 159.84, 156.68, 151.21, 148.03, 146.03, 141.44, 137.79, 137.30, 133.50, 132.28, 131.60, 131.54, 130.57, 128.46, 128.23, 128.06, 127.38, 126.81, 126.79, 126.51, 125.16, 113.60, 111.80, 110.75, 55.37, 44.97, 31.07, 30.27, 22.29, 20.94, 12.96. 19F NMR (471 MHz, CDCl3): δ –134.39 (dd, J = 64.9, 31.1 Hz). 11B NMR (161 MHz, CDCl3): δ 1.23 (t, J = 32.9 Hz).
Compound 6.
Compound 6 was synthesized from pyrroles b and f (0.10 mmol each) using the general procedure. The product was purified by slow-drip alumina column chromatography (first purification, 1:1 dichloromethane/hexanes; second purification, 8:1 hexanes/acetone, flushed off with dichloromethane) to yield a deep purple solid (52.9 mg, 0.088 mmol, 82% yield over two steps). 1H NMR (500 MHz, CDCl3): δ 8.63 (d, J = 8.9 Hz, 1H), 8.45 (ddt, J = 6.4, 4.6, 2.3 Hz, 1H), 7.86–7.80 (m, 2H), 7.79–7.73 (m, 2H), 7.52 (t, J = 7.7 Hz, 2H), 7.46–7.39 (m, 1H), 7.25–7.20 (m, 3H), 6.91 (dd, J = 8.9, 2.7 Hz, 1H), 6.81 (d, J = 2.7 Hz, 1H), 6.78 (d, J = 8.7 Hz, 2H), 3.87 (s, 3H), 3.47 (q, J = 7.1 Hz, 4H), 2.92 (d, J = 8.2 Hz, 6H), 2.82 (t, J = 7.5 Hz, 2H), 1.25 (t, J = 7.0 Hz, 6H). 13C NMR (126 MHz, CDCl3): δ 161.63, 155.31, 151.36, 149.23, 145.52, 144.52 143.86, 137.41, 136.45, 132.87, 132.33, 131.10, 130.59, 130.29, 128.52, 128.22, 128.10, 128.00, 127.26, 126.97, 121.01, 117.84, 114.44, 112.97, 110.86, 55.53, 44.61, 30.84, 29.88, 21.88, 21.73, 12.93. 19F NMR (376 MHz, CDCl3): δ –133.82 (dd, J = 65.3, 32.2 Hz). 11B NMR (128 MHz, CDCl3): δ 1.33 (t, J = 32.7 Hz).
Maximum Ratiometric Fold Turn-on in Vitro.
HyP-1, red-HyP-1, CRaB-HyP, red-CRaB-HyP, OMe-APC, t-OMe-APC, CRaB-OMe-APC, and t-CRaB-OMe-APC were dissolved in aqueous solution (5 μM in 1:1 mixture of acetonitrile and PBS without calcium or magnesium, pH adjusted to 7.4). These solutions were pipetted into FEP tubes and imaged through a custom tissue-mimicking phantom, and their PA signals were measured upon irradiation at their respective PA maxima. PhotoNOD-1, rNOD-1, CRaB-photoNOD, and r-CRaB-NOD were dissolved in chloroform (5 μM) and imaged as above. Each experiment was repeated in triplicate.
Tissue Phantom Preparation.
Tissue phantoms were prepared by suspending agarose LE (4 g) in a solution of 2% milk (2 mL) and deionized water (78 mL). The suspension was heated in a microwave until a viscous, translucent gel was produced (30–45 s). The hot gel was poured into a custom Teflon mold containing two pieces of hypodermic steel tubing and cooled at 4 °C for at least 2 h. After cooling, the steel tubes were removed and the gel was removed from the mold, yielding a tissue phantom with two parallel channels for the placement of FEP tubes containing sample solutions.
In Vitro Hypoxia Turnover Experiments.
HyP-1 and CRaB-HyP were each dissolved into 100 mM potassium phosphate buffer to a final concentration of 10 μM in the presence of 15 μL of RLM/mL and 100 μM NADPH and stirred at 37 °C for 2 h. Normoxic controls were stirred under atmosphere. Hypoxic samples were stirred under nitrogen. Upon the conclusion of the incubations, the samples were diluted 1:1 with acetonitrile, pipetted into FEP tubes, and imaged in a custom tissue-mimicking phantom.
In Vitro NO Release Experiments.
PhotoNOD-1 and CRaB-photoNOD were each dissolved in chloroform to a final concentration of 5 μM. Samples were either irradiated for 5 min at 100% laser power (680 nm for photoNOD-1 or 700 nm for CRaB-photo-NOD) or not irradiated. After irradiation, the samples were pipetted into FEP tubes and imaged in a custom tissue-mimicking phantom.
In Vitro Cu(II) Detection Experiments.
OMe-APC and CRaB-OMe-APC were each dissolved into PBS (without calcium or magnesium) to a final concentration of 10 μM. Cu(II) (0 or 10 equiv) was added, and solutions were incubated at 37 °C. Upon completion of incubation, the solutions were diluted 1:1 with acetonitrile, pipetted into FEP tubes, and imaged in a custom tissue-mimicking phantom.
In Vivo Studies.
All in vivo experiments were performed with the approval of the Institutional Animal Care and Use Committee of the University of Illinois at Urbana–Champaign, following the principles outlined by the American Physiological Society on research animal use. Male and female BALB/c mice between 6 and 8 weeks old were acquired from a breeding colony. Hair was removed from the lower half of the body by shaving and applying depilatory cream prior to all experiments. Mice were anesthetized using isoflurane (1.5–2%) for all injections and imaging experiments.
In Vivo PA Spectra.
Compound solutions (50 μL, 50 μM solution in sterile saline containing 15% DMSO) were injected subcutaneously into the flank of a BALB/c mouse. PA images were acquired 1 h after injection at intervals of 10 nm from 680 to 900 nm. The mean PA signals were plotted as a function of wavelength.
Tumor Implantation and in Vivo PA Imaging.
4T1 cells (ATCC) were cultured in RPMI 1640 medium supplemented with 10% FBS and 1% penicillin/streptomycin. A suspension of 5.0 × 10⁵ cells in serum-free medium containing 50% v/v Matrigel (50 μL) was subcutaneously injected into both flanks of BALB/c mice (male and female, ages 6–8 weeks old). Tumors with volumes of 350–650 mm3 formed after approximately 3 weeks. HyP-1 or CRaB-HyP-1 (50 μL, 50 μM solution in sterile saline containing 15% DMSO) was administered via intratumoral injection. PA images (710 and 770 nm) were acquired immediately following injection (0 min) and at 30 and 60 min following injection using continuous rotation mode with a 6 s rotation time. Images were processed by creating maximum intensity projections to visualize accumulated signal over 8 mm. Regions of interest (ROIs) of 30 mm3 were drawn around the signal area of interest, and the mean PA intensity was recorded. Ratiometric PA signal was determined by calculating the 770/710 nm signal ratio for identical ROIs. Ratiometric fold turn-on was calculated by determining the fold enhancement of the ratiometric PA signal at each given time point relative to the initial signal. Statistical analysis was performed using two-way ANOVA. Ratiometric fold turn-on for CRaB-HyP-1 was compared to that of HyP-1 at each time point using Sidak’s multiple comparison’s test.
Supplementary Material
ACKNOWLEDGMENTS
This work was funded by the National Science Foundation (CHE-1752879). E.Y.Z. thanks the Chemistry–Biology Inter-face Training Grant (T32 GM070421), the National Science Foundation (NGE-1144245), and the Springborn Fellowship for graduate fellowships. H.J.K. thanks the Tissue Micro-environment Training Grant (T32 EB019944) and the Beckman Institute for graduate fellowships. C.L. and W.Z. acknowledge the National Natural Science Foundation of China (21372063) and Development Project of Shanghai Peak Disciplines-Integrative Medicine (20180101) for support. Major funding for the 500 MHz Bruker CryoProbe was provided by the Roy J. Carver Charitable Trust (Muscatine, Iowa; Grant No. 15–4521) to the School of Chemical Sciences NMR Lab.
Footnotes
ASSOCIATED CONTENT
Supporting Information
The Supporting Information is available free of charge on the
ACS Publications website at DOI: 10.1021/jacs.9b06694.
Further experimental details, including detailed synthetic procedures, spectral data, and supplemental in vitro and in vivo procedures and data (PDF)
The authors declare no competing financial interest.
REFERENCES
- (1).Chan J; Dodani SC; Chang CJ Reaction-based small- molecule fluorescent probes for chemoselective bioimaging. Nat. Chem. 2012, 4, 973–984. [DOI] [PMC free article] [PubMed] [Google Scholar]
- (2).Lavis LD Teaching Old Dyes New Tricks: Biological Probes Built from Fluoresceins and Rhodamines. Annu. Rev. Biochem. 2017, 86, 825–843. [DOI] [PubMed] [Google Scholar]
- (3).Chyan W; Raines RT Enzyme-Activated Fluorogenic Probes for Live-Cell and in Vivo Imaging. ACS Chem. Biol. 2018, 13, 1810–1823. [DOI] [PMC free article] [PubMed] [Google Scholar]
- (4).Fu Y; Finney NS Small-molecule fluorescent probes and their design. RSC Adv. 2018, 8, 29051–29061. [DOI] [PMC free article] [PubMed] [Google Scholar]
- (5).Tanaka K; Miura T; Umezawa N; Urano Y; Kikuchi K; Higuchi T; Nagano T Rational Design of Fluorescein-Based Fluorescence Probes. Mechanism-Based Design of a Maximum Fluorescence Probe for Singlet Oxygen. J. Am. Chem. Soc. 2001, 123, 2530–2536. [DOI] [PubMed] [Google Scholar]
- (6).Miura T; Urano Y; Tanaka K; Nagano T; Ohkubo K; Fukuzumi S Rational Design Principle for Modulating Fluorescence Properties of Fluorescein-Based Probes by Photoinduced Electron Transfer. J. Am. Chem. Soc. 2003, 125, 8666–8671. [DOI] [PubMed] [Google Scholar]
- (7).Förster T Zwischenmolekulare Energiewanderung und Fluoreszenz. Ann. Phys. 1948, 437, 55–75. [Google Scholar]
- (8).Yuan L; Lin W; Zheng K; Zhu S FRET-based small-molecule fluorescent probes: Rational design and bioimaging applications. Acc. Chem. Res. 2013, 46, 1462–1473. [DOI] [PubMed] [Google Scholar]
- (9).Luo J; Xie Z; Lam JWY; Cheng L; Tang BZ; Chen H; Qiu C; Kwok HS; Zhan X; Liu Y; Zhu D Aggregation-induced emission of 1-methyl-1,2,3,4,5-pentaphenylsilole. Chem. Commun. 2001, 18, 1740–1741. [DOI] [PubMed] [Google Scholar]
- (10).Chen Y; Lam JWY; Kwok RTK; Liu B; Tang BZ Aggregation-induced emission: fundamental understanding and future developments. Mater. Horiz. 2019, 6, 428–433. [Google Scholar]
- (11).Wang LV; Yao J A practical guide to photoacoustic tomography in the life sciences. Nat. Methods 2016, 13, 627–638. [DOI] [PMC free article] [PubMed] [Google Scholar]
- (12).Kim JY; Sahu S; Yau YH; Wang X; Shochat SG; Nielsen PH; Dueholm MS; Otzen DE; Lee J; Delos Santos MMS; Yam JKH; Kang NY; Park SJ; Kwon H; Seviour T; Yang L; Givskov M; Chang YT Detection of Pathogenic Biofilms with Bacterial Amyloid Targeting Fluorescent Probe, CDy11. J. Am. Chem. Soc. 2016, 138, 402–407. [DOI] [PubMed] [Google Scholar]
- (13).Knox HJ; Hedhli J; Kim TW; Khalili K; Dobrucki LW; Chan J A bioreducible N-oxide-based probe for photoacoustic imaging of hypoxia. Nat. Commun. 2017, 8, 1794. [DOI] [PMC free article] [PubMed] [Google Scholar]
- (14).Cai Q; Fei Y; Hu L; Huang Z; Li L-L; Wang H Chemotaxis-Instructed Intracellular Staphylococcus aureus Infection Detection by a Targeting and Self-Assembly Signal-Enhanced Photoacoustic Probe. Nano Lett. 2018, 18, 6229–6236. [DOI] [PubMed] [Google Scholar]
- (15).Wang Y; Hu X; Weng J; Li J; Fan Q; Zhang Y; Ye D A Photoacoustic Probe for the Imaging of Tumor Apoptosis by Caspase-Mediated Macrocyclization and Self-Assembly. Angew. Chem., Int. Ed. 2019, 58, 4886–4890. [DOI] [PubMed] [Google Scholar]
- (16).Li H; Zhang P; Smaga LP; Hoffman RA; Chan J Photoacoustic Probes for Ratiometric Imaging of Copper(II). J. Am. Chem. Soc. 2015, 137, 15628–15631. [DOI] [PubMed] [Google Scholar]
- (17).Ho I-T; Sessler JL; Gambhir SS; Jokerst JV Parts per billion detection of uranium with a porphyrinoid-containing nano-particle and in vivo photoacoustic imaging. Analyst 2015, 140, 3731–3737. [DOI] [PMC free article] [PubMed] [Google Scholar]
- (18).Li X; Tang Y; Li J; Hu X; Yin C; Yang Z; Wang Q; Wu Z; Lu X; Wang W; Huang W; Fan Q A small-molecule probe for ratiometric photoacoustic imaging of hydrogen sulfide in living mice. Chem. Commun. 2019, 55, 5934–5937. [DOI] [PubMed] [Google Scholar]
- (19).Zhang J; Smaga LP; Satyavolu NSR; Chan J; Lu Y DNA Aptamer-Based Activatable Probes for Photoacoustic Imaging in Living Mice. J. Am. Chem. Soc. 2017, 139, 17225–17228. [DOI] [PMC free article] [PubMed] [Google Scholar]
- (20).Chen Q; Liang C; Sun X; Chen J; Yang Z; Zhao H; Feng L; Liu ZH 2 O 2 -responsive liposomal nanoprobe for photoacoustic inflammation imaging and tumor theranostics via in vivo chromogenic assay. Proc. Natl. Acad. Sci. U. S. A. 2017, 114, 5343–5348. [DOI] [PMC free article] [PubMed] [Google Scholar]
- (21).Knox HJ; Kim TW; Zhu Z; Chan J Photophysical Tuning of N -Oxide-Based Probes Enables Ratiometric Photoacoustic Imaging of Tumor Hypoxia. ACS Chem. Biol. 2018, 13, 1838–1843. [DOI] [PubMed] [Google Scholar]
- (22).Reinhardt CJ; Zhou EY; Jorgensen MD; Partipilo G; Chan J A Ratiometric Acoustogenic Probe for in Vivo Imaging of Endogenous Nitric Oxide. J. Am. Chem. Soc. 2018, 140, 1011–1018. [DOI] [PMC free article] [PubMed] [Google Scholar]
- (23).Roberts S; Seeger M; Jiang Y; Mishra A; Sigmund F; Stelzl A; Lauri A; Symvoulidis P; Rolbieski H; Preller M; Deán- Ben XL; Razansky D; Orschmann T; Desbordes SC; Vetschera P; Bach T; Ntziachristos V; Westmeyer GG Calcium Sensor for Photoacoustic Imaging. J. Am. Chem. Soc. 2018, 140, 2718–2721. [DOI] [PubMed] [Google Scholar]
- (24).Zhou EY; Knox HJ; Reinhardt CJ; Partipilo G; Nilges MJ; Chan J Near-Infrared Photoactivatable Nitric Oxide Donors with Integrated Photoacoustic Monitoring. J. Am. Chem. Soc. 2018, 140, 11686–11697. [DOI] [PMC free article] [PubMed] [Google Scholar]
- (25).Lu X; Zhao M; Chen P; Fan Q; Wang W; Huang W Enhancing hydrophilicity of photoacoustic probes for effective ratiometric imaging of hydrogen peroxide. J. Mater. Chem. B 2018, 6, 4531–4538. [DOI] [PubMed] [Google Scholar]
- (26).Yin L; Sun H; Zhang H; He L; Qiu L; Lin J; Xia H; Zhang Y; Ji S; Shi H; Gao M Quantitatively Visualizing Tumor-Related Protease Activity in Vivo Using a Ratiometric Photoacoustic Probe. J. Am. Chem. Soc. 2019, 141, 3265–3273. [DOI] [PubMed] [Google Scholar]
- (27).Reinhardt CJ; Chan J Development of Photoacoustic Probes for in Vivo Molecular Imaging. Biochemistry 2018, 57, 194–199. [DOI] [PMC free article] [PubMed] [Google Scholar]
- (28).Weber J; Beard PC; Bohndiek SE Contrast agents for molecular photoacoustic imaging. Nat. Methods 2016, 13, 639–650. [DOI] [PubMed] [Google Scholar]
- (29).Glatz J; Deliolanis NC; Ding L, Taruttis A; Rosenthal A; Schulz R; Razansky D; Ntziachristos V Multiparametric optimization of multispectral optoacoustic tomography for deep tissue imaging In Photons Plus Ultrasound: Imaging and Sensing 2010; Oraevsky AA., Wang LV, Eds.; SPIE, 2010; Vol. 7564, paper 7564–110. [Google Scholar]
- (30).Knox HJ; Chan J Acoustogenic Probes: A New Frontier in Photoacoustic Imaging. Acc. Chem. Res. 2018, 51, 2897–2905. [DOI] [PMC free article] [PubMed] [Google Scholar]
- (31).Levi J; Kothapalli SR; Ma T-J; Hartman K; Khuri-Yakub BT; Gambhir SS Design, Synthesis, and Imaging of an Activatable Photoacoustic Probe. J. Am. Chem. Soc. 2010, 132, 11264–11269. [DOI] [PMC free article] [PubMed] [Google Scholar]
- (32).Morgounova E; Shao Q; Hackel BJ; Thomas DD; Ashkenazi S Photoacoustic lifetime contrast between methylene blue monomers and self-quenched dimers as a model for dual-labeled activatable probes. J. Biomed. Opt. 2013, 18, 056004. [DOI] [PMC free article] [PubMed] [Google Scholar]
- (33).Laoui S; Bag S; Dantiste O; Frenette M; Hatamimoslehabadi M; Bellinger-Buckley S; Tseng J-C; Rochford J; Yelleswarapu C BODIPY derivatives as molecular photoacoustic contrast agents In Reporters, Markers, Dyes, Nano-particles, and Molecular Probes for Biomedical Applications VI; Achilefu S, Raghavachari R, Eds.; SPIE, 2014; Proceedings Vol. 8956, paper 895609. [Google Scholar]
- (34).Xie B; Tomaszewski MR; Neves AA; Ros S; Hu D-E; McGuire S; Mullins SR; Tice D; Sainson RC; Bohndiek SE; Wilkinson RW; Brindle KM Optoacoustic Detection of Early Therapy-Induced Tumor Cell Death Using a Targeted Imaging Agent. Clin. Cancer Res. 2017, 23, 6893–6903. [DOI] [PubMed] [Google Scholar]
- (35).Märk J; Wagener A; Zhang E; Laufer J Photoacoustic pump-probe tomography of fluorophores in vivo using interleaved image acquisition for motion suppression. Sci. Rep. 2017, 7, 40496. [DOI] [PMC free article] [PubMed] [Google Scholar]
- (36).Wang D; Wei W; Singh A; He GS; Kannan R; Tan L-S; Chen G; Prasad PN; Xia J Nonlinear Photoacoustic Imaging by in Situ Multiphoton Upconversion and Energy Transfer. ACS Photonics 2017, 4, 2699–2705. [DOI] [PMC free article] [PubMed] [Google Scholar]
- (37).Gao Z; Li G; Li X; Zhou J; Duan X; Chen J; Joshi BP; Kuick R; Khoury B; Thomas DG; Fields T; Sabel MS; Appelman HD; Zhou Q; Li H; Kozloff K; Wang TD In vivo near-infrared imaging of ErbB2 expressing breast tumors with dual-axes confocal endomicroscopy using a targeted peptide. Sci. Rep. 2017, 7, 14404. [DOI] [PMC free article] [PubMed] [Google Scholar]
- (38).Zhen X; Zhang J; Huang J; Xie C; Miao Q; Pu K Macrotheranostic Probe with Disease-Activated Near-Infrared Fluorescence, Photoacoustic, and Photothermal Signals for Imaging-Guided Therapy. Angew. Chem., Int. Ed. 2018, 57, 7804–7808. [DOI] [PubMed] [Google Scholar]
- (39).Zhao W; Carreira EM Conformationally Restricted Aza-Bodipy: A Highly Fluorescent, Stable, Near-Infrared-Absorbing Dye. Angew. Chem., Int. Ed. 2005, 44, 1677–1679. [DOI] [PubMed] [Google Scholar]
- (40).Zhao W; Carreira EM Conformationally Restricted Aza-BODIPY: Highly Fluorescent, Stable Near-Infrared Absorbing Dyes. Chem. - Eur. J. 2006, 12, 7254–7263. [DOI] [PubMed] [Google Scholar]
- (41).Lu H; Mack J; Yang Y; Shen Z Structural modification strategies for the rational design of red/NIR region BODIPYs. Chem. Soc. Rev. 2014, 43, 4778–4823. [DOI] [PubMed] [Google Scholar]
- (42).Leen V; Miscoria D; Yin S; Filarowski A; Molisho Ngongo J; Van Der Auweraer M; Boens N; Dehaen W 1,7-disubstituted boron dipyrromethene (BODIPY) dyes: Synthesis and spectroscopic properties. J. Org. Chem. 2011, 76, 8168–8176. [DOI] [PubMed] [Google Scholar]
- (43).Jiao L; Wu Y; Ding Y; Wang S; Zhang P; Yu C; Wei Y; Mu X; Hao E Conformationally restricted aza-dipyrromethene boron difluorides (aza-BODIPYs) with high fluorescent quantum yields. Chem. - Asian J. 2014, 9, 805–810. [DOI] [PubMed] [Google Scholar]
- (44).Killoran J; Allen L; Gallagher JF; Gallagher WM; O’Shea DF Synthesis of BF 2 chelates of tetraarylazadipyrromethenes and evidence for their photodynamic therapeutic behaviour. Chem. Commun. 2002, 8, 1862–1863. [DOI] [PubMed] [Google Scholar]
- (45).Lavis LD; Raines RT Bright Ideas for Chemical Biology. ACS Chem. Biol. 2008, 3, 142–155. [DOI] [PMC free article] [PubMed] [Google Scholar]
Associated Data
This section collects any data citations, data availability statements, or supplementary materials included in this article.


