Abstract
Paleo-Eskimos were the first people to settle vast regions of the American Arctic around 5,000 years ago, and were subsequently joined and largely displaced around 1,000 years ago by ancestors of present-day Inuit and Yup’ik1–3. The genetic relationship between Paleo-Eskimos and Native American, Inuit, Yup’ik and Aleut populations remains uncertain4–7. Here we present new genomic data for 48 ancient individuals from Chukotka, East Siberia, the Aleutian Islands, Alaska, and the Canadian Arctic. We co-analyze these data with new data from present-day Alaskan Iñupiat and West Siberian populations and published genomes. Employing new methods based on rare allele and haplotype sharing as well as established methods4,8–10, we show that Paleo-Eskimo-related ancestry is ubiquitous among populations speaking Na-Dene and Eskimo-Aleut languages. We develop a comprehensive model for the Holocene peopling events of Chukotka and North America, and show that several key migrations connected to the origin of the Na-Dene peoples, the peopling of the Aleutian Islands, and the spread of Yup’ik and Inuit across the Arctic region are genetically linked to a single Siberian source related to Paleo-Eskimos.
Present-day Native Americans descend from at least four distinct streams of ancient migration from Asia4,5,11–13. First, populations related to present-day East Asians moved into North and South America by ~14,500 years ago (ya)5,14,15, here called “First Peoples”. Second, a population of Australasian ancestry, termed “Population Y”, contributed distinct ancestry to Indigenous groups from Amazonia5,11–13. Third, a stream of ancestry related to Paleo-Eskimos spread throughout the American Arctic after about 5,000 ya1–3. Fourth, a lineage here called “Neo-Eskimo” spread with the Thule and related archaeological cultures throughout the Arctic region ca. 800 ya2,3 and is today present in Yup’ik and Inuit. We here use the terms “Paleo-Eskimo” and “Neo-Eskimo”2,16 but recognize that those terms are not universally accepted by all scholars and Indigenous groups in Canada and the U.S.17 Of these four lines of ancestry, the extent of Paleo-Eskimo ancestry in living and ancient populations is arguably least understood. While the archaeological record in the Arctic provides clear evidence for Paleo-Eskimo cultures from about 5,000 ya to 700 ya3,18–20, whether or not they contributed genetically to other Arctic groups is unclear. It has been argued4 that Na-Dene-speaking Indigenous groups (including Tlingit and Athabaskans) harbor ancestry related to Paleo-Eskimos, but other studies contradicted this finding5–7. Likewise, admixture between Paleo- and Neo-Eskimos has been the subject of an unresolved debate6,7,16,21.
We generated new genome-wide data from 48 ancient individuals from the American Arctic and Siberia: 11 ancient Aleutian Islanders (2,050 to 280 calBP), three ancient Northern Athabaskans (900 – 550 calBP), 21 individuals from the Ekven and Uelen burial grounds associated with the Chukotkan Old Bering Sea culture (1,770 – 620 calBP), one Paleo-Eskimo of the Middle Dorset culture (1,900 – 1,610 calBP ), and 12 individuals from the Ust’-Belaya burial ground near Lake Baikal (7,020 – 610 calBP) (Supplementary Table 1 and 2, Supplementary Information sections 1 and 2). For each of these 48 individuals, we drilled bone powder in a clean-room, extracted DNA22, and prepared sequencing libraries treated with enzymes to reduce the rate of characteristic ancient DNA damage23. We enriched the libraries for a targeted set of approximately 1.24 million single nucleotide polymorphisms (SNPs)24, and selected one ancient Athabaskan and one ancient Aleutian Islander for deeper shotgun sequencing (Supplementary Information section 3). In addition to these ancient data, we report new SNP genotyping data for five present-day populations from Alaska and Siberia (Supplementary Table 3).
Because this study analyses DNA to understand how ancient populations are related to present-day Indigenous peoples, we consulted with Indigenous communities in the United States and Canada regarding the study of all ancient individuals. In accordance with published guidelines for ethical genomic research with Indigenous peoples and their ancestors in the Americas25, we obtained permissions for destructive sampling of the ancient Aleuts, ancient Athabaskans, and the ancient Middle Dorset individual, as detailed in Supplementary Information section 1. Approval was also granted for the inclusion of present-day Iñupiat samples as described.
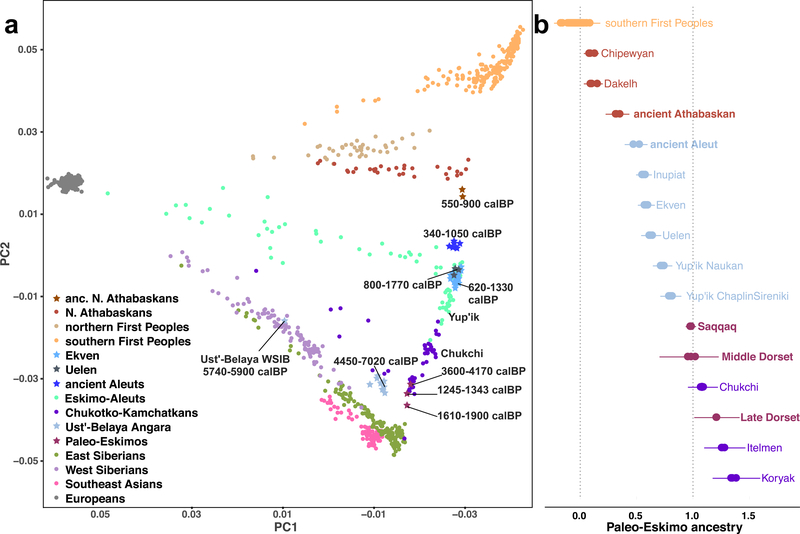
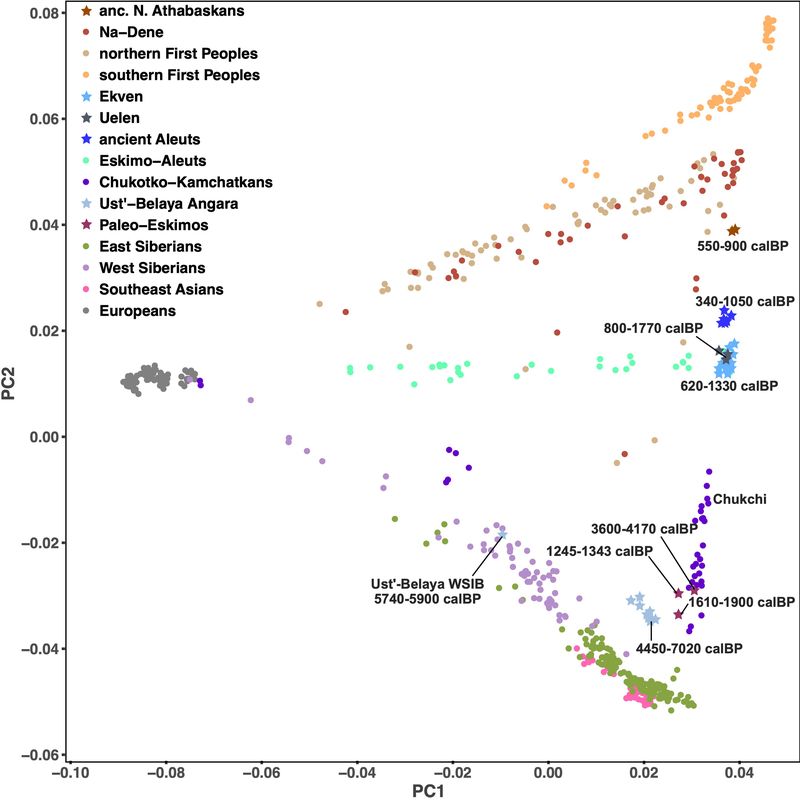
Principal Component Analysis (PCA) (Fig. 1a) of these new data together with present-day reference data (Extended Data Fig. 1) reveals a linear cline with Paleo-Eskimos and some Koryaks and Itelmens (Chukotko-Kamchatkan speakers, C-K) at one extreme, then in order Chukchi, Yup’ik, the ancient Old Bering Sea population and present-day Inuit, present-day and ancient Aleuts (Eskimo-Aleut speakers), ancient Athabaskans, present-day Na-Dene speakers, Northern First Peoples and finally Southern First Peoples at the other extreme (Extended Data Fig. 2, Supplementary Information section 4). This qualitative pattern in PCA is driven by admixture of two lines of ancestry, as we verified using qpWave4 (see Methods). When we included C-K as target populations instead of outgroups, all populations on the PCA cline could be modeled as descended from two streams of ancestry (Supplementary Information section 5). We here term these two ancestry components “First Peoples” and “proto-Paleo-Eskimos” (PPE). We used qpAdm8, an extension of qpWave, to estimate ancestry proportions for populations on the cline. Consistent with the position along the PCA cline, our estimates for PPE ancestry range from 0% (Southern First Peoples), 0–18% (Northern First Peoples), 5–23% (present-day Na-Dene), 32–43% (ancient Northern Athabaskans), 43–64% (ancient Aleuts, ancient Old Bering Sea people and present-day Inuit), 72%−82% (Yup’ik) and up to 100% in C-K and Paleo-Eskimos (Fig. 1b, Extended Data Figs. 3, 4). Previously, a similar analysis revealed three, and not two, lines of ancestry in Northern American populations4, with a similar setup but with Koryak in the outgroups. We could reproduce this finding (Supplementary Information section 5), but, as we show below, the most parsimonious model for the genetic history of C-K involves gene flow from Neo-Eskimos, carrying both Paleo-Eskimo and First Peoples ancestry back into Asia. This backflow causes qpWave to report a separate ancestral lineage in Eskimo-Aleut speakers.
Figure 1. Principal component analysis (PCA) and qpAdm modelling.
a) The first two PCs for 940 individuals from the HumanOrigins dataset are plotted. No outliers were excluded for this analysis based on 586,487 loci. Calibrated radiocarbon dates (calBP) are shown for ancient samples (95% confidence intervals for individuals, minimal and maximal average dates for groups). See Extended Data Fig. 2 and Supplementary Information section 4 for PCA plots of additional datasets. b) Proportions of Paleo-Eskimo ancestry inferred by qpAdm, using the same dataset as in a) but without transition polymorphisms. To visualize both systematic and statistical errors, for each target group ancestry proportions and their single standard error intervals are shown for population triplets including different First Peoples ancestry sources, or for many alternative target populations in the case of Southern First Peoples. Target population sizes ranged from 1 to 23 individuals, with 5.6 on average.
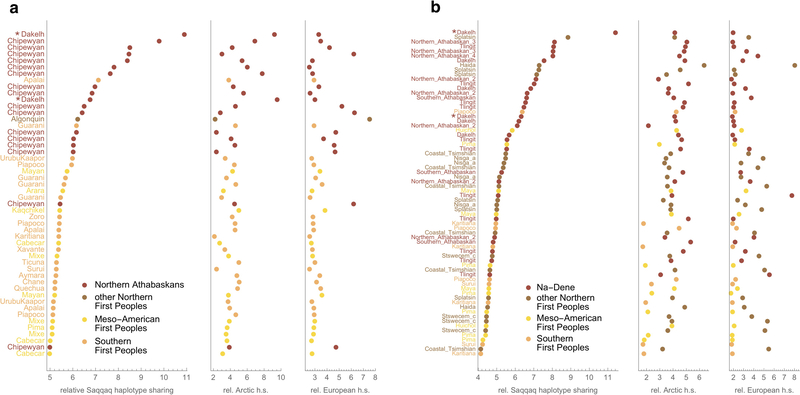
To further investigate whether the PPE source contributing to Na-Dene populations is directly related to Paleo-Eskimos, we used ChromoPainter26 to compute the cumulative length of haplotypes shared with the ancient Saqqaq genome1. We find that most Native American individuals with the highest relative Saqqaq haplotype sharing belong to the Na-Dene group. This enrichment cannot be explained by either Neo-Eskimo or European ancestry in these individuals (Extended Data Fig. 5, Supplementary Information section 6). Furthermore, GLOBETROTTER27, a method based on haplotype sharing, identifies Paleo-Eskimos (represented by the Saqqaq individual) and First Peoples as the most likely sources of ancestry for Na-Dene, with the Paleo-Eskimo contribution ranging from 7% to 51% and gene flow estimated to have occurred between 2,202 to 479 ya (Supplementary Information section 7).
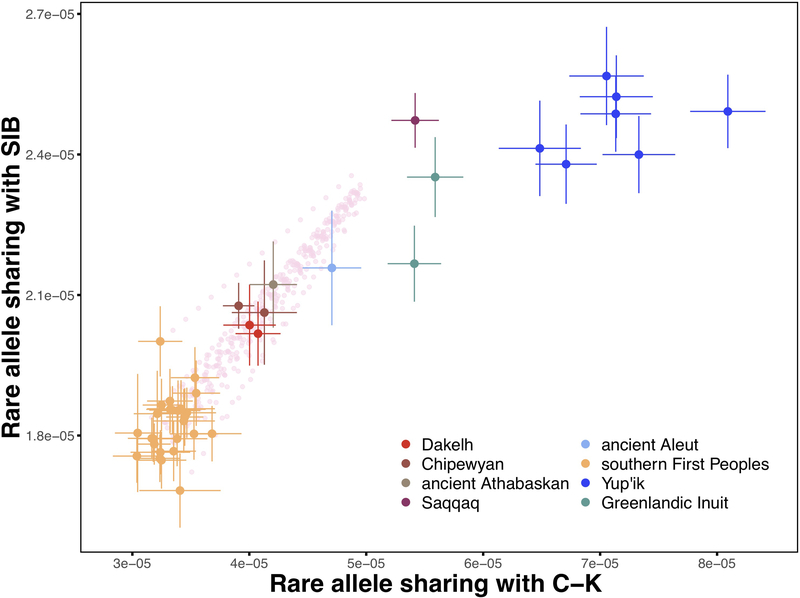
As an independent assessment of the PPE admixture cline model, we identified rare genetic variants in a large dataset of present-day full genomes outside of America and counted how often a given American genome shared those alleles. This approach allowed us to detect subtle ancestry differences between Indigenous populations in the Americas (Supplementary Information section 8). We find that present-day Athabaskans and the ancient Athabaskan and Aleut individuals with shotgun-sequenced genomes are indeed consistent with a two-way admixture model between Paleo-Eskimos and First Peoples, with present-day Athabaskans having 29–38%, the ancient Athabaskan having ~42%, and the ancient Aleut having ~65% Saqqaq-related ancestry (Extended Data Fig. 6). The consistently higher PPE proportion in ancient compared to present-day Athabaskans obtained here, in the qpAdm analysis and further analyses below suggests that ongoing bidirectional genetic exchange with neighboring Northern First Peoples has been reducing the PPE ancestry in Na-Dene. Rare allele sharing also shows that present-day Yup’ik and Inuit genomes are inconsistent with this two-way admixture model, but instead exhibit higher allele sharing with C-K, consistent with the qpWave/qpAdm analysis above and our explicit demographic model below.
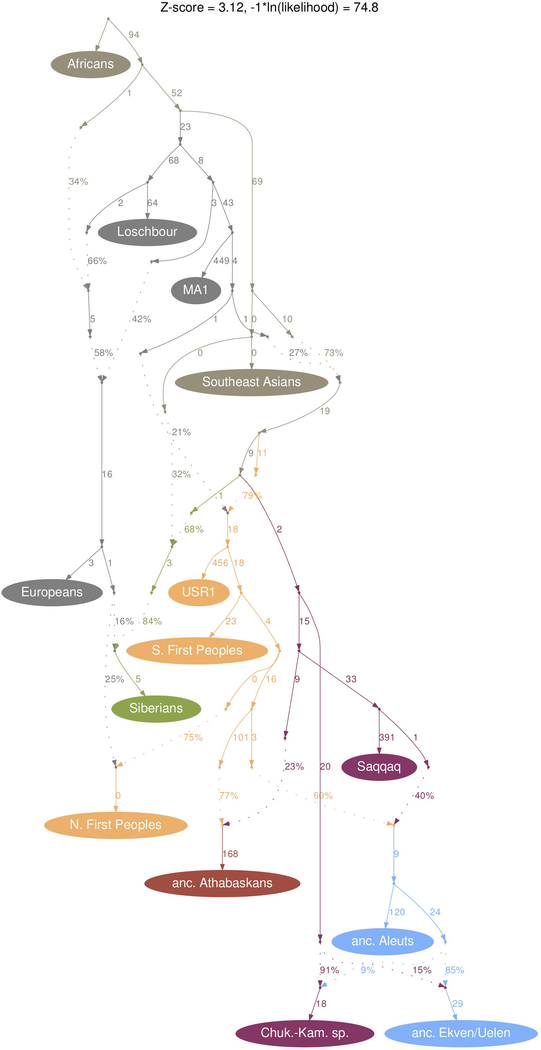
We used qpGraph to iteratively build a demographic model for the populations analyzed here (Supplementary Information section 10). To maximally explore the model space, at each stage in the model development we kept all fitting models connecting a given set of populations. We explicitly tested different topologies within the PPE clade, consisting of C-K, Eskimo-Aleuts (E-A), Athabaskans (ATH) and the ancient Saqqaq individual (SAQ). With 224 models tested, we found that the best-fitting topology of this clade has a grouping (C-K, (ATHPPE, (SAQ, E-APPE))) (Extended Data Fig. 7), with C-K splitting before the PPE source in Athabaskans. A key feature in our best-fitting model is bidirectional gene flow between C-K and Neo-Eskimo populations, but not affecting Aleuts, consistent with the qpWave and rare allele sharing analyses. We further investigated the population history of the Aleuts by co-analyzing Paleo- and Neo-Aleuts, which we find are consistent with one homogenous population according to PCA (Fig. 1a), ADMIXTURE (Extended Data Fig. 8) and allele sharing analyses (Supplementary Information section 11).
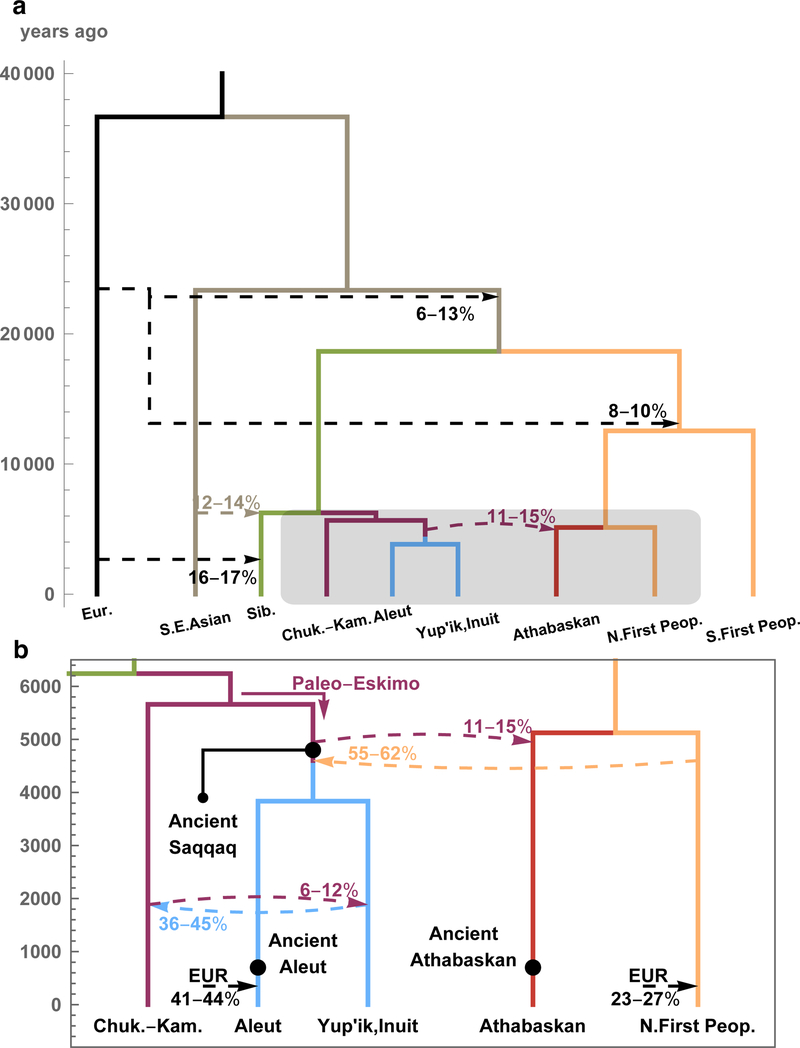
We then used Rarecoal to test the final graph topology obtained by qpGraph and to infer split times (Supplementary Information section 9). With our final model (Fig. 2), we find 4,900–6,200 ya for the time of divergence between the C-K and E-A lineages, and 4,400–5,000 ya for the time of the PPE gene flow into the ancestors of Athabaskans (11–15% PPE contribution), with the branch position of the Saqqaq individual immediately after that event. We then find that interactions with Northern First Peoples around 4,400–4,900 ya (consistent with estimates from ALDER, Supplementary Information section 12) led to this group contributing 55–62% genetic ancestry to ancestors of Eskimo-Aleut populations. Finally, we estimate 1,700–2,300 ya for the time of bidirectional gene flow between the C-K and E-A lineages (6–15% C-K contribution into E-A, 36–45% E-A into C-K; but see lower estimates in the qpGraph model, Extended Data Fig. 7). Our final model also contains substantial colonial-period European gene flow into present-day Aleuts (~41–44%) and Northern First Peoples (~23–27%). We note that our best-fitting topology differs from a previously published model with a PPE grouping of the form ((C-K, ATHPPE), (SAQ, E-APPE)), with C-K and the PPE source in Athabaskans being sister clades7. We compared this and other topologies with ours, and find that our proposed topology fits significantly better, according to various qpGraph-metrics and substantial likelihood differences reported by Rarecoal. Our model provides no evidence for Ancient Beringian ancestry in Athabaskans, which we explicitly tested using qpGraph, agreeing with the main model proposed by Moreno-Mayar et al.7 (Figure 3 of that study7, although see a contradicting model in Supplementary Section 18 of the same study7).
Figure 2. A demographic model based on 114 individuals from 9 meta-populations.
a) We used Rarecoal and qpGraph to test topologies and estimate split times and admixture edges (dashed). For a complete list of parameter estimates, including confidence intervals, see Supplementary Information section 9. b) A zoomed-in model for the last 6,000 years and 5 populations, highlighting the Holocene migrations and gene flow events between Asia and America. Maximum likelihood branching points of ancient genomes are indicated as solid dots. Times are scaled using a per-generation mutation rate28 of 1.25×10⁻⁸ and a generation time of 29 years29 (see Supplementary Information section 9).
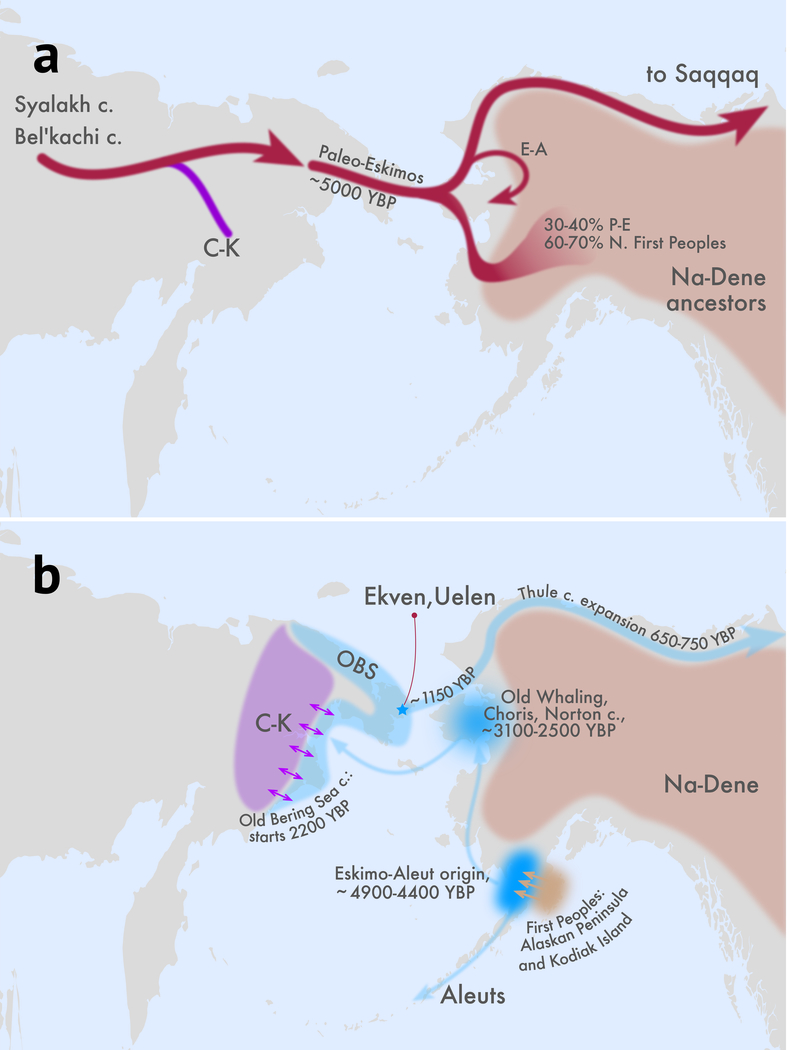
Figure 3. Archaeological and geographical interpretation of our model.
a) The topology drawn here reflects our best fitting-model of the proto-Paleo-Eskimo clade. The Paleo-Eskimo/Na-Dene gene flow we provisionally mapped across the boundary separating the ASTt and Northern Archaic cultures in Alaska, where the highest diversity of Na-Dene languages is found (for that reason Alaska was proposed as a Na-Dene homeland30). b) A model of population history for Eskimo-Aleut (E-A) speakers combining genetic and archaeological evidence. Their back-and-forth movement across the Bering Strait is illustrated, as well as the bidirectional gene flow between Yup’ik and Inuit ancestors (the Old Bering Sea culture, OBS) and Chukotko-Kamchatkan (C-K) speakers in Chukotka. In both panels, earliest dates in calBP are indicated for archaeological areas and migrations. Some migration paths are drawn to indicate general directions, but not actual routes of population spread.Methods
Genetic data can document the existence and timing of interactions such as the ones giving rise to ancestors of Eskimo-Aleut and Na-Dene speakers, but without ancient DNA directly from the times and places that they occurred it is impossible to pinpoint their geographic location. Based on archaeological evidence and parsimony, however, the most plausible scenario is that both gene flow events occurred in Alaska (Fig. 3), and we discuss the archaeological and linguistic implications of this model in the Supplementary Discussion and in Supplementary Information section 13. A priority for future work should be to analyze samples from Alaska dating to our proposed time windows of admixture in the 3rd millennium BCE.
Methods
Ancient DNA sampling, extraction and sequencing
In dedicated clean rooms at Harvard Medical School (the 11 Aleutian Islanders, 3 Tochak McGrath samples, and one Middle Dorset sample), and at University College Dublin (the 33 Chukotkan samples), we prepared powder from human skeletal remains, as described previously8. We extracted DNA using the Dabney et al.22 protocol, and prepared double-stranded barcoded libraries that were treated by uracil-DNA glycosylase to remove characteristic cytosine to thymine damage in ancient DNA using the Rohland et al.23 protocol. We enriched the libraries for a set of approximately 1.24 million SNPs24, and sequenced on an Illumina NextSeq instrument using 75 nt paired-end reads, which we merged before mapping to the human reference genome version hg19 (requiring at least 15 base pairs of overlap) (Supplementary Information section 3). We also carried out shotgun sequencing of one ancient Aleutian Islander individual and one ancient Athabaskan individual (Supplementary Table 1). The work with the ancient Native American individuals was conducted after consultation with local communities and authorities, and after formal permissions were granted. Results have been communicated in person and in writing to descendant communities.
Sampling present-day populations
Sampling of the Alaskan Iñupiat population (35 individuals) was performed with informed consent as described in Raff et al.16 (see also Supplementary Information section 1). Saliva samples of four West Siberian ethnic groups (Enets, Kets, Nganasans, Selkups, 58 individuals in total) were collected and DNA extractions were performed as described in Flegontov et al.31 (see also Supplementary Table 3). In the case of the West Siberian samples, the study was approved by the ethical committee of the Lomonosov Moscow State University (Russia). All volunteers have signed informed consent forms. The study was also approved by local administrations of the Taymyr and Turukhansk districts and discussed with local committees of small Siberian nations for observance of their rights and traditions. In the case of the Iñupiat, the study was approved by Northwestern University’s Institutional Review Board, after consultation with the Ukpeagvik Iñupiat Corporation, the Native Village of Barrow, and Senior Advisory Council of Barrow (Elders). Study participants have given informed consent, see Supplementary Information section 1.
Preparation of ancient genomic datasets
We made two types of genotype calls for ancient samples. First, for merging with the 1240K SNP capture dataset subsequently used for the qpGraph analysis, and for merging with the HumanOrigins and Illumina SNP array datasets, we made pseudo-haploid calls using a single randomly sampled read at each captured position. Second, for rare variant analysis (RASS and Rarecoal) we used only shotgun genomes (not exposed to SNP capture), and generated pseudo-haploid calls using the majority allele at sites covered by at least three reads. This ensures that all calls are supported by at least two reads, thus reducing the error rate. Sites covered by more than three reads were first downsampled to three reads, in order to reduce a subtle reference bias associated with the majority calling method for high coverage data. The majority call method with downsampling is implemented in the program pileupCaller available at https://www.github.com/stschiff/sequenceTools.
Dataset preparation for present-day genomes
To analyze rare allele sharing patterns, we composed a set of shotgun sequencing data covering Africa, Europe, Southeast Asia, Siberia, and the Americas: 190 individuals from 87 populations, including two shotgun genomes generated in this study (Supplementary Table 4). We assembled the dataset using two published sources: the Simons Genome Diversity Project32 and the modern genomes published in Raghavan et al.5 We used variant calls generated in the respective publications, keeping only biallelic autosomal SNPs that are covered in at least 90% of individuals in the respective datasets. Finally, we filtered out SNPs excluded by our mappability mask, generated as described by Li and Durbin33, and selected populations for the rare allele sharing and Rarecoal analyses as described in Supplementary Information sections 8 and 9, respectively. We also compiled another dataset by overlapping this genomic dataset with the SNP capture data at up to 1.24 million sites that we generated for ancient samples (Supplementary Table 1) and added pseudo-haploid data for the USR17, Saqqaq1, Clovis34, MA135, and Loschbour36 ancient individuals. We then selected populations for the qpGraph analysis as described in Supplementary Information section 10. Individual, population, and site counts and filtration setting for these datasets are presented in Supplementary Table 5.
We also assembled two independent SNP array datasets: see dataset compositions in Supplementary Table 4 and filter settings in Supplementary Table 5. Initially, we obtained phased autosomal genotypes for large worldwide collections of Affymetrix HumanOrigins (3,246 individuals) or Illumina (2,325 individuals) SNP array data (Supplementary Table 5), using ShapeIt v.2.20 with default parameters and without a guidance haplotype panel37. Then we applied missing rate thresholds for individuals (<50%) and SNPs (<5%) using PLINK v.1.90b3.3638. For ADMIXTURE39, PCA, and qpWave/qpAdm4,8 analyses, phasing was not performed, and more relaxed missing rate thresholds for ancient individuals were applied: 75% or 70% depending on the dataset (Supplementary Table 5). As a result, ancient individuals having >350,000 SNP sites genotyped on the 1240K panel were selected (Supplementary Table 1). This allowed us to include relevant ancient samples genotyped using the targeted enrichment approach. The Middle Dorset Paleo-Eskimo individual was included despite having a higher missing rate of 89–90% (depending on the dataset). For the ADMIXTURE analysis, unlinked SNPs were selected using linkage disequilibrium filtering with PLINK (Supplementary Table 5).
In the SNP datasets, we removed outliers manually considering results of an unsupervised ADMIXTURE39 analysis (K=14 or 11 in the case of the HumanOrigins and Illumina datasets, respectively) and weighted Euclidean distances. In ADMIXTURE, we inspected individuals for non-typical ancestry components (e.g. European in Native Americans). For the latter criterion, ten principal components (PC) were computed using PLINK v.1.90b3.36, and weighted Euclidean distances defined as
were calculated among individuals within populations (qi and pi refer to PCs from 1 to 10 in a population, is the corresponding eigenvalue). Individuals were identified as outliers if they had average weighted Euclidean distances from all other individuals in a population that were larger than [3rd quartile + 1.5 × (3rd quartile – 1st quartile)]. Manual removal of outliers based on ADMIXTURE profiles, i.e. on outstanding proportions of European and other non-typical ancestry components, was prioritized, and some individuals identified as outliers based on average weighted Euclidean distances were kept if they had a typical ADMIXTURE profile (see examples for the Ket, Nganasan, Tubalar, and Yup’ik Chaplin/Sireniki populations in the HumanOrigins dataset, Supplementary Information section 4). If a majority of individuals in a population had colonial admixture, we removed only those having the most extreme admixture proportions, in order to keep the final population size reasonably large (see examples for the Splatsin, Stswecem’c, Tlingit and other groups in the Illumina dataset, Supplementary Information section 4). Removal of outliers based on average weighted Euclidean distances was prioritized if all individuals had a uniform ADMIXTURE profile (see examples for the Karitiana, Mansi, Surui, Xavante, and Zapotec populations in the HumanOrigins dataset, Supplementary Information section 4). ADMIXTURE results, Euclidean distances, PC1 vs. PC2 plots, and outcomes of the outlier removal procedure for American and Siberian populations are presented in Supplementary Information section 4. We note that this outlier removal procedure preceded ChromoPainter v.126 and v.227, fineSTRUCTURE26, HSS, GLOBETROTTER27 analyses and the ADMIXTURE39 analyses presented in Extended Data Fig. 8.
In the case of some analyses relying on the Illumina SNP array dataset (ChromoPainter v.1, HSS), Na-Dene-speaking populations were exempt from the first round of outlier removal and from removal of supposed relatives identified by Raghavan et al.5 This was done to preserve maximal diversity of Na-Dene and to ensure that both Dakelh individuals with sequencing data available would be included. This exemption was applied only to analyses that operate on individuals independently. Outlier removal was also not applied to the whole genome datasets used in the RASS and Rarecoal analyses.
For the qpWave4, qpAdm8, qpGraph9, ALDER40, and f4-statistic9 analyses the first round of outlier removal was followed by a more stringent procedure. Any Native American individual with >1% European, African, or Southeast Asian ancestry according to ADMIXTURE (Extended Data Fig. 8) was removed, as well as Chukotkan and Kamchatkan individuals with >1% European ancestry. Some additional Chipewyan and West Greenlandic Inuit individuals were removed since European ancestry undetectable with ADMIXTURE was revealed in them using statistics D(Yoruba or Dai, Icelander; Chipewyan individual, Karitiana) and D(Yoruba or Dai, Slovak; West Greenlandic Inuit individual, Karitiana). Any individual with any of the two |Z|-scores >3 was removed. The outcome of the multi-step dataset pruning procedure that preceded the qpWave/qpAdm, f4-statistic, and ALDER analyses is illustrated by pairs of PCA plots presented in Fig. 1a and Supplementary Information section 4 and in Extended Data Fig. 2.
For some analyses, we combined groups into meta-populations, as indicated in Extended Data Fig. 1 and summarized in Supplementary Table 4. The breakdown of groups into these meta-populations was guided by unsupervised clustering using ADMIXTURE (Extended Data Fig. 8), fineSTRUCTURE (Extended Data Fig. 9), PCA (Fig. 1a, Extended Data Fig. 2, Supplementary Information section 4) and by contextual information in some cases. For naming the Arctic meta-populations, we use names of recognized language families: Na-Dene, Eskimo-Aleut, Chukotko-Kamchatkan. We chose these terms since genetic and linguistic relationship patterns are highly congruent in this region.
Finally, we selected relevant meta-populations, generating datasets of 489–1,184 individuals further analyzed with ADMIXTURE39, PCA as implemented in PLINK v.1.90b3.3638, qpWave/qpAdm4,8, ALDER40, ChromoPainter v.1 and fineSTRUCTURE26, ChromoPainter v.2 and GLOBETROTTER27 (Supplementary Tables 4 and 5). Populations having on average >5% of the Siberian ancestral component according to ADMIXTURE analysis (Extended Data Fig. 8), e.g. Finns and Russians, were excluded from the European and Southeast Asian meta-populations.
In order to test whether the datasets used in this study allow detecting substructure in the First Peoples and American Arctic populations, we divided each American population consisting of 2 or more individuals into two halves (equal, if possible) randomly and calculated the following f4-statistics: (Americani Half A, Americanj; Americani Half B, Dai). We show Z-scores for these statistics (Supplementary Table 6), and conclude that 6 dataset versions (HumanOrigins, 1240K, Illumina, with or without transition polymorphisms) have the power to distinguish American populations from each other. Population halves were matched correctly in 89% to 98% of cases, i.e. the f4-statistics were significantly positive (Z > 3).
ADMIXTURE analysis
The ADMIXTURE software39 implements a model-based Bayesian approach that uses a block-relaxation algorithm in order to compute a matrix of ancestral population fractions in each individual (Q) and infer allele frequencies for each ancestral population (P). A given dataset is usually modelled using various numbers of ancestral populations (K). We ran ADMIXTURE v.1.23 for the HumanOrigins-based and Illumina-based datasets of unlinked SNPs (Supplementary Table 5) using 10 to 25 and 5 to 20 K values, respectively. One hundred analysis iterations were generated with different random seeds. The best run was chosen according to the highest likelihood. An optimal value of K was selected using 10-fold cross-validation.
Principal component analysis (PCA)
PCA was performed using PLINK v.1.90b3.3638 with default settings. No pruning of linked SNPs was applied prior to this analysis (Supplementary Table 5), and almost identical results were obtained for pruned datasets.
Admixture modeling with qpWave and qpAdm
We used the qpWave v.310 tool (a part of AdmixTools v.4.1) to infer how many of streams of ancestry relate a set of test populations to a set of outgroups1. qpWave relies on a matrix of statistics f4(test1, testi; outgroup1, outgroupx). Usually, a few test populations from a certain region and a diverse worldwide set of outgroups (having no recent gene flow from the test region) are co-analyzed8,11,41, and a statistical test is performed to determine whether allele frequencies in the test populations can be explained by one, two, or more streams of ancestry derived from the outgroups. If a group of three populations, a triplet, is derived from two ancestry streams according to a qpWave test, and any pair of the constituent populations shows the same result, it follows that one of the populations can be modelled as having ancestry from the other two using another tool, qpAdm v.4018.
The following sets of outgroup populations were used for analyses on the HumanOrigins dataset: 1) “OG19”, 19 outgroups from five broad geographical regions: Mbuti, Taa, Yoruba (Africans), Nganasan, Tuvinian, Ulchi, Yakut (East Siberians), Altaian, Ket, Selkup, Tubalar (West Siberians), Czech, English, French, North Italian (Europeans), Dai, Miao, She, Thai (Southeast Asians); 2) “OG19_UB1526”, OG19 and an ancient Siberian individual I1526 (the highest-coverage individual at the Ust’-Belaya Angara site) that is distinct from the other Siberians according to our PCA analyses (Fig. 1a) and thus might increase the diversity of Siberian outgroups and the resolution of the method; 3) “OGA”, 8 diverse Siberian populations (Nganasan, Tuvinian, Ulchi, Yakut, Even, Ket, Selkup, Tubalar) and a Southeast Asian population (Dai); 4) “OGA_Koryak”, OGA and Koryak, a Chukotko-Kamchatkan-speaking group that supposedly provides higher resolution since it is closely related to the putative PPE admixture partners (Supplementary Information section 10); 5) “OGA_UB1526”, OGA and the Ust’-Belaya Angara individual I1526.
Similar sets of outgroup populations were used for analyses on the Illumina dataset: 1) “OG20”: Bantu (Kenya), Mandenka, Mbuti, Yoruba (Africans), Buryat, Evenk, Nganasan, Tuvinian, Yakut (East Siberians), Altaian, Khakas, Selkup (West Siberians), Basque, Sardinian, Slovak, Spanish (Europeans), Dai, Lahu, Miao, She (Southeast Asians); 2) “OG20_UB1526”, OG20 and the highest-coverage Ust’-Belaya Angara individual I1526; 3) “OGA”, 9 Siberian populations (Buryat, Dolgan, Evenk, Nganasan, Tuvinian, Yakut, Altaian, Khakas, Selkup) and Dai; 4) ”OGA_Koryak”, OGA and Koryak; 5) “OGA_UB1526”, OGA and the Ust’-Belaya Angara individual I1526.
All possible triplets of the form (First Peoples or Na-Dene population; Eskimo-Aleut population; Paleo-Eskimo or Chukotko-Kamchatkan population) and quadruplets of the form (First Peoples pop.; Na-Dene pop.; Eskimo-Aleut pop.; Paleo-Eskimo or Chukotko-Kamchatkan pop.) were tested with qpWave for both the HumanOrigins and Illumina SNP array datasets, with or without transition polymorphisms, and using five alternative outgroup sets. The Koryak outgroup was not tested for population triplets/quadruplets including Chukotko-Kamchatkan speakers since such models are expected to be non-fitting by default. For admixture inference with qpAdm, all possible triplets of the form (any American, Chukotkan or Kamchatkan pop.; Paleo-Eskimo or Chukotko-Kamchatkan pop.; Guarani, Karitiana, or Mixe) were considered in the case of the HumanOrigins dataset, and all possible triplets of the form (any American, Chukotkan or Kamchatkan pop.; Paleo-Eskimo or Chukotko-Kamchatkan pop.; Karitiana, Mixtec, Nisga’a, or Pima) were considered in the case of the Illumina dataset. Paleo-Eskimos were represented by the Saqqaq (ca. 3,900 calBP), Middle Dorset (ca. 1,750 calBP), and Late Dorset individuals (ca. 750 calBP), widely separated in space and time, and two types of SNP calls were tested for the Saqqaq individual: published diploid calls2 with 50–58% missing rates (in various dataset versions) and pseudo-haploid calls with much lower missing rates of 4–11% (in various dataset versions) generated by us. See further details in Supplementary Information section 5.
fineSTRUCTURE clustering
We used fineSTRUCTURE v.2.0.7 with default parameters to analyze the output of ChromoPainter v.126. Clustering trees of individuals were generated by fineSTRUCTURE based on counts of shared haplotypes26, and two independent iterations of the clustering algorithm were performed. The clustering trees and coancestry matrices were visualized using fineSTRUCTURE GUI v.0.1.026.
Haplotype sharing statistics
The Haplotype Sharing Statistic (HSSAB) is defined as the total genetic length of DNA (in cM) that a given individual A shares with individual Bj under the model26,27. HSSAB was computed in the all vs. all manner by ChromoPainter v.126 running with default parameters, and in practice we summed up the length of DNA that individual A copied from individual Bj and the length of DNA copied in the opposite direction (from Bj to A), i.e. we disregarded the donor/recipient distinction introduced by the ChromoPainter software. For each individual A (in practice an American individual), HSSAB values were averaged across all individuals of a reference population B (the Siberian or Arctic meta-population, or the Saqqaq ancient genome1), and then normalized by the haplotype sharing statistic HSSAC for the European, African, or Siberian outgroup C. The resulting statistics HSSAB/HSSAC are referred to as Siberian, Arctic, or Saqqaq relative haplotype sharing, and were visualized for separate individuals. Similar statistics were calculated for Siberian and Arctic individuals using the leave-one-out procedure. Relative HSSs for recently admixed populations, with ancestry from population A and population B, were calculated in the following way: a×HSSAC/HSSAD + b×HSSBC/HSSBD, where a and b are admixture proportions being simulated in steps of 5%. See further details in Supplementary Information section 6.
Dating admixture events using haplotype sharing statistics
We used GLOBETROTTER27 (a version of May 27, 2016) to infer and date up to two admixture events in the history of Na-Dene-speaking populations. To detect subtle signals of admixture between closely related source populations, we followed the ‘regional’ analysis protocol of Hellenthal et al.27 Using ChromoPainter v.227, chromosomes of a target Na-Dene population were ‘painted’ as a mosaic of haplotypes derived from donor populations or meta-populations: the Saqqaq ancient genome, Chukotko-Kamchatkan groups, Eskimo-Aleuts, Northern First Peoples, Southern First Peoples, West Siberians, East Siberians, Southeast Asians, and Europeans. Target individuals were considered as haplotype recipients only, while other populations or meta-populations were considered as both donors and recipients. That is different from the ChromoPainter v.1 approach, where all individuals were considered as donors and recipients of haplotypes at the same time, and only self-copying was forbidden.
Painting samples for the target population and ‘copy vectors’ for other (meta)populations called ‘surrogates’ served as an input of GLOBETROTTER, which was run according to section 6 of the instruction manual of May 27, 2016. The following settings were used: no standardizing by a “NULL” individual (null.ind 0); five iterations of admixture date and proportion/source estimation (num.mixing.iterations 5); at each iteration, any surrogates that contributed ≤ 0.1% to the target population were removed (props.cutoff 0.001); the x-axis of coancestry curves spanned the range from 0 to 50 cM (curve.range 1 50), with bins of 0.1 cM (bin.width 0.1). Confidence intervals (95%) for admixture dates were calculated based on 100 bootstrap replicates. Alternatively, when using separate populations as haplotype donors, the setting ‘standardizing by a “NULL” individual’ was turned on to take account for potential bottleneck effects. A generation time of 29 years was used in all dating calculations5,29.
The GLOBETROTTER software is able to date no more than two admixture events26, and we therefore had to reduce the complexity of original Na-Dene populations that likely experienced more than two major waves of admixture. For that purpose, only a subset of Na-Dene individuals was used for the GLOBETROTTER analysis: those with prior evidence of elevated Paleo-Eskimo ancestry (Supplementary Information section 6) and with <10% West Eurasian ancestry estimated with ADMIXTURE (Extended Data Fig. 8). We also performed a similar analysis with ALDER (Supplementary Information section 12).
Rare allele sharing statistics
To quantify rare allele sharing, we developed the rare allele sharing statistics (RASS). Essentially, RASS is similar to outgroup f3-statistic, but ascertained on rare “non-outgroup” alleles in a set of reference populations. Specifically, we define
where the sum runs over all sites with derived allele count below some cutoff (say 5 or less) within the Reference and Outgroup populations, xi is the derived allele frequency in the test individual, yi is the derived allele frequency in the reference population, and L is the number of sites in the sum (excluding missing data). Here, the Outgroup (the African meta-population) is used to polarize derived vs. ancestral alleles: We look at the outgroup population, and take the majority allele in that outgroup population to specify which should be the majority allele for the ascertainment. If the majority of outgroup chromosomes have the non-reference allele, then the ascertainment is done on the reference allele being rare (instead of the non-reference allele). Standard errors are computed using a chromosome-wise weighted Block-Jackknife. See Supplementary Information section 8 for details. We note that this method - in contrast to PCA - is not affected by genetic drift within the test individuals since the ascertainment on allele frequency is carried out only in the reference populations. Source code for the programs used to perform rare allele sharing analysis is available under https://github.com/TCLamnidis/RAStools and https://github.com/stschiff/rarecoal-tools.
Demographic modeling
We used the qpGraph method9 to explore models that are consistent with f-statistics. We started using qpGraph v.5052 to build a backbone graph of eight populations representing almost all major branches of human ancestry (African, European, Southeast Asian, Siberian, Chukotko-Kamchatkan (C-K), Eskimo-Aleut (E-A), Athabaskan (ATH), First Peoples) (Supplementary Information section 10). One difficulty in estimating admixture graphs for closely related populations, such as the ones studied here, is the fact that typically many different graphs fit the data equally well. We therefore used an iterative approach in which we kept not only the best-fitting model at each stage in the model development, but all fitting models connecting a given set of populations. We then used this backbone graph to map several ancient populations on it, and in particular varied all possible topologies of the subgraph connecting C-K, Saqqaq (SAQ), ancient E-A and ATH. With 224 models tested (varying both the ancient Neo-Eskimo population as well as the PPE topology), we found that the best-fitting topology of this proto-Paleo-Eskimo clade had Chukotko-Kamchatkan speakers splitting off first, then the PPE-admixture source in Athabaskans, then the ancient Saqqaq, and then the PPE-source in ancient Eskimo-Aleuts: (C-K, (ATHPPE, (SAQ, E-APPE))) (see Supplementary Information section 10). We further confirmed these models by testing 133,380 models derived from the main model, but replacing the meta-populations by concrete populations (see Supplementary Information section 10).
We used a newly developed version of the Rarecoal program10 (https://github.com/stschiff/rarecoal) to derive a timed admixture graph for meta-populations (Fig. 2 and Supplementary Information section 9). We started with a simple graph connecting Europeans, Southeast Asians, and Southern First Peoples, and inferred maximum likelihood branch population sizes and split times. We then iteratively added Core Siberians, and Chukotko-Kamchatkan, Northern First Peoples, Aleut, Yup’ik/Inuit, and Northern Athabaskan groups. After each addition, we re-optimized the tree and inspected the fits of the model to the data. When we observed a significant deviation between model and data for a particular pairwise allele sharing probability, we added admixture edges (Supplementary Information section 9), which were in all cases consistent with the final qpGraph model graph. We then tested several positions for the Saqqaq genome to merge onto the tree, and found that the maximum likelihood position was one where Saqqaq merges on the common ancestor of Eskimo-Aleut branches, before interactions with Northern Peoples but after the gene flow from that same lineage into Athabaskans (see Fig. 2b). We also derived confidence intervals and corrected likelihood model comparisons using a correction for genetic linkage correlations in the data, using a Jackknife procedure, as described in Supplementary Information section 9. We then also mapped the ancient Aleut and ancient Athabaskan individuals onto the tree.
Extended Data
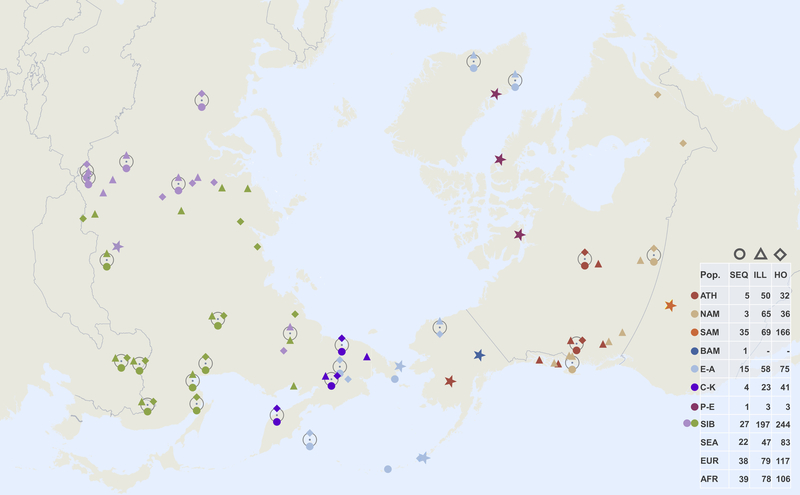
Extended Data Figure 1: Geographic locations of Siberian and North American populations used in this study.
Three main datasets are as follows (Supplementary Tables 4, 5): 1) a set based on the Affymetrix Human Origins genotyping array, including alternatively pseudo-haploid or diploid genotypes for the ancient Saqqaq individual1, diploid genotypes for the ancient Clovis34 individual, together with 1240K SNP capture pseudo-haploid data from six ancient Aleuts who had the highest coverage, two unrelated ancient Athabaskans, 19 ancient Chukotkan Old Bering Sea individuals from the Ekven and Uelen sites, the Middle Dorset and Late Dorset Paleo-Eskimo individuals, and the ancient Ust’-Belaya Angara population of 9 individuals (Supplementary Table 1); 2) a set based on various Illumina arrays, including Saqqaq and the other ancient samples, and 3) a whole genome data set of 190 individuals from 87 populations, including the Saqqaq individual, one ancient Athabaskan individual (I5319), and one ancient Aleut individual (I0719), for which we generated complete genomes with 6.1x and 2.3x coverage, respectively (Supplementary Table 1). The dataset composition, i.e. number of individuals in each meta-population, is shown in the table on the right. Locations of samples with whole genome sequencing data (SEQ) are shown with circles, and those of Illumina (ILL) and HumanOrigins (HO) SNP array samples with triangles and diamonds, respectively. Meta-populations are color-coded in a similar way throughout all figures and designated as follows: Na-Dene speakers (abbreviated as ATH), other northern Native Americans, alternatively named First Peoples (NAM), Southern First Peoples (SAM), Basal First Peoples (BAM), Eskimo-Aleut speakers (E-A), Chukotko-Kamchatkan speakers (C-K), Paleo-Eskimos (P-E), West and East Siberians (WSIB and ESIB), Southeast Asians (SEA), Europeans (EUR), and Africans (AFR). Locations of the Saqqaq, Dorset and other ancient samples are shown as stars colored to reflect their meta-population affiliation.
Extended Data Figure 2. Principal component analysis (PCA) based on the Illumina dataset.
A plot of two principal components (PC1 vs. PC2) calculated by PLINK2 is shown (linkage disequilibrium pruning was not applied). No outliers were excluded for this analysis based on 642 individuals and 524,830 loci. The following meta-populations most relevant for our study are plotted: present-day Eskimo-Aleut and Chukotko-Kamchatkan speakers, ancient Chukotkan Neo-Eskimos (Ekven and Uelen sites), ancient Aleuts, Paleo-Eskimos (the Saqqaq, Middle Dorset and Late Dorset individuals), ancient Northern Athabaskans, present-day Na-Dene speakers, northern and Southern First Peoples, West and East Siberians, the Ust’-Belaya Angara ancient Siberian population, Southeast Asians, and Europeans. Calibrated radiocarbon dates in YBP are shown for ancient samples. For individuals, 95% confidence intervals are shown, and for populations, minimal and maximal median dates among individuals are shown.
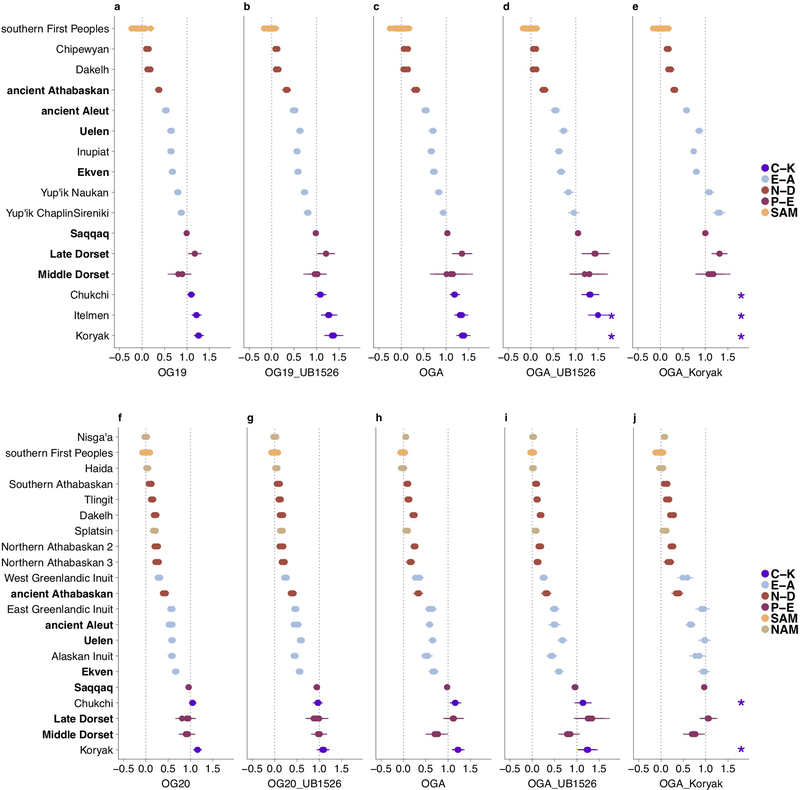
Extended Data Figure 3. Ancestry proportions in American, Chukotkan and Kamchatkan populations.
Shown are the HumanOrigins (a-e) and Illumina (f-j) datasets without transition polymorphisms. Five alternative outgroup sets are indicated below the plots and described in detail in Methods and in Supplementary Information section 5. Target populations in bold denote ancient populations. Saqqaq (pseudo-haploid genotype calls) was considered as a Paleo-Eskimo source for all populations apart from Saqqaq itself, for which Late Dorset was used as a source, and alternative First American sources were as follows: Mixe, Guarani, or Karitiana for the HumanOrigins dataset; Nisga’a, Mixtec, Pima, or Karitiana for the Illumina dataset. To visualize both systematic and statistical errors, ancestry proportions inferred by qpAdm and their standard errors are shown for all triplets including these different First Peoples sources, or for many alternative target populations in the case of Southern First Peoples (single standard error intervals are plotted here). Asterisks stand for ancestry proportions >150% (inappropriate models). Meta-populations are color-coded and abbreviated as follows: C-K, Chukotko-Kamchatkan speakers; E-A, Eskimo-Aleut speakers and ancient Neo-Eskimos and ancient Aleuts; N-D, Na-Dene speakers; NAM, Northern First Peoples; SAM, Southern First Peoples. Target population sizes in the HumanOrigins dataset ranged from 1 to 23 individuals, 5.6 on average, and in the Illumina dataset they ranged from 1 to 16 individuals, 5.1 on average.
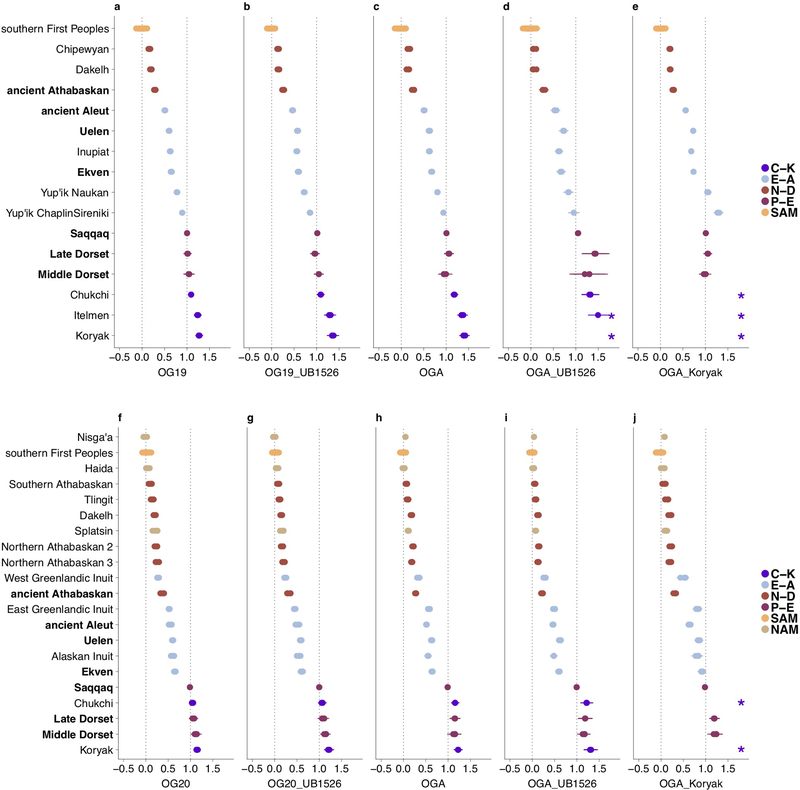
Extended Data Figure 4. Ancestry proportions in American, Chukotkan and Kamchatkan populations.
Similar analysis as in Extended Data Fig. 3, but including transition polymorphisms. Target population sizes in the HumanOrigins dataset (a-e) ranged from 1 to 23 individuals, 5.6 on average, and in the Illumina dataset (f-j) they ranged from 1 to 16 individuals, 5.1 on average.
Extended Data Figure 5. Relative Saqqaq, Arctic, and European haplotype sharing statistics (HSS) for American individuals.
Results are shown for the Human Origins (a) and Illumina (b) datasets, normalized using the African meta-population. Both Eskimo-Aleut- and Chukotko-Kamchatkan-speaking groups contributed to the Arctic HSS. The same statistics and statistics with other normalizers are shown in the form of two-dimensional plots in Supplementary Information section 6. Two Dakelh (Northern Athabaskan) individuals with whole-genome sequencing data5 were included in both datasets and marked by asterisks. The plots based on both datasets demonstrate that Na-Dene speakers have the highest relative Saqqaq HSS. One Haida and three Splatsin individuals also demonstrate outlying Saqqaq HSSs (b), however these individuals stand in contrast to a majority of non-Na-Dene Northern First Peoples, and Paleo-Eskimo ancestry in these individuals may be explained by recent interaction with Na-Dene speakers living in close proximity42. The Haida outlier demonstrates a maximal Arctic HSS among all First Peoples, and its Arctic ancestry has contributed to its elevated Saqqaq HSS. Saqqaq, Arctic and European statistics are largely uncorrelated in First Peoples: Pearson’s correlation coefficients for Saqqaq vs. Arctic relative HSSs are 0.56 among all First Peoples and 0.64 among Northern First Peoples in the case of the Illumina dataset, and 0.66 and 0.72, respectively, in the case of the HumanOrigins dataset.
Extended Data Figure 6. Rare allele sharing analysis.
A two-dimensional plot of Chukotko-Kamchatkan (C-K) and Siberian (SIB) rare allele sharing statistics for First Peoples, Na-Dene-speaking, Eskimo-Aleut-speaking, and Paleo-Eskimo individuals. Rare alleles occurring from 2 to 5 times in the reference set of 238 haploid genomes (0.8–2.1% frequency) contributed to the statistics; the Chukchi individual was dropped from the C-K reference group, and the transversion-only dataset was used. Thus, this analysis was based on 918,474 loci. The sample size for this analysis equals 238 + 2 haploid genomes in a target individual since individuals were analyzed separately. Standard deviations were calculated using a jackknife approach with chromosomes used as resampling blocks. Single standard error intervals and means are plotted. Populations and meta-populations are color-coded according to the legend. Rare allele sharing statistics for simulated mixtures of any present-day southern Native American individual and the Saqqaq individual (from 5% to 75% Saqqaq ancestry, with 5% increments) are plotted as semi-transparent pink circles. Plots for the 2 to 10 allele frequency range and other versions are shown in Supplementary Information section 8.
Extended Data Figure 7. An admixture graph connecting various modern meta-populations and ancient populations or individuals.
As derived in Supplementary Information section 10, the graph features a simplified three-component model for Europeans as previously suggested36 and two gene flows from a European lineage related to the ancient Siberian genome MA-135 into Native Americans and Siberians. The topology within the proto-Paleo-Eskimo clade was obtained by cycling through dozens of trees with all possible topologies of branches and admixture edges and selecting the one with the highest support and no 0-length edges within the proto-Paleo-Eskimo clade.
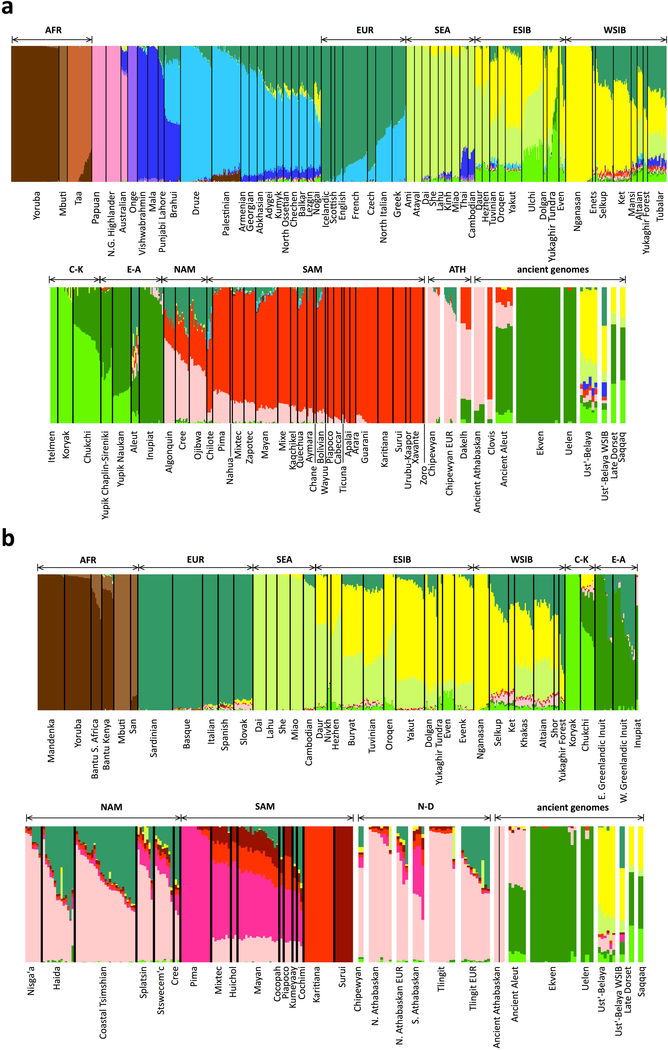
Extended Data Figure 8. ADMIXTURE analysis.
Shown are results for the HumanOrigins (a) and Illumina (b) SNP array datasets. The number of source populations in ADMIXTURE is 14 and 11, respectively. One hundred iterations were calculated for each value of K from 5 to 20 (where K is the number of ancestral populations), and the optimal K values were selected based on ten-fold cross-validation. Contributions from hypothetical ancestral populations are color-coded, and meta-populations used in this study are indicated above the plot: AFR, Africans; EUR, Europeans; SEA, Southeast Asians; ESIB, East Siberians; WSIB, West Siberians; C-K, Chukotko-Kamchatkan speakers; E-A, Eskimo-Aleut speakers; NAM, northern First Peoples; SAM, Southern First Peoples; ATH, Northern Athabaskan speakers; N-D, Na-Dene speakers. Chipewyan or Northern Athabaskan and Tlingit individuals with European admixture are plotted in separate bars, as well as ancient individuals: Clovis, Northern Athabaskans, Aleuts, Chukotkan Neo-Eskimos (Ekven and Uelen sites), Saqqaq and Late Dorset Paleo-Eskimos, and a genetically heterogeneous Ust’-Belaya Angara Siberian population (Ust’-Belaya WSIB, an undated individual I7760 having a West Siberian genetic profile according to PCA and this ADMIXTURE analysis; Ust’-Belaya, the remaining 8 individuals from the Ust’-Belaya Angara site having a distinct genetic profile according to our PCA analysis). Outliers, including individuals admixed with Europeans and East Asians, were not removed from Na-Dene-speaking populations in the Illumina dataset (b) to preserve their maximal diversity. Outliers were removed for the purpose of other analyses (qpAdm, f4-statistics, etc.) that rely on pre-defined populations.
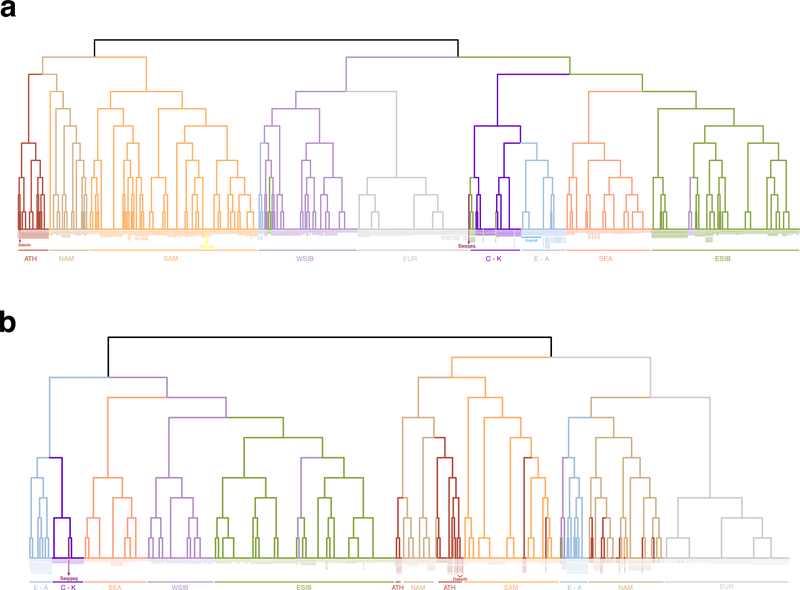
Extended Data Figure 9. Clustering trees of individuals computed by fineSTRUCTURE.
The trees are based on coancestry matrices of counts of shared haplotypes. Reduced versions of the HumanOrigins (a) and Illumina (b) SNP array datasets were used (Supplementary Table 5), including only the following meta-populations most relevant for our study: Eskimo-Aleut speakers (E-A), Chukotko-Kamchatkan speakers (C-K), Na-Dene speakers (ATH), northern First Americans or First Peoples (NAM), Southern First Peoples (SAM), West Siberians (WSIB), East Siberians (ESIB), Southeast Asians (SEA), Europeans (EUR). Meta-population affiliation is color-coded for individuals. Iñupiat individuals genotyped in this study are marked with a blue line. The two Dakelh (Northern Athabaskan) individuals with sequenced genomes and the ancient individuals, Clovis within the Southern First Peoples clade and Saqqaq within the Chukotko-Kamchatkan clade, are also indicated. Most members of each clade belong to the meta-populations indicated, with a few exceptions. First (see panel a), Altaians fall into the ESIB clade, some Chilote fall into the NAM, and Aleuts fall into the WSIB clades (two latter cases might be explained by extensive European ancestry in Chilote and in Aleuts (Extended Data Fig. 8a) which drives this clustering). Second (see panel b), some Selkups fall into the ESIB clade, all four Southern Athabaskan speakers cluster with South Americans, reflecting their substantial South American ancestry (Extended Data Fig. 8b), one Haida individual clusters with Na-Dene speakers, and five Northern Athabaskan speakers cluster with other Northern First Peoples.
Supplementary Material
Acknowledgements
We acknowledge the Aleut Corporation, the Aleutians Pribilof Islands Association, and the Chaluka Corporation for granting permissions to conduct genetic analyses on the eastern Aleutians. We thank the staff at the Smithsonian Institution’s National Museum of Natural History for facilitating the sample collection. Sample collection and the initial molecular, isotopic and AMS 14C dating of the samples described here were funded by National Science Foundation Office of Polar Program grants OPP-9726126, OPP-9974623, and OPP-0327641, by the Natural Sciences and Engineering Research Council of Canada, and the Wenner-Gren Foundation for Anthropological Research (#6364). We are also grateful to the McGrath Native Village Council and MTNT Ltd. for granting permissions to conduct genetic analyses on the Tochak McGrath remains, and to Jamie Clark, who performed biological age estimates on these remains. We thank the research participants in Alaska (Genetics of Alaskan North Slope (GeANS) project funded by NSF OPP-0732857) and West Siberia who donated samples for genome-wide analysis. We are grateful to Joan Brenner Coltrain for sharing data on stable isotopes. We thank John W. Ives, Justin Tackney, Lauren Norman, and Kim TallBear for comments on earlier drafts of this paper. This work was supported by the Czech Ministry of Education, Youth and Sports from the project “IT4Innovations National Supercomputing Center – LM2015070”. P.F., P.C., O.F., and E.A. were supported by the Institutional Development Program of the University of Ostrava. P.F. and P.C. were supported by the EU Operational Programme “Research and Development for Innovations” (CZ.1.05/2.1.00/19.0388). P.C. was also supported by the Statutory City of Ostrava (0924/2016/ŠaS) and the Moravian-Silesian Region (01211/2016/RRC). P.S. was funded by the Francis Crick Institute which receives its core funding from Cancer Research UK (FC001595), the UK Medical Research Council (FC001595), and the Wellcome Trust (FC001595). D.R. was funded by NSF HOMINID grant BCS-1032255, NIH (NIGMS) grant GM100233, by an Allen Discovery Center of the Paul Allen Foundation, and is an Investigator of the Howard Hughes Medical Institute. D.A.B. was supported by a Norman Hackerman Advanced Research Program grant from the Texas Higher Education Coordinating Board. AMS 14C work at Pennsylvania State University by D.J.K. and B.J.C was funded by the NSF Archaeometry program (BCS-1460369). C.J., T.C.L., J.K. and S.S. were supported by the Max Planck Society.
Footnotes
Supplementary Information is available in the online version of the paper
Data Availability Statement: Raw sequence data (bam files) from the 48 newly reported ancient individuals are available from the European Nucleotide Archive under accession number PRJEB30575. The genotype data for the Iñupiat were obtained through informed consent that is not consistent with providing the data through public or controlled access data repositories, analyses of phenotypic traits, or commercial use of the data. In order to protect the privacy of participants and ensure that their wishes with respect to data usage are followed, researchers wishing to use data from the Iñupiat samples should contact Geoffrey Hayes (ghayes@northwestern.edu) and Deborah Bolnick (deborah.bolnick@uconn.edu), who can then arrange to share the data with researchers who can affirm that they will abide by these conditions through a signed data sharing agreement. The newly reported SNP genotyping data for West Siberians (Enets, Kets, Nganasans, Selkups) is publicly available at the Edmond database, under the permalink https://dx.doi.org/10.17617/3.1z.
Code Availability
Custom code used in this manuscript is available at dedicated github repositories: Rarecoal (https://github.com/stschiff/rarecoal), rarecoal-tools (https://github.com/stschiff/rarecoal-tools) and RAS-tools (https://github.com/TCLamnidis/RAStools).
The authors declare no conflicting financial interests.
References
- 1.Rasmussen M et al. Ancient human genome sequence of an extinct Palaeo-Eskimo. Nature 463, 757–762 (2010). [DOI] [PMC free article] [PubMed] [Google Scholar]
- 2.Raghavan M et al. The genetic prehistory of the New World Arctic. Science 345, 1255832 (2014). [DOI] [PubMed] [Google Scholar]
- 3.Friesen TM Pan-Arctic population movements: the early Paleo-Inuit and Thule Inuit migrations The Oxford Handbook of the Prehistoric Arctic, ed. Friesen TM, Mason OK New York: Oxford University Press; 673–692 (2016). [Google Scholar]
- 4.Reich D et al. Reconstructing Native American population history. Nature 488, 370–374 (2012). [DOI] [PMC free article] [PubMed] [Google Scholar]
- 5.Raghavan M et al. Genomic evidence for the Pleistocene and recent population history of Native Americans. Science 349, 1–20 (2015). [DOI] [PMC free article] [PubMed] [Google Scholar]
- 6.Scheib CL et al. Ancient human parallel lineages within North America contributed to a coastal expansion. Science 360, 1024–1027 (2018). [DOI] [PubMed] [Google Scholar]
- 7.Moreno-Mayar JV et al. Terminal Pleistocene Alaskan genome reveals first founding population of Native Americans. Nature 553, 203–207 (2018). [DOI] [PubMed] [Google Scholar]
- 8.Haak W et al. Massive migration from the steppe was a source for Indo-European languages in Europe. Nature 522, 207–211 (2015). [DOI] [PMC free article] [PubMed] [Google Scholar]
- 9.Patterson N et al. Ancient admixture in human history. Genetics 192, 1065–1093 (2012). [DOI] [PMC free article] [PubMed] [Google Scholar]
- 10.Schiffels S et al. Iron Age and Anglo-Saxon genomes from East England reveal British migration history. Nat. Commun 7, 10408 (2016). [DOI] [PMC free article] [PubMed] [Google Scholar]
- 11.Skoglund P et al. Genetic evidence for two founding populations of the Americas. Nature 525, 104–108 (2015). [DOI] [PMC free article] [PubMed] [Google Scholar]
- 12.Moreno-Mayar JV et al. Early human dispersals within the Americas. Science, doi: 10.1126/science.aav2621 (2018). [DOI] [PubMed] [Google Scholar]
- 13.Posth C et al. Reconstructing the deep population history of Central and South America. Cell 175, 1185–1197.e22 (2018). [DOI] [PMC free article] [PubMed] [Google Scholar]
- 14.Potter BA et al. Early colonization of Beringia and Northern North America: Chronology, routes, and adaptive strategies. Quat. Int 444B, 36–55 (2017). [Google Scholar]
- 15.Llamas B et al. Ancient Mitochondrial DNA Provides High-Resolution Time Scale of the Peopling of the Americas. Science Advances 2 (4): e1501385–e1501385 (2016). [DOI] [PMC free article] [PubMed] [Google Scholar]
- 16.Raff JA, Rzhetskaya M, Tackney J & Hayes MG Mitochondrial diversity of Iñupiat people from the Alaskan North Slope provides evidence for the origins of the Paleo- and Neo-Eskimo peoples. Am. J. Phys. Anthropol 157, 603–614 (2015). [DOI] [PubMed] [Google Scholar]
- 17.Friesen TM On the naming of Arctic archaeological traditions: The case for Paleo-Inuit. Arctic 68, iii–iv (2015). [Google Scholar]
- 18.Park RW The Dorset-Thule transition The Oxford Handbook of the Prehistoric Arctic, ed. Friesen TM, Mason OK New York: Oxford University Press; 417–442 (2016). [Google Scholar]
- 19.Prentiss AM, Walsh MJ, Foor TA & Barnett KD Cultural macroevolution among high latitude hunter–gatherers: a phylogenetic study of the Arctic Small Tool tradition. J. Archaeol. Sci. 59, 64–79 (2015). [Google Scholar]
- 20.Tremayne AH & Rasic JT The Denbigh Flint Complex of Northern Alaska The Oxford Handbook of the Prehistoric Arctic, ed. Friesen TM, Mason OK. New York: Oxford University Press; 303–322 (2016). [Google Scholar]
- 21.Friesen TM Contemporaneity of Dorset and Thule cultures in the North American Arctic: new radiocarbon dates from Victoria Island, Nunavut. Curr. Anthropol 45, 685–691 (2004). [Google Scholar]
- 22.Dabney J et al. Complete mitochondrial genome sequence of a Middle Pleistocene cave bear reconstructed from ultrashort DNA fragments. Proc. Natl. Acad. Sci. U. S. A 110, 15758‒15763 (2013). [DOI] [PMC free article] [PubMed] [Google Scholar]
- 23.Rohland N, Harney E, Mallick S, Nordenfelt S & Reich D Partial uracil-DNA-glycosylase treatment for screening of ancient DNA. Philos. Trans. R. Soc. Lond. B Biol. Sci 370, 20130624 (2015). [DOI] [PMC free article] [PubMed] [Google Scholar]
- 24.Fu Q et al. An early modern human from Romania with a recent Neanderthal ancestor. Nature 524, 216–219 (2015). [DOI] [PMC free article] [PubMed] [Google Scholar]
- 25.Bardill J et al. Advancing the ethics of paleogenomics. Science 360, 384–385 (2018). [DOI] [PMC free article] [PubMed] [Google Scholar]
- 26.Lawson DJ, Hellenthal G, Myers S & Falush D Inference of population structure using dense haplotype data. PLoS Genet. 8, 11–17 (2012). [DOI] [PMC free article] [PubMed] [Google Scholar]
- 27.Hellenthal G et al. A genetic atlas of human admixture. Science 343, 747–751 (2014). [DOI] [PMC free article] [PubMed] [Google Scholar]
- 28.Scally A & Durbin R Revising the human mutation rate: implications for understanding human evolution. Nat. Rev. Genet 13, 745–753 (2012). [DOI] [PubMed] [Google Scholar]
- 29.Fenner JN Cross-cultural estimation of the human generation interval for use in genetics-based population divergence studies. Am. J. Phys. Anthropol 128, 415–423 (2005). [DOI] [PubMed] [Google Scholar]
- 30.Kari J The concept of geolinguistic conservatism in Na-Dene prehistory The Dene-Yeniseian Connection, ed. Kari J, Potter BA Anthropological Papers of the University of Alaska: New Series 5, 194–222 (2010). [Google Scholar]
Additional references for Methods:
- 31.Flegontov P et al. Genomic study of the Ket: A Paleo-Eskimo-related ethnic group with significant ancient North Eurasian ancestry. Sci. Rep 6, 20768 (2016). [DOI] [PMC free article] [PubMed] [Google Scholar]
- 32.Mallick S et al. The Simons Genome Diversity Project: 300 genomes from 142 diverse populations. Nature 538, 201–206 (2016). [DOI] [PMC free article] [PubMed] [Google Scholar]
- 33.Li H & Durbin R Inference of human population history from individual whole-genome sequences. Nature 475, 493–496 (2011). [DOI] [PMC free article] [PubMed] [Google Scholar]
- 34.Rasmussen M et al. The genome of a Late Pleistocene human from a Clovis burial site in western Montana. Nature 506, 225–229 (2014). [DOI] [PMC free article] [PubMed] [Google Scholar]
- 35.Raghavan M et al. Upper Palaeolithic Siberian genome reveals dual ancestry of Native Americans. Nature 505, 87–91 (2014). [DOI] [PMC free article] [PubMed] [Google Scholar]
- 36.Lazaridis I et al. Ancient human genomes suggest three ancestral populations for present-day Europeans. Nature 513, 409–413 (2014). [DOI] [PMC free article] [PubMed] [Google Scholar]
- 37.O’Connell J et al. A general approach for haplotype phasing across the full spectrum of relatedness. PLoS Genet. 10, e1004234 (2014). [DOI] [PMC free article] [PubMed] [Google Scholar]
- 38.Purcell S et al. PLINK: a tool set for whole-genome association and population-based linkage analyses. Am. J. Hum. Genet 81, 559–575 (2007). [DOI] [PMC free article] [PubMed] [Google Scholar]
- 39.Alexander DH, Novembre J & Lange K Fast model-based estimation of ancestry in unrelated individuals. Genome Res. 19, 1655–1664 (2009). [DOI] [PMC free article] [PubMed] [Google Scholar]
- 40.Loh PR et al. Inferring admixture histories of human populations using linkage disequilibrium. Genetics 193, 1233–1254 (2013). [DOI] [PMC free article] [PubMed] [Google Scholar]
- 41.Lazaridis I et al. Genomic insights into the origin of farming in the ancient Near East. Nature 536, 419–424 (2016). [DOI] [PMC free article] [PubMed] [Google Scholar]
Additional references for Extended Data Figures
- 42.Verdu P et al. Patterns of admixture and population structure in native populations of northwest North America. PLoS Genet. 10, e1004530 (2014). [DOI] [PMC free article] [PubMed] [Google Scholar]
Associated Data
This section collects any data citations, data availability statements, or supplementary materials included in this article.


