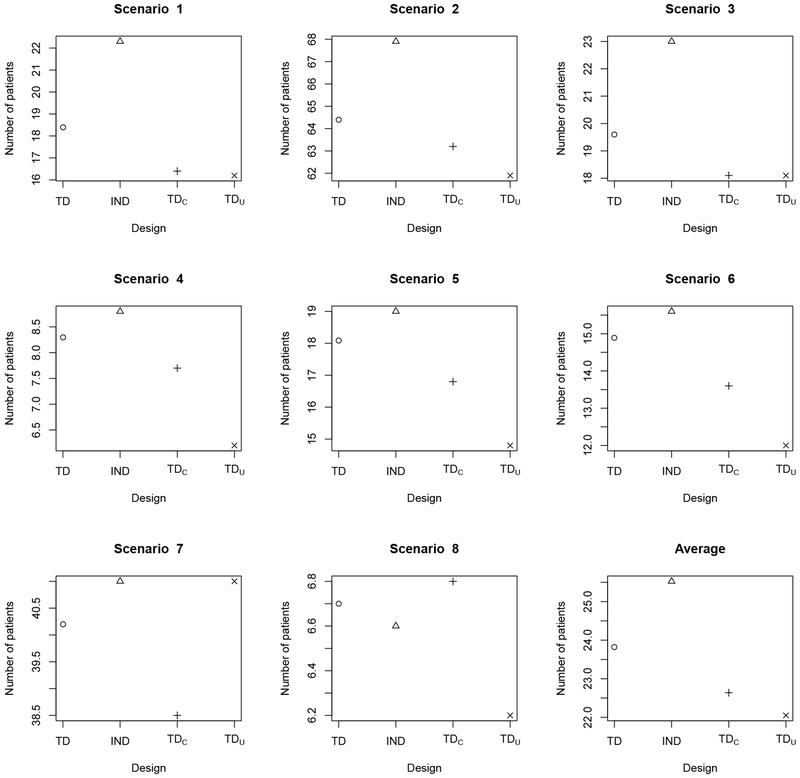
Figure 1.
Average total number of patients overdosed, i.e. treated with a regime having true in scenarios 1–6 and in scenarios 7–8, for the TD (circle o), ITD (triangle Δ), TDC (plus +), and TDU (cross ×) under the simulation scenarios in Table 1. “TD” is the proposed two-stage trial design; “TDC” denotes the two-stage trial design based on complete (YT, YE) data; “TDU” denotes the two-stage trial design based on AR probabilities ; “ITD” denotes the independent two-stage design that conducts a separate regime-finding trial for each subgroup.

