

Abstract
Objective
Eicosapentaenoic acid (EPA) and docosahexaenoic acid (DHA) have beneficial effects on inflammation and cardiovascular disease (CVD). Our aim was to assess the effect of a six-week supplementation with either olive oil, EPA, or DHA on gene expression in peripheral blood mononuclear cells (PBMC).
Methods
Subjects were sampled at baseline and six weeks after receiving either: olive oil 6.0 g/day (n=16), EPA 1.8 g/day (n=16), or DHA 1.8 g/day (n=18). PBMC were subjected to gene expression analysis by microarray with key findings confirmed by quantitative real-time polymerase chain reaction (Q-PCR).
Results
Plasma phospholipid EPA increased 3 fold in the EPA group, and DHA increased 63% in the DHA group (both p < 0.01), while no effects were observed in the olive oil group. Microarray analysis indicated that EPA but not DHA or olive oil significantly affected the gene expression in the following pathways: 1) interferon signaling, 2) receptor recognition of bacteria and viruses, 3) G protein signaling, glycolysis and glycolytic shunting, 4) S-adenosyl-L-methionine biosynthesis, and 5) cAMP-mediated signaling including cAMP responsive element protein 1 (CREB1), as well as many other individual genes including hypoxia inducible factor 1, α subunit (HIF1A). The findings for CREB1 and HIF1A were confirmed by Q-PCR analysis.
Conclusions
Our data indicate that EPA supplementation was associated with significant effects on gene expression involving the interferon pathway as well as down-regulation of CREB1 and HIF1A, which may relate to its beneficial effect on CVD risk reduction.
Keywords: Eicosapentaenoic acid, Docosahexaenoic acid, Peripheral blood mononuclear cells, Microarray analysis, Gene expression, Hypoxia inducible factor 1, α subunit
1. Introduction
Evidence supports the beneficial effects of n-3 polyunsaturated fatty acids (PUFA), especially eicosapentaenoic acids (EPA, C20:5 n-3) and docosahexaenoic acid (DHA, C22:6 n-3), on inflammatory disorders and cardiovascular disease (CVD) (1, 2). Peripheral blood mononuclear cells (PBMC) play a central role in the development and progression of atherosclerotic lesions (3). EPA and DHA exert some of their anti-inflammatory effects by altering properties of immune cells (4). We have previously documented that very high dose n-3 PUFA supplementation in humans markedly reduces interleukin (IL)-1 and tumor necrosis factor (TNF) levels (5).
Studies using macrophages and T cells demonstrated that n-3 PUFA suppress inflammatory cytokines and proteins by regulating multiple transcription factors, including nuclear factor-kappa B (NF-κB) (6) and peroxisome proliferator-activated receptors (PPARs) (7). Oh et al discovered that the G-protein coupled receptor 120 (GPR120) binds n-3 PUFA, resulting in anti-inflammatory signaling in macrophages (8). Recent studies have shown that incorporation of n-3 PUFA into membrane phospholipids results in changes in gene expression profiles (9). In addition, a whole-genome analysis demonstrated that supplementation with the combination of EPA and DHA regulates hundreds of inflammatory genes in human immune cells: Bouwens et al have shown changes in 1040 genes in PBMC from healthy elderly subjects supplemented with a combination of EPA and DHA (1.8 g/day) for 26 weeks (10).
Both clinical and experimental studies have shown that EPA and DHA have different effects (11). Mori et al have shown that supplementation with DHA, but not EPA, significantly lowers blood pressure in overweight mild-hypercholesterolemic patients and the reduction is associated with improvements in endothelial and smooth muscle function (12). In contrast, Mesa et al have demonstrated that EPA supplementation significantly promotes the copper-induced oxidation of the low-density lipoprotein (LDL) from healthy subject, whereas DHA does not (13). In addition, while a dose-dependent reduction in leukotriene production has been observed in neutrophils from healthy subjects during supplementation with DHA, but not EPA (14), a greater reduction in inflammatory cytokines and eicosanoids production has been observed with EPA, relative to DHA, in asthmatic patients' alveolar macrophage cells (15). Although these effects are mediated by changes in gene expression, there has been no systematic comparison between the individual effects of supplementation with EPA versus DHA on gene expression profiles in human immune cells.
Our aim was to assess the individual effects of EPA and DHA on PBMC gene expression profiles as compared to olive oil in subjects with mild elevation in plasma lipoprotein-associated phospholipase A2 (Lp-PLA2) levels prior to and following six weeks of supplementation with EPA and DHA. We recruited participants with mild elevation of plasma Lp-PLA2 levels, known as a vascular-specific inflammation marker (16), in this study to assess the effects of each supplementation in a clinically relevant population.
2. Methods
2.1. Study design
We conducted a randomized, double-blind, parallel intervention study in our clinic (registered at ClinicalTrials.gov as NCT01400490). At the enrollment visit all participants were randomly assigned into one of three intervention groups: olive oil 6.0 g/day (olive oil group), EPA 1.8 g plus olive oil 3.0 g/day (EPA group), and DHA 1.8 g/day (DHA group). Subjects were instructed to take two capsules three times daily for six weeks: subjects in the olive oil group took two capsules of olive oil (1.0 g/capsule) three times daily; subjects in the EPA group took one capsule containing 600 mg/capsule of EPA and one capsule of olive oil three times daily; subjects in the DHA group took two capsules of DHA (300 mg/capsule) three times daily. Participants were not given any specific advice on lifestyle including food intake and physical exercise during this study. Throughout the study, each participant was expected to have consumed a total of 252 capsules. All participants were required to return their remaining capsules at their final visit. Compliance in all completers included in this analysis, calculated as the percentage of consumed capsules to expected capsule consumption, was over 85%. Supplementation phases lasted six weeks, and the participants visited our clinic before (at baseline) and at the end of supplementation (6 weeks). Body weight, body mass index (BMI), waist circumference, systolic and diastolic blood pressure, and pulse rate were measured and blood collection was performed at baseline and 6 weeks.
2.2. Subjects
Men and women were recruited for this study using direct mailings and newspaper advertising and their suitability was assessed during telephone interviews. Eligible and consenting subjects were then invited to a screening examination after an overnight fast where blood was collected for a standard metabolic profile, complete blood count, and plasma Lp-PLA2 measurement. Inclusion criteria were: 1) age 21 to 70 years, 2) no significant chronic disease, 3) BMI of 20 to 35 kg/m2, 4) if women, post-menopausal (no menses for at least one year or surgical menopause), and 5) Lp-PLA2 concentrations > 150 ng/mL. Exclusion criteria were: 1) being involved in competitive exercise or training, 2) being a current smoker, 3) using dietary supplements including fish-oil, EPA or DHA, flax seed oils, weight control products, or high doses of vitamin C (> 500 mg/day) or E (> 400 units/day), 4) frequent fish consumption (> 3 meal/week of “oily fish” such as tuna or salmon), 5) > 2 alcohol drinks/day, 6) a history of significant cardiac, renal, hepatic, gastro-intestinal, pulmonary, neoplastic, biliary or endocrine disorders including uncontrolled thyroid disease, or uncontrolled hypertension or diabetes, and 7) treatment with coumadin or aspirin > 325 mg/day. In addition, participants taking medications which could affect lipid metabolism (statins, fibrates, niacin, resins, ezetimibe and hormonal replacement therapy) or body weight (medications blocking the absorption of ingested fats such as orlistat) obtained permission to stop their medications for a total of 12 weeks (six-week washout period and six-week supplementation period) by their primary care physicians. The protocol was approved by Schulman Associates Institutional Review Board, Cincinnati, OH. A total of 90 men and women were enrolled in this study. All participants signed a written informed consent.
This randomized study conformed to all CONSORT (Consolidated Standards of Reporting Trials) recommendations.
2.3. Biochemical measurements
Fasting venous blood was collected at baseline and at 6 weeks. Plasma samples were obtained by centrifugation and immediately aliquoted and stored at −80°C until examination. Total cholesterol, triglyceride, LDL cholesterol and high-density lipoprotein (HDL) cholesterol levels were measured using automated enzymatic standardized assays as previously described (17). Plasma high-sensitivity C-reactive protein (hs-CRP) and insulin levels were measured by immunoassays as previously described (18). All of these assays were carried out using a high throughput Olympus AU400 automated analyzer. Plasma Lp-PLA2 concentrations were measured using an enzyme linked immunosorbent assay obtained from diaDexus (South San Francisco, CA) as previously described (17). All assays had between and within run coefficients of variation of < 5%. Fatty acid (FA) distribution of plasma phospholipids was determined using capillary column gas liquid chromatography at Nutrasource Diagnostics (Guelph, ON, Canada) as previously described (19).
2.4. Gene expression analysis
For the isolation of PBMC, fasting venous blood was collected in Vacutainer Cell Preparation Tubes (Becton, Dickinson and Company, Franklin Lakes, NJ) with sodium citrate both at baseline and 6 weeks. PBMC were obtained by centrifugation according to the manufacturer's instructions and cell pellets were stored at -80°C until RNA isolation. Total RNA was isolated using RNeasy Plus Mini Kit (Qiagen, Hilden, Germany) according to the manufacturer's instructions. The quality and quantity of RNA samples were determined by using a NanoDrop 2000 Spectrophotometer (Thermo Fisher Scientific, Waltham, MA). Integrity of RNA samples was confirmed by agarose gel electrophoresis and Bioanalyzer.
Microarray analysis was performed at the Yale Center for Genome Analysis, New Haven, CT. RNA samples from three subjects in each group, at baseline and on supplementation, were processed using the Human HT-12 v4 Expression BeadChip expression array (Illumina, San Diego, CA) for a total of 18 analyses. Expression values were calculated by the Illumina BeadStudio suite of programs (Illumina, San Diego, CA). Changes in gene expression were calculated by comparing the expression values of each sample at 6 weeks with those at baseline. Differences in gene expression among the three groups were calculated by comparing the changes in each group using limma package in Bioconductor (20). Pathway analysis was performed by using Ingenuity Pathway Analysis (IPA®; Qiagen, Redwood City, CA; http://www.qiagen.com/ingenuity) and pathways were defined as significantly changed when p < 0.05.
Selected genes were analyzed by Quantitative real-time polymerase chain reaction (Q-PCR) in 50 subjects. First-strand cDNA was synthesized from 0.5 μg of total RNA using SuperScript III reverse transcriptase (Invitrogen, Carlsbad, CA) in a GeneAmp PCR System 9700 (Applied Biosystems, Foster City, CA) according to the manufacturer's instructions. Q-PCR analysis was performed using gene-specific primers (Supplementary Table 1). Primers were designed using information on the public database at the National Center for Biotechnology Information (NCBI) (http://www.ncbi.nlm.nih.gov/RefSeq/). The reactions were run using Power SYBR Green Master Mix (Applied Biosystems, Foster City, CA) in an ABI PRISM 7300 Sequence Detection System (Applied Biosystems, Foster City, CA). For the quantification of specific RNA levels from each sample, absolute values were normalized to those of the housekeeping gene glyceraldehyde-3P-dehydrogenase (GAPDH). The expressions of this housekeeping gene was evaluated using a statistical algorithm (BestKeeper) (21).
2.5 Statistical analysis
Statistical analyses were performed with the SPSS software version 22 (IBM SPSS, IBM Corporation, Somers, NY). Normality of distribution was tested with the Shapiro-Wilk test. Variables with normal distribution were expressed as mean ± SD and those with non-normal distribution were expressed as median and 25th to 75th percentiles. Differences between the values at baseline and 6 weeks within each group were tested by paired t-test. Differences among the three groups were tested by using two-way ANOVA with a Tukey honestly significant difference post-hoc test to correct for multiple testing. Statistical significance was accepted at p < 0.05.
3. Results
3.1. Study population
Of the 90 subjects enrolled in the olive oil, EPA and DHA phases of the study, 82 completed the study (29 subjects in the olive oil, 27 in the EPA, and 26 in the DHA group). Eight subjects were excluded from analysis in the olive oil, eight in the EPA, and four in the DHA group due to inadequate PBMC isolations at either baseline or 6 weeks. In addition, five subjects in the olive oil, three in the EPA group, and four in the DHA group were excluded from the analysis due to a low quantity of PBMC RNA. Thus, Q-PCR analyses were conducted in 50 subjects (16 subjects in the olive oil, 16 in the EPA and 18 in the DHA group).
3.2. Laboratory analysis
Baseline characteristics were similar among the three groups (Table 1). Plasma lipid concentrations and FA distributions at baseline and 6 weeks are shown in Table 2. Baseline values were similar among the three groups with the exception of plasma Lp-PLA2 concentration which was significantly higher in the DHA group than in the other two groups.
Table 1.
Baseline characteristics of subjects in the three groups whose peripheral blood mononuclear cells (PBMC) underwent quantitative real-time polymerase chain reaction (Q-PCR).
| Olive Oil | EPA | DHA | |
|---|---|---|---|
| Subject, n | 16 | 16 | 18 |
| Race (White / Black / Hispanic), n | 9 (56%) / 7 (43%) / 0 (0%) | 9 (56%) / 6 (38%) / 1 (6%) | 11 (61%) / 7 (39%) / 0 (0%) |
| Female, n | 5 (31%) | 2 (13%) | 5 (28%) |
| Age, years | 49.7 ± 11.0 | 53.6 ± 8.6 | 51.6 ± 9.7 |
| Weight, kg | 84.0 ± 14.6 | 86.1 ± 13.2 | 86.0 ± 18.7 |
| Body mass index (BMI), kg/m2 | 28.1 ± 4.1 | 27.5 ± 3.7 | 27.8 ± 4.4 |
| Waist, cm | 94.6 ± 15.2 | 95.1 ± 12.2 | 95.4 ± 11.0 |
| Systolic blood pressure, mmHg | 126.1 ± 9.6 | 130.1 ± 14.9 | 126.1 ± 16.7 |
| Diastolic blood pressure, mmHg | 81.5 ± 8.0 | 82.9 ± 11.7 | 80.8 ± 11.7 |
| Pulse rate, /min | 74.9 ± 10.1 | 70.3 ± 9.7 | 80.7 ± 13.8 |
Data shown as mean ± standard deviation. EPA, eicosapentaenoic acid; DHA, docosahexaenoic acid. None of the baseline characteristics differed significantly among the three groups (by Pearson chi-squared test or ANOVA).
Table 2.
Metabolic profiles and fatty acid distributions in the three groups whose peripheral blood mononuclear cells (PBMC) underwent quantitative real-time polymerase chain reaction (Q-PCR) at both time points.
| Olive Oil (n=16) | EPA (n=16) | DHA (n=18) | ||||
|---|---|---|---|---|---|---|
|
|
|
|
|
|||
| Plasma concentrations | Baseline | 6 weeks | Baseline | 6 weeks | Baseline | 6 weeks |
| Total cholesterol, mg/dL | 206.8 ± 42.9 | 199.7 ± 40.4 | 189.8 ± 53.5 | 191.4 ± 43.9 | 205.2 ± 41.8 | 217.1± 37.5* |
| HDL cholesterol, mg/dL | 59.3 ± 17.6 | 58.3 ± 16.8 | 58.1 ± 24.1 | 58.6 ± 24.5 | 53.2 ± 11.5 | 55.2 ± 13.3 |
| LDL cholesterol, mg/dL | 130.7 ± 44.1 | 124.4 ± 40.7 | 114.9 ± 35.1 | 115.6 ± 32.2 | 137.2 ± 39.6 | 144.0 ± 35.8 |
| Triglyceride†, mg/dL | 128.0 [76.5 - 174.0] | 114.0 [92.8 - 168.5] | 120.0 [76.0 - 181.0] | 94.5 [76.0 - 183.5] | 105.5 [75.3 - 123.5] | 100.5 [74.5 - 143.5] |
| Glucose, mg/dL | 87.7 ± 12.0 | 91.1 ± 17.9 | 93.4 ± 20.5 | 94.3 ± 14.2 | 88.2 ± 9.4 | 86.6 ± 7.0 |
| Insulin†, μU/mL | 9.9 [7.4 - 16.5] | 10.0 [6.6 - 19.9] | 7.9 [5.6 - 14.8] | 8.0 [5.9 - 14.9] | 8.0 [5.3 - 10.6] | 7.8 [5.7 - 10.6] |
| Hs-CRP†, mg/dL | 0.19 [0.07 - 0.35] | 0.13 [0.06 - 0.24] | 0.09 [0.06 - 0.16] | 0.13 [0.06 - 0.25] | 0.10 [0.05 - 0.40] | 0.08 [0.04 - 0.28] |
| Lp-PLA2, ng/mL | 194.0 ± 35.7 | 200.1 ± 40.8 | 196.9 ± 22.4 | 191.1 ± 30.8 | 238.1 ± 52.6# | 212.6 ± 56.5** |
|
|
|
|
|
|||
| Fatty acids | Baseline | 6 weeks | Baseline | 6 weeks | Baseline | 6 weeks |
|
|
|
|
|
|||
| C18:1 n-9 (OA), % | 9.8 ± 1.0 | 10.4 ± 1.7 | 9.9 ± 1.0 | 9.1 ± 1.1** | 9.5 ± 1.2 | 9.4 ± 1.3 |
| C20:4 n-6 (AA), % | 13.2 ± 2.3 | 13.2 ± 2.5 | 12.8 ± 3.1 | 11.8 ± 2.9 | 11.7 ± 2.7 | 11.3 ± 2.6 |
| C20:5 n-3 (EPA), % | 0.78 ± 0.14 | 0.82 ± 0.10 | 0.91 ± 0.21 | 2.71 ± 0.45** | 0.78 ± 0.16 | 1.11 ± 0.17* |
| C22:5 n-3 (DPA), % | 0.83 ± 0.04 | 0.76 ± 0.04 | 0.86 ± 0.06 | 1.34 ± 0.11** | 0.77 ± 0.05 | 0.62 ± 0.05** |
| C22:6 n-3 (DHA), % | 2.8 ± 0.2 | 2.9 ± 0.2 | 3.0 ± 0.3 | 3.1 ± 0.4 | 3.0 ± 0.3 | 4.9 ± 0.7** |
Data shown as mean ± standard deviation (or
mean [interquartile range]).
EPA, eicosapentaenoic acid; DHA, docosahexaenoic acid; HDL, high-density lipoprotein; LDL, low-density lipoprotein; Hs-CRP, high-sensitivity C-reactive protein; Lp-PLA2, lipoprotein-associated phospholipase A2; OA, oleic acid; DPA, docosapentaenoic acid. Significant difference compared to baseline,
<0.05;
<0.01 within each group.
Significant difference in plasma Lp-PLA2 concentration between the DHA group and the other two groups.
No significant change in plasma lipid concentrations and FA distributions was observed after six-week supplementation with the olive oil. In the EPA group, no change in plasma lipids was observed. In this group, a significant decrease in the percent mole distribution (%mol) of oleic acid (OA) (p=0.001) and significant increases in %mol of EPA and docosapentaenoic acid (DPA) (both p=0.001) were observed. In the DHA group, there was a significant increase in plasma total cholesterol concentration (p=0.02), associated with a trend toward an increase in both LDL and HDL cholesterol (p=0.082 and p=0.15, respectively), and a significant decrease in plasma Lp-PLA2 concentration (p=0.007). Also, significant increases in the %mol distribution of EPA (p=0.011), DPA (p=0.004) and DHA (p=0.007) were observed in this group (Table 2).
3.3. Microarray analysis
To assess differences in gene expression profiles among the three groups, a total of nine subjects (two men and one woman from each group) were selected taking into consideration quantity and quality of yielded total RNA for the requirements of microarray analysis, and compliance with supplementation as estimated by the change in plasma phospholipid FA distributions. Characteristics and, plasma metabolic profiles and FA distributions at baseline and 6 weeks of these selected subjects are shown in Supplementary Table 2.
The genes with > 1.25 fold-change were defined as differentially regulated during the six-week supplementation phases. The total number of differentially regulated genes between baseline and 6 weeks was 25 in the olive oil, 136 in the EPA, and 14 in the DHA group. To identify the biological pathways and networks of differentially regulated genes, pathway analyses were performed. In the EPA group seven pathways were significantly affected, while for the DHA group 12 pathways were significantly affected (Table 3 and 4). Surprisingly, for the olive oil group 22 pathways were significantly affected (Supplementary Table 3).
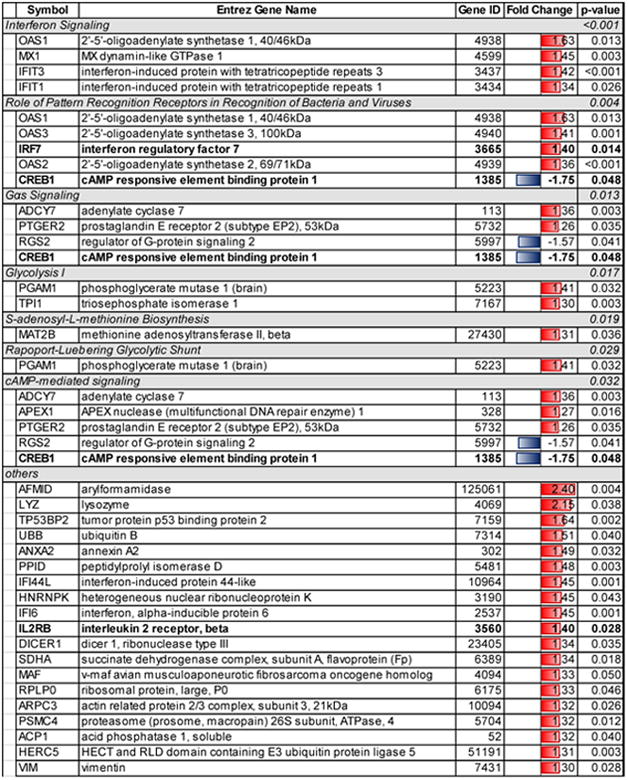
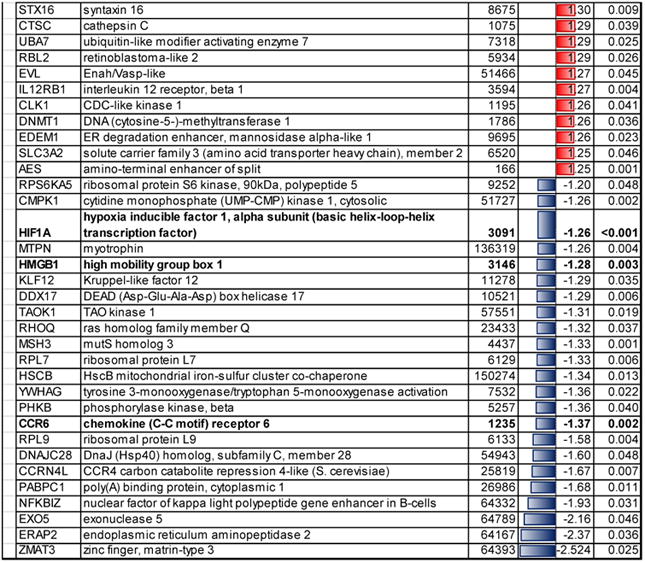
Table 3.
Significant regulated pathways and genes in the EPA group whose peripheral blood mononuclear cells (PBMC) underwent microarray analysis at both time points by the pathway analysis software program, Ingenuity Pathway Analysis.
|
|
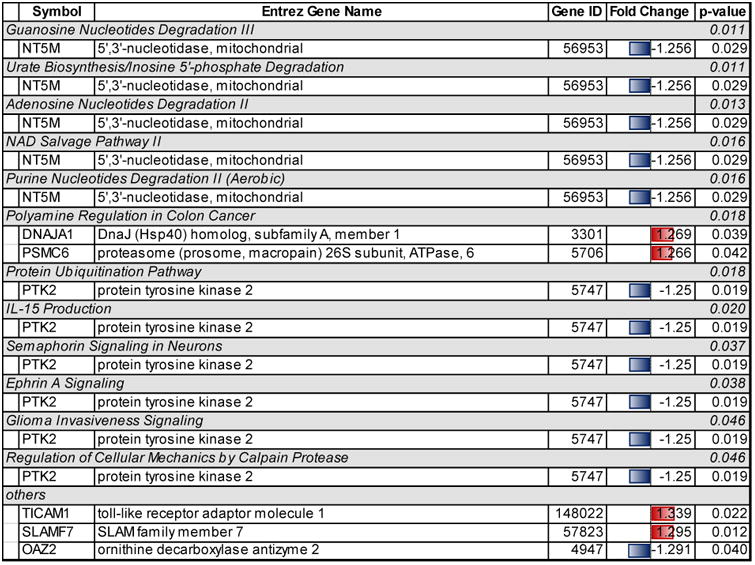
Table 4.
Significant regulated pathways and genes in the DHA group whose peripheral blood mononuclear cells (PBMC) underwent microarray analysis at both time points by the pathway analysis software program, Ingenuity Pathway Analysis.
|
Significant pathways related to the genes regulated in the EPA group were classified into the following: 1) cellular immune response (interferon signaling, p < 0.001, and role of pattern recognition receptors in recognition of bacteria and viruses, p=0.004), 2) intracellular and second messenger signaling (Gαs signaling, p=0.013, and cyclic-AMP-mediated signaling, p=0.032), and 3) metabolic pathways (Glycolysis I, p=0.017, S-adenosyl-L-methionine biosynthesis, p=0.019, and Rapoport-Luebering glycolytic shunt, p=0.029) (Table 3).
Significant pathways related to genes regulated in the DHA group included one pathway affecting immune response (IL-15 production, p=0.020), five pathways affecting metabolism (guanosine nucelotide degradation III, p=0.011, urate biosynthesis/inosine 5′-phosphate degradation, p=0.011, adenosine nucleotides degradation II, p=0.013, NAD salvage pathway III, p=0.016, and purine nucleotide degradation II, aerobic, p=0.016), and two pathways affecting nervous system signaling (semaphorin signaling in neurons, p=0.037, and ephrin A signaling, p=0.038) (Table 4).
There were 22 significant pathways related to genes regulated in the olive oil group. Interestingly the gene expression of the FBJ murine osteosarcoma viral oncogene homolog (FOS) was significantly up-regulated more than 2 fold in the olive oil group, and this gene affected 15 of these 22 pathways. Moreover the FYN proto-oncogene, Src family tyrosine kinase (FYN) was up-regulated about 1.5 fold in the olive oil group, and this gene affected 13 pathways. A third gene, the Wiskott-Aldrich syndrome (WAS) was down-regulated about 25%, and this gene affected seven pathways (Supplementary Table 3).
3.4. Q-PCR analysis
Based on the microarray analyses, the following six genes were selected for further analysis by Q-PCR analysis in all subjects: 1) chemokine (C-C motif) receptor 6 (CCR6), 2) cyclic-AMP responsive element binding protein 1 (CREB1), hypoxia inducible factor 1, α subunit (HIF1A), 4) high-mobility group box 1 (HMGB1), 5) interleukin 2 receptor, β (IL2RB), and 6) interferon regulatory factor 7 (IRF7) because they affected core molecules in associated networks. Moreover, two additional genes were selected because of their important roles in the cellular inflammation response: 1) interleukin 1 receptor antagonist (IL1RN) and 2) signal transducer activator of transcription 3 (STAT3).
The expressions of the selected genes at baseline were similar among the three groups. Significant reductions in the expression of CREB1 (p=0.033) and HIF1A (p=0.009), relative to baseline, were observed in the EPA group, in agreement with the results of microarray analysis. The reduction in HIF1A expression in the EPA group was significantly greater than that in the other two groups. In addition, reductions in the expression of IL2RB (p=0.039) and STAT3 (p=0.012) were also observed in the EPA group. However, significant reductions in the expression of IL2RB (p=0.005) and STAT3 (p=0.002) were observed in the olive oil group as well. The expression of the HMGB1was significantly reduced only in the DHA group (p=0.015). No significant changes in the expression of CCR6, IRF7 and IL1RN were observed between baseline and 6 weeks in the three groups.
4. Discussion
In this study we report changes in PBMC gene expression profiles after six weeks of supplementation with EPA 1.8 g/day, DHA 1.8 g/day, and olive oil 6.0 g/day in subjects with mild Lp-PLA2 elevation. To our knowledge, this is the first study directly comparing the individual effects of EPA and DHA on PBMC gene expression profiles.
A number of clinical studies have shown the association between n-3 PUFA intake and inflammation disorders and CVD. Although observational studies support the beneficial effects of n-3 PUFA, (22, 23)intervention trials have yielded equivocal results especially in healthy subjects (24-26). Differences in study design might explain the inconsistent outcomes. The dose and the ratio of supplementation with EPA and DHA may be critical factors. For example, most intervention trials investigating the effect of n-3 PUFA on CVD outcomes, including the ongoing trial The Vitamin D and Omega-3 Trial, have been conducted with 1.0 g/day or less of combined EPA and DHA (27). An exception is the positive Japan EPA Lipid Intervention Trial which showed significant cardiovascular risk reduction using 1.8 g/day of EPA on top of statin therapy versus statin alone (28). To demonstrate the individual effects of EPA and DHA, sufficient amount needs to be provided in clinical studies (29). Rees et al have shown that the immunomodulation effect of EPA and DHA may be dose-dependent (30). Additionally, at least 1.35 g/day of EPA needs to be provided in order to observe effects on the reduction of prostaglandin E2 production by PBMC in healthy subjects (30). Therefore, 1.8 g/day of both EPA and DHA supplementation was provided in this study.
It is thought that the favorable effects of EPA and DHA on inflammation including atherosclerosis are mediated, at least in part, by regulating signaling pathways and gene expressions in immune cells (9). Bouwens et al studied the effects of supplementation with a combination of high-dose (1.8 g/day) or low-dose (0.4 g/day) EPA plus DHA for 26 weeks on the PBMC gene expression profiles in healthy subjects (10). High-dose supplementation resulted in decreased expression of genes related to inflammatory and atherogenic pathways, such as NF-κB signaling, eicosanoid synthesis, scavenger receptor activity, adipogenesis, and hypoxia signaling (10). Similar to our findings, they noted a significant reduction in HIF1A expression both by microarray and by Q-PCR analysis especially at the high-dose supplementation. Our data would indicate that this latter effect is primarily due to EPA. Rudkowska et al showed that supplementation with a combination of EPA 1.9 g/day plus DHA 1.1 g/day for six weeks in 30 healthy subjects resulted in a change in the PBMC gene expression related to the several pathways including gene regulation by peroxisome proliferators via PPARα, hypoxia-inducible factor signaling and oxidative stress (31).
On the other hand, several studies have demonstrated the differential effects of EPA and DHA on gene expression in immune cells. For example, whereas EPA was a stronger activator of PPAR delta than DHA (32), DHA, but not EPA, controlled the abundance of sterol-regulatory element binding protein (SREBP)-1 through a 26S proteasome-dependent mechanism in rat hepatocytes (33). These different effects of EPA and DHA on transcription factors may result in different changes in gene expression in experimental models. However, it remains unclear whether these differences are also observed in humans.
In our study, microarray analysis indicated that there was not a single gene commonly regulated in both EPA and DHA groups. In addition, although several significant pathways regulated in each groups were classified into the same larger classification (metabolic pathways), all the pathways were completely different between the two groups. Whereas in the EPA group two of the seven pathways were classified as part of cellular immune response, in the DHA group two of the 11 pathways were related to both nervous cell signaling and interactions among immune cells. Specifically, both semaphorin and ephrin A signaling have been shown to promote neuronal axon development and mediate immune cell interactions (28) (29). These results suggest that the effects of individual supplementation are mediated by different pathways in PBMC. Although n-3 PUFA can control lipid synthesis by regulating transcription factor activation including SREBP-1 and PPARs in humans (34), the expression of genes targeted by these transcription factors was not changed in our study. It is possible that the regulation of these genes is mainly effected in hepatocytes. Several metabolic pathways were regulated by EPA supplementation in our study. One of these, s-adenosyl-L-methionine biosynthesis, can affect DNA methylation profiles, resulting in diverse phenotypes with the potential for prevention or progression of diseases (35). Q-PCR analysis revealed that several inflammatory and immunomodulatory genes were down-regulated in both the EPA and DHA groups. In agreement with the results of the microarray analysis, Q-PCR results indicated that EPA supplementation reduced the expression of the CREB1 and HIF1A. CREB regulates immune responses but also promotes activation and proliferation of T and B cells and differentially regulates Th1, Th2, and Th17 cell responses (36). Because chronic activation of CREB is associated with metabolic and inflammatory disorders, reduced activation of CREB can prevent the development and progression of these disorders in humans (37). In addition, HIF1A is known as a central regulator of the cellular hypoxia caused by infection and inflammation diseases and is up-regulated through NF-κB pathway (38). Down-regulation of HIF1A with n-3 PUFA supplementation was reported in PBMC in healthy subjects by Bouwens (10) and also reported in subcutaneous adipose tissue in severely obese patients by Itariu (39). Reduced HIF1A expression is considered valuable in the treatment of chronic inflammatory disorders, such as rheumatoid arthritis (40). Reduced STAT3 expression was observed in the three groups. Suppression of STAT3 pathways can inhibit IL-6-mediated inflammation and tumor development (41). Thus, the effects of EPA on inflammation are mediated by the suppression of several inflammatory transcription factors and hypoxia induced factors and there is a tendency toward greater anti-inflammatory effects of EPA relative to DHA in human immune cells. The reductions of inflammatory genes expression by supplementation with EPA may result in CVD risk reduction. On the other hand, DHA supplementation for 6 weeks significantly reduced HMGB1 expression. HMGB1 nuclear protein released by monocytes, macrophages and necrotic cells behaves as a trigger of inflammation and attracts inflammatory cells (42). Wei et al reported that the protective effects of n-3 PUFA on the chronic rejection is mediated by the suppression of the HMGB1 pathway in rat allograft vessels (43). It should be noted that both EPA and DHA have also been shown to reduce cell inflammation by causing the direct increased production of resolvins (44). However, in our study we did not measure resolvins or their precursors.
Our study recruited subjects with increased plasma Lp-PLA2 levels and thus our results may not apply to other individuals (45). Another potential limitation of our study is that the EPA supplementation also contained 3.0 g of olive oil for capsule number adjustment. Therefore some of the results observed in this group may have been due to the combination of EPA and olive oil, rather than EPA alone. However, there were significant differences in gene expression between the EPA group and the olive oil group. In addition, there may have been sample selection bias in the microarray analysis, since these subjects were selected from each group based on plasma changes in EPA and DHA. Furthermore, while the FA composition of plasma phospholipids reflects compliance to treatment, it may not represent the FA profile of PBMC. Another limitation of our study is that changes in gene expression do not always translate in similar changes in protein abundance, however gene expression is a significant contributor to protein expression (46).
In conclusion, in this study we investigated the differences in gene expression and affected pathways in subjects with low-grade inflammation receiving EPA or DHA. Our results indicate that EPA and DHA differently regulate some inflammatory pathways and genes, and can prevent the development and progression of chronic inflammatory disorders including CVD by directly or indirectly affecting different gene expression profiles in human immune cells. Future experimental studies are needed to demonstrate their individual biological pathways. In addition, further intervention trials are also needed to elucidate their individual effects on chronic inflammatory disorders. These results will contribute to our understanding of the synergistic, additive and/or antagonistic effects of n-3 PUFA on inflammation and hopefully will help to elucidate how n-3 PUFA affect CVD risk.
Supplementary Material
Supplementary Table 1. Quantitative real-time polymerase chain reaction (Q-PCR) primer sets.
Supplementary Table 2. Characteristics and metabolic profiles and plasma fatty acid distribution in the three groups whose peripheral blood mononuclear cells (PBMC) underwent microarray analysis at both time points.
Supplementary Table 3. Significant regulated pathways and genes in the olive oil group whose peripheral blood mononuclear cells (PBMC) underwent microarray analysis at both time points by the pathway analysis software program, Ingenuity Pathway Analysis.
Figure 1.

Mean (± SEM) relative changes in the expression of specific genes determined by quantitative real-time polymerase chain reaction (Q-PCR) in the three groups. Differences within each group were determined by paired t test (**p <0.01, *p <0.05). Brackets indicate differences between two groups as determined with a 2-factor ANOVA with Tukey honestly significant difference correction. CCR6, chemokine (C-C motif) receptor 6; CREB1, cAMP responsive element binding protein 1; HIF1A, hypoxia-inducible factor 1-alpha; HMGB1, high mobility group box 1; IL1RN, interleukin 1 receptor antagonist; IL2RB, interleukin 2 receptor, beta; IRF7, interferon regulatory factor 7; STAT3, signal transducer and activator of transcription.
Highlights.
The effects of EPA and DHA were mediated by different pathways in human PBMC.
EPA affected cellular immune responses including the interferon signaling pathway.
HIF1A and CREB1 gene expression were significantly reduced by EPA, but not DHA.
Acknowledgments
Funding sources: The study was supported by a research grant from DuPont Applied Biosciences, Wilmington, DE to Dr. Ernst J. Schaefer and the Cardiovascular Research Clinic. Additional support was provided by US Department of Agriculture Research Service Contract 53-3K-06 (EJS) and by Project Grant P50 HL083813-01 from the National Institutes of Health (EJS). LKI was partially supported by NINDS/NIH grant for the Tufts Center for Neuroscience Research P30 NS047243 (Jackson). Dr. Tsunoda was supported by a fellowship from Showa University School of Medicine, Tokyo, Japan.
Footnotes
Conflicts of interest: None declared.
Publisher's Disclaimer: This is a PDF file of an unedited manuscript that has been accepted for publication. As a service to our customers we are providing this early version of the manuscript. The manuscript will undergo copyediting, typesetting, and review of the resulting proof before it is published in its final citable form. Please note that during the production process errors may be discovered which could affect the content, and all legal disclaimers that apply to the journal pertain.
References
- 1.Marik PE, Varon J. Omega-3 dietary supplements and the risk of cardiovascular events: a systematic review. Clinical cardiology. 2009;32(7):365–72. doi: 10.1002/clc.20604. [DOI] [PMC free article] [PubMed] [Google Scholar]
- 2.Calder PC. n-3 polyunsaturated fatty acids, inflammation, and inflammatory diseases. The American journal of clinical nutrition. 2006;83(6 Suppl):1505s–19s. doi: 10.1093/ajcn/83.6.1505S. [DOI] [PubMed] [Google Scholar]
- 3.Hansson GK. Inflammation, Atherosclerosis, and Coronary Artery Disease. New England Journal of Medicine. 2005;352(16):1685–95. doi: 10.1056/NEJMra043430. [DOI] [PubMed] [Google Scholar]
- 4.Calder PC. Omega-3 polyunsaturated fatty acids and inflammatory processes: nutrition or pharmacology? British journal of clinical pharmacology. 2013;75(3):645–62. doi: 10.1111/j.1365-2125.2012.04374.x. [DOI] [PMC free article] [PubMed] [Google Scholar]
- 5.Endres S, Ghorbani R, Kelley VE, Georgilis K, Lonnemann G, van der Meer JW, et al. The effect of dietary supplementation with n-3 polyunsaturated fatty acids on the synthesis of interleukin-1 and tumor necrosis factor by mononuclear cells. The New England journal of medicine. 1989;320(5):265–71. doi: 10.1056/NEJM198902023200501. [DOI] [PubMed] [Google Scholar]
- 6.Lo CJ, Chiu KC, Fu M, Lo R, Helton S. Fish oil decreases macrophage tumor necrosis factor gene transcription by altering the NF kappa B activity. The Journal of surgical research. 1999;82(2):216–21. doi: 10.1006/jsre.1998.5524. [DOI] [PubMed] [Google Scholar]
- 7.Kong W, Yen JH, Vassiliou E, Adhikary S, Toscano MG, Ganea D. Docosahexaenoic acid prevents dendritic cell maturation and in vitro and in vivo expression of the IL-12 cytokine family. Lipids in health and disease. 2010;9:12. doi: 10.1186/1476-511X-9-12. [DOI] [PMC free article] [PubMed] [Google Scholar]
- 8.Oh DY, Talukdar S, Bae EJ, Imamura T, Morinaga H, Fan W, et al. GPR120 is an omega-3 fatty acid receptor mediating potent anti-inflammatory and insulin-sensitizing effects. Cell. 2010;142(5):687–98. doi: 10.1016/j.cell.2010.07.041. [DOI] [PMC free article] [PubMed] [Google Scholar]
- 9.Calder PC. Long chain fatty acids and gene expression in inflammation and immunity. Current opinion in clinical nutrition and metabolic care. 2013;16(4):425–33. doi: 10.1097/MCO.0b013e3283620616. [DOI] [PubMed] [Google Scholar]
- 10.Bouwens M, van de Rest O, Dellschaft N, Bromhaar MG, de Groot LC, Geleijnse JM, et al. Fish-oil supplementation induces antiinflammatory gene expression profiles in human blood mononuclear cells. The American journal of clinical nutrition. 2009;90(2):415–24. doi: 10.3945/ajcn.2009.27680. [DOI] [PubMed] [Google Scholar]
- 11.Mozaffarian D, Wu JH. (n-3) fatty acids and cardiovascular health: are effects of EPA and DHA shared or complementary? The Journal of nutrition. 2012;142(3):614s–25s. doi: 10.3945/jn.111.149633. [DOI] [PMC free article] [PubMed] [Google Scholar]
- 12.Mori TA, Bao DQ, Burke V, Puddey IB, Beilin LJ. Docosahexaenoic acid but not eicosapentaenoic acid lowers ambulatory blood pressure and heart rate in humans. Hypertension. 1999;34(2):253–60. doi: 10.1161/01.hyp.34.2.253. [DOI] [PubMed] [Google Scholar]
- 13.Mesa MD, Buckley R, Minihane AM, Yaqoob P. Effects of oils rich in eicosapentaenoic and docosahexaenoic acids on the oxidizability and thrombogenicity of low-density lipoprotein. Atherosclerosis. 2004;175(2):333–43. doi: 10.1016/j.atherosclerosis.2004.04.004. [DOI] [PubMed] [Google Scholar]
- 14.Stanke-Labesque F, Moliere P, Bessard J, Laville M, Vericel E, Lagarde M. Effect of dietary supplementation with increasing doses of docosahexaenoic acid on neutrophil lipid composition and leukotriene production in human healthy volunteers. The British journal of nutrition. 2008;100(4):829–33. doi: 10.1017/S0007114508923692. [DOI] [PubMed] [Google Scholar]
- 15.Mickleborough TD, Tecklenburg SL, Montgomery GS, Lindley MR. Eicosapentaenoic acid is more effective than docosahexaenoic acid in inhibiting proinflammatory mediator production and transcription from LPS-induced human asthmatic alveolar macrophage cells. Clinical nutrition (Edinburgh, Scotland) 2009;28(1):71–7. doi: 10.1016/j.clnu.2008.10.012. [DOI] [PubMed] [Google Scholar]
- 16.Corson MA, Jones PH, Davidson MH. Review of the Evidence for the Clinical Utility of Lipoprotein-Associated Phospholipase A2 as a Cardiovascular Risk Marker. The American journal of cardiology. 2008;101(12, Supplement):S41–S50. doi: 10.1016/j.amjcard.2008.04.018. [DOI] [PubMed] [Google Scholar]
- 17.Schaefer EJ, McNamara JR, Asztalos BF, Tayler T, Daly JA, Gleason JL, et al. Effects of atorvastatin versus other statins on fasting and postprandial C-reactive protein and lipoprotein-associated phospholipase A2 in patients with coronary heart disease versus control subjects. The American journal of cardiology. 2005;95(9):1025–32. doi: 10.1016/j.amjcard.2005.01.023. [DOI] [PubMed] [Google Scholar]
- 18.Thongtang N, Ai M, Otokozawa S, Himbergen TV, Asztalos BF, Nakajima K, et al. Effects of maximal atorvastatin and rosuvastatin treatment on markers of glucose homeostasis and inflammation. The American journal of cardiology. 2011;107(3):387–92. doi: 10.1016/j.amjcard.2010.09.031. [DOI] [PMC free article] [PubMed] [Google Scholar]
- 19.Stark KD, Holub BJ. Differential eicosapentaenoic acid elevations and altered cardiovascular disease risk factor responses after supplementation with docosahexaenoic acid in postmenopausal women receiving and not receiving hormone replacement therapy. The American journal of clinical nutrition. 2004;79(5):765–73. doi: 10.1093/ajcn/79.5.765. [DOI] [PubMed] [Google Scholar]
- 20.Smyth GK. Linear models and empirical bayes methods for assessing differential expression in microarray experiments. Statistical applications in genetics and molecular biology. 2004;3 doi: 10.2202/1544-6115.1027. Article3. [DOI] [PubMed] [Google Scholar]
- 21.Pfaffl MW, Tichopad A, Prgomet C, Neuvians TP. Determination of stable housekeeping genes, differentially regulated target genes and sample integrity: BestKeeper--Excel-based tool using pair-wise correlations. Biotechnology letters. 2004;26(6):509–15. doi: 10.1023/b:bile.0000019559.84305.47. [DOI] [PubMed] [Google Scholar]
- 22.He K, Song Y, Daviglus ML, Liu K, Van Horn L, Dyer AR, et al. Accumulated evidence on fish consumption and coronary heart disease mortality: a meta-analysis of cohort studies. Circulation. 2004;109(22):2705–11. doi: 10.1161/01.CIR.0000132503.19410.6B. [DOI] [PubMed] [Google Scholar]
- 23.Yates CM, Calder PC, Ed Rainger G. Pharmacology and therapeutics of omega-3 polyunsaturated fatty acids in chronic inflammatory disease. Pharmacology and Therapeutics. 2014;141(3):272–82. doi: 10.1016/j.pharmthera.2013.10.010. [DOI] [PubMed] [Google Scholar]
- 24.Rangel-Huerta OD, Aguilera CM, Mesa MD, Gil A. Omega-3 long-chain polyunsaturated fatty acids supplementation on inflammatory biomakers: a systematic review of randomised clinical trials. The British journal of nutrition. 2012;107(Suppl 2):S159–70. doi: 10.1017/S0007114512001559. [DOI] [PubMed] [Google Scholar]
- 25.Cazzola R, Russo-Volpe S, Miles EA, Rees D, Banerjee T, Roynette CE, et al. Age- and dose-dependent effects of an eicosapentaenoic acid-rich oil on cardiovascular risk factors in healthy male subjects. Atherosclerosis. 2007;193(1):159–67. doi: 10.1016/j.atherosclerosis.2006.06.008. [DOI] [PubMed] [Google Scholar]
- 26.Pot GK, Brouwer IA, Enneman A, Rijkers GT, Kampman E, Geelen A. No effect of fish oil supplementation on serum inflammatory markers and their interrelationships: a randomized controlled trial in healthy, middle-aged individuals. European journal of clinical nutrition. 2009;63(11):1353–9. doi: 10.1038/ejcn.2009.63. [DOI] [PubMed] [Google Scholar]
- 27.Manson JE, Bassuk SS, Lee IM, Cook NR, Albert MA, Gordon D, et al. The VITamin D and OmegA-3 TriaL (VITAL): rationale and design of a large randomized controlled trial of vitamin D and marine omega-3 fatty acid supplements for the primary prevention of cancer and cardiovascular disease. Contemporary clinical trials. 2012;33(1):159–71. doi: 10.1016/j.cct.2011.09.009. [DOI] [PMC free article] [PubMed] [Google Scholar]
- 28.Yokoyama M, Origasa H, Matsuzaki M, Matsuzawa Y, Saito Y, Ishikawa Y, et al. Effects of eicosapentaenoic acid on major coronary events in hypercholesterolaemic patients (JELIS): a randomised open-label, blinded endpoint analysis. Lancet. 2007;369(9567):1090–8. doi: 10.1016/S0140-6736(07)60527-3. [DOI] [PubMed] [Google Scholar]
- 29.Mozaffarian D, Wu JH. Omega-3 fatty acids and cardiovascular disease: effects on risk factors, molecular pathways, and clinical events. Journal of the American College of Cardiology. 2011;58(20):2047–67. doi: 10.1016/j.jacc.2011.06.063. [DOI] [PubMed] [Google Scholar]
- 30.Rees D, Miles EA, Banerjee T, Wells SJ, Roynette CE, Wahle KW, et al. Dose-related effects of eicosapentaenoic acid on innate immune function in healthy humans: a comparison of young and older men. The American journal of clinical nutrition. 2006;83(2):331–42. doi: 10.1093/ajcn/83.2.331. [DOI] [PubMed] [Google Scholar]
- 31.Rudkowska I, Paradis AM, Thifault E, Julien P, Tchernof A, Couture P, et al. Transcriptomic and metabolomic signatures of an n-3 polyunsaturated fatty acids supplementation in a normolipidemic/normocholesterolemic Caucasian population. The Journal of nutritional biochemistry. 2013;24(1):54–61. doi: 10.1016/j.jnutbio.2012.01.016. [DOI] [PubMed] [Google Scholar]
- 32.Forman BM, Chen J, Evans RM. Hypolipidemic drugs, polyunsaturated fatty acids, and eicosanoids are ligands for peroxisome proliferator-activated receptors alpha and delta. Proceedings of the National Academy of Sciences of the United States of America. 1997;94(9):4312–7. doi: 10.1073/pnas.94.9.4312. [DOI] [PMC free article] [PubMed] [Google Scholar]
- 33.Botolin D, Wang Y, Christian B, Jump DB. Docosahexaneoic acid (22:6,n-3) regulates rat hepatocyte SREBP-1 nuclear abundance by Erk- and 26S proteasome-dependent pathways. Journal of lipid research. 2006;47(1):181–92. doi: 10.1194/jlr.M500365-JLR200. [DOI] [PMC free article] [PubMed] [Google Scholar]
- 34.Schulman IG. Nuclear receptors as drug targets for metabolic disease. Advanced Drug Delivery Reviews. 2010;62(13):1307–15. doi: 10.1016/j.addr.2010.07.002. [DOI] [PMC free article] [PubMed] [Google Scholar]
- 35.Anderson OS, Sant KE, Dolinoy DC. Nutrition and epigenetics: an interplay of dietary methyl donors, one-carbon metabolism and DNA methylation. The Journal of nutritional biochemistry. 2012;23(8):853–9. doi: 10.1016/j.jnutbio.2012.03.003. [DOI] [PMC free article] [PubMed] [Google Scholar]
- 36.Wen AY, Sakamoto KM, Miller LS. The role of the transcription factor CREB in immune function. Journal of immunology (Baltimore, Md : 1950) 2010;185(11):6413–9. doi: 10.4049/jimmunol.1001829. [DOI] [PMC free article] [PubMed] [Google Scholar]
- 37.Altarejos JY, Montminy M. CREB and the CRTC co-activators: sensors for hormonal and metabolic signals. Nature reviews Molecular cell biology. 2011;12(3):141–51. doi: 10.1038/nrm3072. [DOI] [PMC free article] [PubMed] [Google Scholar]
- 38.Nizet V, Johnson RS. Interdependence of hypoxic and innate immune responses. Nature reviews Immunology. 2009;9(9):609–17. doi: 10.1038/nri2607. [DOI] [PMC free article] [PubMed] [Google Scholar]
- 39.Itariu BK, Zeyda M, Hochbrugger EE, Neuhofer A, Prager G, Schindler K, et al. Long-chain n-3 PUFAs reduce adipose tissue and systemic inflammation in severely obese nondiabetic patients: a randomized controlled trial. The American journal of clinical nutrition. 2012;96(5):1137–49. doi: 10.3945/ajcn.112.037432. [DOI] [PubMed] [Google Scholar]
- 40.Ha MK, Song YH, Jeong SJ, Lee HJ, Jung JH, Kim B, et al. Emodin inhibits proinflammatory responses and inactivates histone deacetylase 1 in hypoxic rheumatoid synoviocytes. Biological & pharmaceutical bulletin. 2011;34(9):1432–7. doi: 10.1248/bpb.34.1432. [DOI] [PubMed] [Google Scholar]
- 41.Yu H, Pardoll D, Jove R. STATs in cancer inflammation and immunity: a leading role for STAT3. Nature reviews Cancer. 2009;9(11):798–809. doi: 10.1038/nrc2734. [DOI] [PMC free article] [PubMed] [Google Scholar]
- 42.Wang H, Bloom O, Zhang M, Vishnubhakat JM, Ombrellino M, Che J, et al. HMG-1 as a late mediator of endotoxin lethality in mice. Science (New York, NY) 1999;285(5425):248–51. doi: 10.1126/science.285.5425.248. [DOI] [PubMed] [Google Scholar]
- 43.Wei W, Chen M, Zhu Y, Wang J, Zhu P, Li Y, et al. Down-regulation of vascular HMGB1 and RAGE expression by n-3 polyunsaturated fatty acids is accompanied by amelioration of chronic vasculopathy of small bowel allografts. The Journal of nutritional biochemistry. 2012;23(10):1333–40. doi: 10.1016/j.jnutbio.2011.08.002. [DOI] [PubMed] [Google Scholar]
- 44.Serhan CN, Chiang N. Endogenous pro-resolving and anti-inflammatory lipid mediators: a new pharmacologic genus. British journal of pharmacology. 2008;153(Suppl 1):S200–15. doi: 10.1038/sj.bjp.0707489. [DOI] [PMC free article] [PubMed] [Google Scholar]
- 45.Lanman RB, Wolfert RL, Fleming JK, Jaffe AS, Roberts WL, Warnick GR, et al. Lipoprotein-associated phospholipase A2: review and recommendation of a clinical cut point for adults. Preventive cardiology. 2006;9(3):138–43. doi: 10.1111/j.1520-037x.2006.05547.x. [DOI] [PubMed] [Google Scholar]
- 46.Piccirillo CA, Bjur E, Topisirovic I, Sonenberg N, Larsson O. Translational control of immune responses: from transcripts to translatomes. Nature immunology. 2014;15(6):503–11. doi: 10.1038/ni.2891. [DOI] [PubMed] [Google Scholar]
Associated Data
This section collects any data citations, data availability statements, or supplementary materials included in this article.
Supplementary Materials
Supplementary Table 1. Quantitative real-time polymerase chain reaction (Q-PCR) primer sets.
Supplementary Table 2. Characteristics and metabolic profiles and plasma fatty acid distribution in the three groups whose peripheral blood mononuclear cells (PBMC) underwent microarray analysis at both time points.
Supplementary Table 3. Significant regulated pathways and genes in the olive oil group whose peripheral blood mononuclear cells (PBMC) underwent microarray analysis at both time points by the pathway analysis software program, Ingenuity Pathway Analysis.