Abstract
Gastric cancer (GC) remains an important malignancy worldwide with poor prognosis. Long noncoding RNAs (lncRNAs) can markedly affect cancer progression. Moreover, lncRNAs have been proposed as diagnostic or prognostic biomarkers of GC. Therefore, the current study aimed to explore lncRNA‐based prognostic biomarkers for GC. LncRNA expression profiles from the Gene Expression Omnibus (GEO) database were first downloaded. After re‐annotation of lncRNAs, a univariate Cox analysis identified 177 prognostic lncRNA probes in the training set http://www.ncbi.nlm.nih.gov/geo/query/acc.cgi?acc=GSE62254 (n = 225). Multivariate Cox analysis of each lncRNA with clinical characteristics as covariates identified a total of 46 prognostic lncRNA probes. Robust likelihood‐based survival and least absolute shrinkage and selection operator (LASSO) models were used to establish a 6‐lncRNA signature with prognostic value. Receiver operating characteristic (ROC) curve analyses were employed to compare survival prediction in terms of specificity and sensitivity. Patients with high‐risk scores exhibited a significantly worse overall survival (OS) than patients with low‐risk scores (log‐rank test P‐value <.0001), and the area under the ROC curve (AUC) for 5‐year survival was 0.77. A nomogram and forest plot were constructed to compare the clinical characteristics and risk scores by a multivariable Cox regression analysis, which suggested that the 6‐lncRNA signature can independently make the prognosis evaluation of patients. Single‐sample GSEA (ssGSEA) was used to determine the relationships between the 6‐lncRNA signature and biological functions. The internal validation set http://www.ncbi.nlm.nih.gov/geo/query/acc.cgi?acc=GSE62254 (n = 75) and the external validation set http://www.ncbi.nlm.nih.gov/geo/query/acc.cgi?acc=GSE57303 (n = 70) were successfully used to validate the robustness of our 6‐lncRNA signature. In conclusion, based on the above results, the 6‐lncRNA signature can effectively make the prognosis evaluation of GC patients.
Keywords: gastric cancer, GEO, least absolute shrinkage and selection operator (LASSO), long noncoding RNAs, prognosis, robust likelihood‐based survival
Identification of a 6‐lncRNA prognostic signature based on microarray re‐annotation in gastric cancer
1. INTRODUCTION
Gastric cancer (GC) is an important cancer worldwide, and nearly 1 000 000 new cases were reported in 2018. GC is a common cancer (ranking as the fifth) and the third common cause of cancer death.1 The incidence of GC morbidity is two times higher in males than that in females. Helicobacter pylori has been shown to be the major risk factor for GC, and the new cases caused by H pylori infection account for nearly 90% of all GC cases.2, 3 Surgical treatment remains the first line of treatment for GC patients. However, despite the advances in surgical methods, radiotherapy, chemotherapy, and neoadjuvant therapy, the prognosis of GC remains poor.4 GC prognosis highly varies by various regions, with an estimated 783 000 deaths in 2018.1 Thus, reducing the incidence of GC remains the key to reducing mortality.5, 6 Because this cancer results in a 20%‐30% survival rate at 5 years and a 5%‐10% survival rate in advanced stages,7 the clinical outcomes of patients are unsatisfactory. Therefore, the goal of the current study was to explore prognostic evaluation biomarkers in GC.
Long noncoding RNA (lncRNAs) are transcripts with more than 200 nucleotides, and dysregulated lncRNAs are associated with various human diseases.8 It has been reported that lncRNAs control several biological processes that affect multiple levels of gene expression from transcription to protein localization and stabilization.9 LncRNAs are commonly reported in human cancers including GC,10 breast,11 bladder,12 colon,13 and other cancers. LncRNAs can play important roles in cancer progression‐associated pathways, such as proliferation, growth, migration, invasion, and apoptosis. Many well‐known lncRNAs, such as HOTAIR,14 H19,15 BLACAT1,16 PCAT‐1,17 MEG3,18 and MALAT1,19 have been shown to be oncogenic factors or tumor suppressors. Additionally, these lncRNAs have been proposed as diagnostic or prognostic biomarkers of GC.
Recently, based on microarray and RNA‐seq methods, together with available open databases such as The Cancer Genome Atlas (TCGA) and Gene Expression Omnibus (GEO), people can easily obtain expression data for human cancers. In addition, using bioinformatics analysis, lncRNA signatures with prognostic value were established. For example, a two‐lncRNA signature, a potential biomarker for the prognosis of cervical cancer, was identified using a public database.20 Furthermore, there are different survival‐related lncRNA signatures in hepatocellular carcinoma,21 lung cancer,22 and pancreatic cancer.23 However, there have been few related studies in GC that can provide us with relevant insights.
In this study, we performed a multistep re‐annotation analysis of lncRNA expression in GC. Based on lncRNA expression profiles in http://www.ncbi.nlm.nih.gov/geo/query/acc.cgi?acc=GSE62254, we used robust likelihood‐based survival and LASSO models to establish a 6‐lncRNA signature with prognostic value. Patients with high‐risk scores had markedly worse overall survival (OS) than patients with low‐risk scores (log‐rank test P‐value <.0001), and the AUC for 5‐year survival was 0.77. In addition, the 6‐lncRNA signature could be used to independently make the prognosis evaluation of GC patients. The internal validation set http://www.ncbi.nlm.nih.gov/geo/query/acc.cgi?acc=GSE62254 and the external validation set http://www.ncbi.nlm.nih.gov/geo/query/acc.cgi?acc=GSE57303 were successfully used to validate the robustness of our 6‐lncRNA signature. In conclusion, based on the above results, the 6‐lncRNA signature displays a strong power for prognostic evaluation in GC patients.
2. MATERIALS AND METHODS
2.1. Data downloading and processing
We downloaded gene expression profiles of GC samples as MINiML formatted family files from the GEO database, which are available athttps://www.ncbi.nlm.nih.gov/geo/.24 Here, a total of two GEO datasets, namely, http://www.ncbi.nlm.nih.gov/geo/query/acc.cgi?acc=GSE62254 25 and http://www.ncbi.nlm.nih.gov/geo/query/acc.cgi?acc=GSE57303,26 were selected. The http://www.ncbi.nlm.nih.gov/geo/query/acc.cgi?acc=GSE62254 dataset contains 300 GC samples with clinical information (Table S1). In addition, http://www.ncbi.nlm.nih.gov/geo/query/acc.cgi?acc=GSE57303, used as an external validation set, contains 70 GC samples with clinical information (Table S2). Both used the Affymetrix Human Genome U133 Plus 2.0 Array platform. The clinical data included pathological T, N, and M classification, stage, and survival information of GC patients.
2.2. Re‐annotation of lncRNA classification
To evaluate lncRNA expression based on probe ID, we used the methods described by Zhang et al.27 Briefly,
We first mapped the Affymetrix Human Genome U133 Plus 2.0 Array probe set ID to NetAffx Annotation Files (http://www.affymetrix.com). The NetAffx files are the direct platform for probes including the probe set ID, gene symbol, gene title, Ensembl gene ID, Refseq transcript ID, and other information for the specific probe set.
Second, we extracted the probe sets assigned with an Ensembl gene ID and/or Refseq transcript ID in NetAffx annotations.
Then, for Refseq transcript ID, we only retained those labeled as “NR_” (NR represents nonprotein‐coding transcript in NCBI Reference Sequence Database). The short noncoding RNAs such as pseudogenes, microRNAs, and other short RNAs were removed.
For the probe sets with Ensembl IDs, we only retained those annotated with “lincRNA,” “processed transcripts,” “non‐coding,” or “misc_RNA” in Ensembl annotations.
Finally, corresponding Affymetrix probe IDs were used to generate annotated lncRNA transcript profiles (Table S3).
2.3. Univariate and multivariate Cox proportional hazard model
To select key lncRNA probes with prognostic values, we divided all patients in http://www.ncbi.nlm.nih.gov/geo/query/acc.cgi?acc=GSE62254 into two sets, namely, (a) a training set and (b) an internal validation set, in a random manner according to a ratio of 3:1. Next, we used the expression profiles of the above re‐annotated lncRNA probes and patients in the training set (n = 225). Using the R package survival, we performed a univariate Cox proportional hazards analysis using the coxph function. The statistical significance cutoff of the P‐value was considered at <.01. Then, we assessed other clinical features, including age, pT, pN, pM, and pStage, by Kaplan‐Meier analyses. The statistical significance cutoff of the P‐value was the same as above. Finally, we considered the above clinical factors as covariates. We performed a multivariate Cox proportional hazards analysis using prognostic lncRNA probes combined with clinical factors.
2.4. Prognosis‐related lncRNA selection by a robust likelihood‐based survival model
Robust likelihood‐based survival modeling was carried out for selecting prognosis‐related lncRNAs using the R package rbsurv. This model uses the partial likelihood of the Cox model as the underlying method. For robustness, this package selects survival‐associated genes by separating the two sets as a cross‐validation technology with large variability. It employs forward selection, generating some gene models, and selecting an optimal model by Akaike information criteria (AIC). According to the study by Wang et al,28 briefly, we randomly selected 75% of all samples in the training set using threefold cross‐validation. Moreover, the maximum number of genes was set to 30, and the analysis was repeated 1000 times. Finally, we summarized the results of each dimensionality reduction.
2.5. Construction of a prognostic lncRNA signature by LASSO modeling
Based on the above identification of prognosis‐related lncRNA probes for GC, we further needed to narrow the gene range and establish a prognostic signature. Thus, we performed LASSO analysis, which constructs a more refined model using a penalty function. This method can compress some coefficients to zero; therefore, some unimportant indicators are reduced to 0, leaving a small number of indicators, for which the weight is not 0. LASSO analysis was implemented with the R package glmnet.29
2.6. Prognostic evaluation using the 6‐lncRNA signature
Each lncRNA probe was accompanied by a formula of risk score, and the estimated regression coefficients were used to weight the formula in LASSO analysis. GC patients in the training and validation sets were divided into two groups, a group with high risk and a group with low risk, by taking the corresponding median risk score as the cutoff point. Kaplan‐Meier curves were used to compare the two groups regarding their survival outcomes with the assistance of the log‐rank test. Receiver operating characteristic (ROC) curve analysis was employed to compare survival prediction with regard to the specificity and sensitivity according to lncRNA risk scores. A P‐value <.05 was considered significant.
2.7. Analysis of the 6‐lncRNA signature and clinical characteristics
To examine the relationship between the prediction accuracy of prognostic signature and clinical characteristics such as age, sex, pStage, pT, pN, pM, and risk scores, we employed a univariate Cox proportional hazards model. Meanwhile, the differential patterns of various clinical characteristics were analyzed. A nomogram and forest plot were used to display the results of the multivariable Cox analysis including all of the above variables. The R packages rms and forestplot were used to construct the nomogram and forest plot, respectively.
2.8. Single‐sample GSEA (ssGSEA)
To observe the relationship between risk scores and biological functions, we used ssGSEA30 using the R package GSVA. ssGSEA, also called Gene Set Variation Analysis (GSVA), is a special Gene Set Enrichment Analysis (GSEA) that is mainly used for GSEA using single samples. This analysis enables the robust identification of a detailed change in pathway activity in a sample. Pearson's analysis was used to identify the correlation between risk scores and pathways. The cutoff of correlation was set at 0.3.
2.9. Validation of the 6‐lncRNA signature
The same risk formula was used to validate the internal validation set http://www.ncbi.nlm.nih.gov/geo/query/acc.cgi?acc=GSE62254 (n = 75), the entire set http://www.ncbi.nlm.nih.gov/geo/query/acc.cgi?acc=GSE62254 (n = 300), and the external validation set http://www.ncbi.nlm.nih.gov/geo/query/acc.cgi?acc=GSE57303 (n = 70). The Kaplan‐Meier curves for OS were used to compare the two groups regarding survival outcomes with the log‐rank test.
3. RESULTS
3.1. Prognosis‐related lncRNA screening by univariate Cox proportional hazard modeling
In this study, we performed a multistep re‐annotation analysis of lncRNA expression in GC (Figure 1). Based on the NetAffx Annotation Files (Ensembl gene ID and/or Refseq transcript ID) and above re‐annotation methods, a total of 2448 probe IDs (corresponding to 1970 lncRNA genes) were determined. The Ensembl and Refseq databases contributed to the annotation of 725 probe IDs (510 genes) in common. Besides, 512 probe IDs (379 genes) were annotated only by the Refseq database, and 1211 probe IDs (1081 genes) were annotated only by the Ensembl database.
Figure 1.
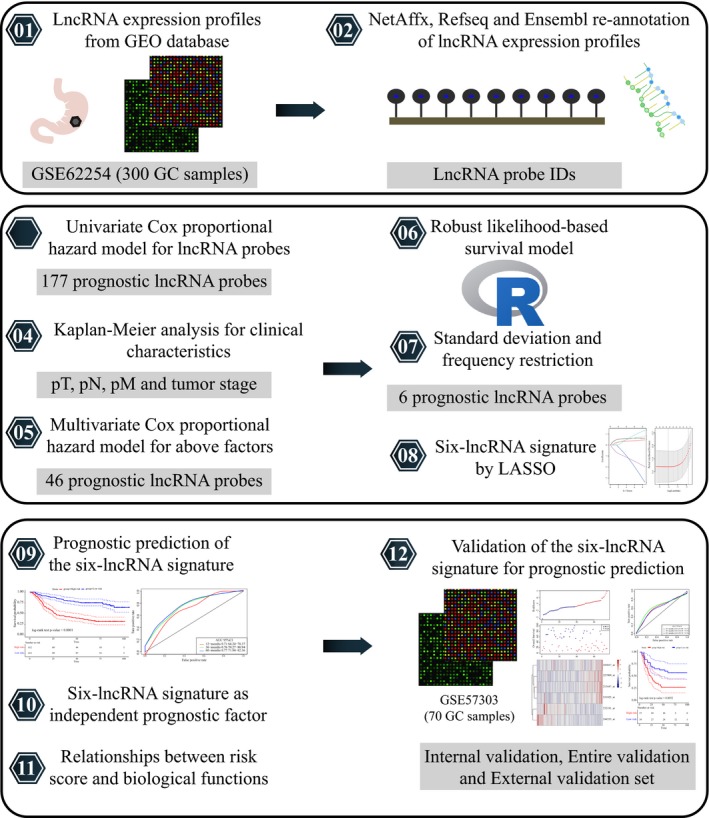
The schematic workflow of the present study
To select key lncRNA features with prognostic values, we employed a univariate Cox proportional hazards model. The expression data and clinical information corresponding to the http://www.ncbi.nlm.nih.gov/geo/query/acc.cgi?acc=GSE62254 dataset were first obtained. The samples in http://www.ncbi.nlm.nih.gov/geo/query/acc.cgi?acc=GSE62254 were divided into two sets based on the ratio of 3:1 in a random manner: the first is a training set, and the other is an internal validation set. The two sets contained 225 and 75 GC samples, respectively. http://www.ncbi.nlm.nih.gov/geo/query/acc.cgi?acc=GSE57303 (n = 70) was used as an external validation set. We included the patient's age, survival status, sex, T stage, N stage, M stage, and tumor stage (Table 1). A univariate Cox proportional hazards regression model was employed for 2448 re‐annotated lncRNAs and survival data in the training set. The coxph function in the R package survival was used to finally identify 177 prognostic lncRNA probes with a cutoff P‐value <.01 (Table S4). The most significant of the top 20 lncRNA probes are shown in Table 2.
Table 1.
The demographic characteristics of samples in the training and validation datasets
| Characteristics |
Training dataset http://www.ncbi.nlm.nih.gov/geo/query/acc.cgi?acc=GSE62254 (n = 225) |
Validation dataset http://www.ncbi.nlm.nih.gov/geo/query/acc.cgi?acc=GSE62254 (n = 75) |
Validation dataset http://www.ncbi.nlm.nih.gov/geo/query/acc.cgi?acc=GSE57303 (n = 70) |
|---|---|---|---|
| Age (y) | |||
| ≤60 | 87 | 30 | 29 |
| >60 | 138 | 45 | 39 |
| Survival status | |||
| Living | 116 | 32 | 34 |
| Dead | 109 | 43 | 36 |
| Gender | |||
| Female | 70 | 31 | 18 |
| Male | 155 | 44 | 52 |
| pT | |||
| T2 | 143 | 43 | 7 |
| T3 | 67 | 24 | 54 |
| T4 | 13 | 8 | 9 |
| pN | |||
| N0 | 24 | 14 | 13 |
| N1 | 103 | 28 | 26 |
| N2 | 63 | 17 | 26 |
| N3 | 35 | 16 | 5 |
| pM | |||
| M0 | 202 | 68 | 63 |
| M1 | 20 | 7 | 7 |
| pStage | |||
| Stage I | 20 | 10 | 3 |
| Stage II | 77 | 19 | 9 |
| Stage III | 74 | 21 | 41 |
| Stage IV | 52 | 25 | 17 |
| Lauren subtype | |||
| Diffuse | 107 | 35 | 35 |
| Intestinal | 112 | 38 | 20 |
| Mixed | 6 | 2 | 15 |
| MLH1 IHC | |||
| Negative | 48 | 16 | — |
| Positive | 176 | 58 | — |
| EBV ISH | |||
| Negative | 192 | 65 | — |
| Positive | 15 | 3 | — |
| Molecular subtype | |||
| MSS/TP53‐ | 82 | 25 | — |
| MSS/TP53+ | 59 | 20 | — |
| MSI | 48 | 20 | — |
| EMT | 36 | 10 | — |
Abbreviations: pM, pathology Metastasis stage; pN, pathology Lymph Node stage; pT, pathology Tumor stage.
Table 2.
The most significant of the top 20 lncRNA probes by univariate Cox proportional hazard model
| Probe IDs | P‐value | HR | Low 95% CI | High 95% CI |
|---|---|---|---|---|
| 236141_at | 1.08E−07 | 2.656 | 1.853 | 3.809 |
| 213447_at | 2.12E−07 | 4.327 | 2.488 | 7.525 |
| 219791_s_at | 4.61E−07 | 3.118 | 2.004 | 4.851 |
| 1559901_s_at | 1.31E−06 | 11.148 | 4.198 | 29.602 |
| 1564139_at | 2.01E−06 | 7.717 | 3.322 | 17.925 |
| 221974_at | 3.03E−06 | 2.612 | 1.745 | 3.908 |
| 235759_at | 3.49E−06 | 2.345 | 1.636 | 3.362 |
| 227909_at | 4.17E−06 | 4.957 | 2.507 | 9.801 |
| 242358_at | 4.65E−06 | 4.243 | 2.286 | 7.876 |
| 226582_at | 7.22E−06 | 2.511 | 1.679 | 3.753 |
| 1558828_s_at | 7.35E−06 | 2.647 | 1.730 | 4.052 |
| 1556695_a_at | 7.90E−06 | 6.592 | 2.882 | 15.075 |
| 229734_at | 7.98E−06 | 12.126 | 4.056 | 36.254 |
| 230589_at | 9.05E−06 | 27.102 | 6.313 | 116.348 |
| 1559965_at | 9.98E−06 | 11.411 | 3.874 | 33.606 |
| 232298_at | 1.10E−05 | 2.196 | 1.546 | 3.119 |
| 244553_at | 1.33E−05 | 0.070 | 0.021 | 0.232 |
| 1556364_at | 1.34E−05 | 5.857 | 2.643 | 12.978 |
| 225381_at | 1.34E−05 | 2.108 | 1.507 | 2.949 |
| 241834_at | 1.86E−05 | 9.697 | 3.427 | 27.433 |
Abbreviations: HR: hazard ratio; CI: confidence interval.
3.2. Prognosis‐related lncRNA screening by multivariate Cox proportional hazards modeling with clinical characteristics
Taking into account the clinicopathological characteristics, we evaluated tumor invasion (pT), lymph node (pN), metastasis (pM), and tumor stage (pStage) using Kaplan‐Meier analysis. As shown in Figure 2, we found that all of the above clinical factors have a significant impact on the prognosis of GC patients (with a log‐rank test P‐value less than .0001). We further performed multivariate Cox proportional hazards modeling of each significant lncRNA probe (n = 177) combined with clinical characteristics as covariates. Thus, we performed 177 multivariate Cox analyses and finally a total of 46 lncRNA probes had a significance threshold < 0.01 (Table S5).
Figure 2.
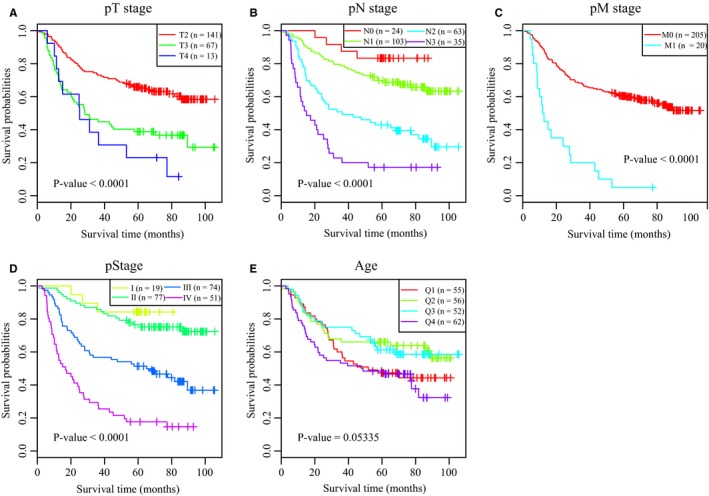
Screening of prognosis‐related clinical characteristics by Kaplan‐Meier analyses. A, Kaplan‐Meier curves based on different pT stages. B, Kaplan‐Meier curves based on different pN stages. C, Kaplan‐Meier curves based on different pM stages. D, Kaplan‐Meier curves based on different tumor stages. E, Kaplan‐Meier curves based on different age groups, where Q1, Q2, Q3, and Q4 represent quartiles
3.3. Establishment of a 6‐lncRNA signature by robust likelihood‐based survival and LASSO models
To identify lncRNAs related to survival, we used the R package rbsurv to construct a robust likelihood‐based survival model. It used the partial likelihood of the Cox model, which has been the basic method. The method implemented robust likelihood‐based survival analysis, repeated 1000 times. We calculated the standard deviation of all lncRNA probes (Figure 3A). The red bar represents lncRNA probes among the top 46 prognostic lncRNAs with frequencies >100. Finally, we selected lncRNAs with standard deviations greater than the standard deviations of all probes and frequencies greater than 500. As shown in Figure 3B, we identified a total of six lncRNA probes in our analysis, including 213447_at, 227909_at, 231925_at, 232191_at, 243017_at, and 244553_at.
Figure 3.
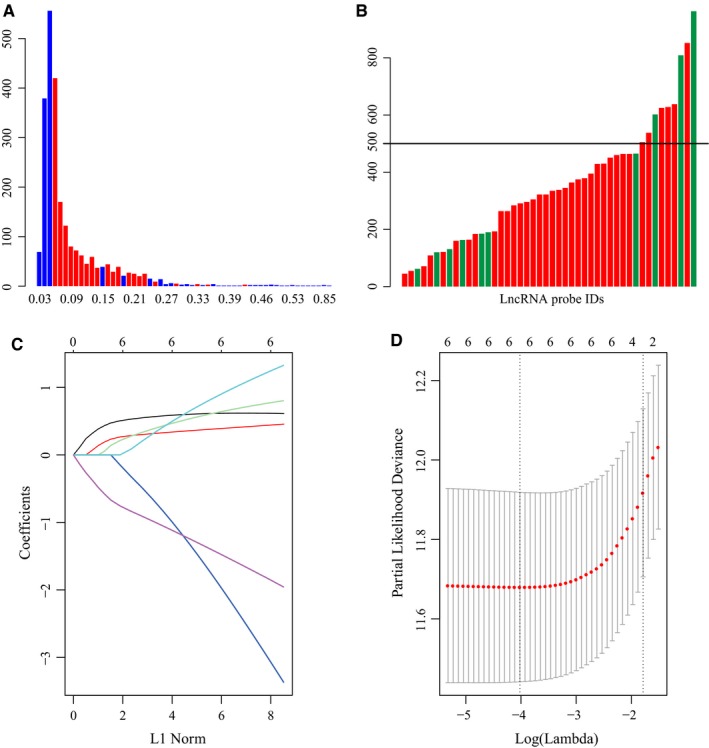
Screening of significant lncRNAs by robust likelihood‐based survival and LASSO models. A, The distribution of all lncRNA probes and standard deviation. The red bar indicates the standard deviation of the lncRNA probe with a frequency greater than 100; the horizontal axis represents the standard deviation, and the vertical axis represents the number of probes. B, The frequency distribution of lncRNA probes selected by the robust likelihood‐based survival model. The horizontal axis represents lncRNA probes, and the vertical axis represents the frequency of occurrence 1000 times. The red bar indicates the standard deviation of the lncRNA probe greater than the median standard deviation of all probes. C, Three‐time cross‐validation for tuning parameter selection in the LASSO model. D, The distribution of each lambda and CI
Next, we performed a LASSO analysis, which selected lncRNAs affecting GC prognosis via regression coefficient shrinkage based on a penalty that is proportional to size. As shown in Figure 3C, we found that as the lambda increases, the number of independent coefficients tends toward zero. We used threefold cross‐validation to build this model. The confidence interval (CI) under each lambda was analyzed as shown in Figure 3D. The model was optimal when the lambda was 0.017953. Therefore, we chose the model with a lambda of 0.017953 as the final model, containing a total of six lncRNA probes. The prognostic score was imputed below: Risk score = 0.617 * IPW (lncRNA‐IPW) expression level + 0.429 * NCRNA00086 expression level + 0.744 * RP11‐38P22.2 expression level + (−2.794) * ERVH48‐1 expression level + 1.165 * LOC158572 expression level + (−1.761) * AC004080.17 expression level. The results of univariate Cox analysis and their details are shown in Table 3.
Table 3.
The results of univariate Cox analysis and their information
| Probe IDs | P‐value | HR | Low 95% CI | High 95% CI | Ref seq symbol | Ensembl symbol |
|---|---|---|---|---|---|---|
| 213447_at | 2.12E‐07 | 4.327 | 2.488 | 7.525 | IPW | — |
| 227909_at | 4.17E‐06 | 4.957 | 2.507 | 9.801 | NCRNA00086 | NCRNA00086 |
| 231925_at | 5.73E‐05 | 4.770 | 2.228 | 10.210 | — | RP11‐38P22.2 |
| 232191_at | 0.0026 | 0.009 | 0.000 | 0.191 | — | ERVH48‐1 |
| 243017_at | 0.0006 | 44.374 | 5.016 | 392.582 | LOC158572 | — |
| 244553_at | 1.33E‐05 | 0.070 | 0.021 | 0.232 | — | AC004080.17 |
Abbreviations: CI: confidence interval; HR: hazard ratio; IPW, lncRNA‐IPW.
3.4. Prognostic evaluation by the 6‐lncRNA signature in GC
The 6‐lncRNA signature‐based risk score for each patient was calculated in the training set (n = 225). The median cutoff point of risk scores was used to divide all patients into groups with a high risk (n = 112) and a low risk (n = 113). Figure 4A displays the distribution of the risk score for each patient in the training set. Patients with a high‐risk score had an obviously worse OS than patients with a low‐risk score (log‐rank test P‐value <.0001, Figure 4B). The probes 213447_at, 227909_at, 231925_at, and 243017_at with high expression levels and high‐risk scores were considered risk factors. In addition, the high expression levels of 232191_at and 244553_at and low‐risk scores were protective factors.
Figure 4.
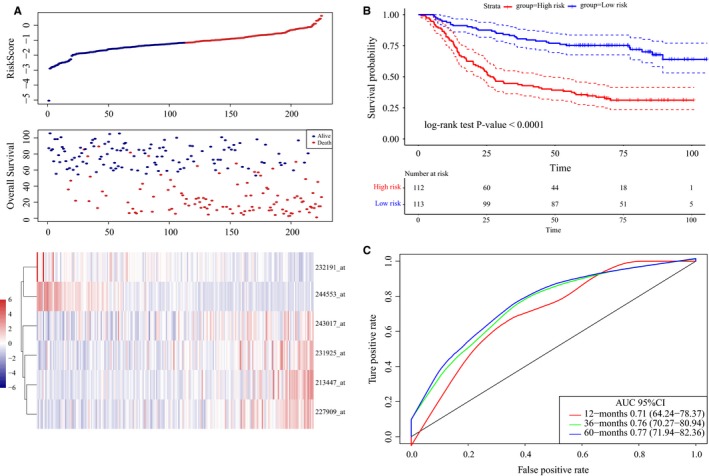
LncRNA risk score analysis using the training set http://www.ncbi.nlm.nih.gov/geo/query/acc.cgi?acc=GSE62254. A, Distribution of 6‐lncRNA‐based risk scores, lncRNA expression levels, and patient survival durations in the training set http://www.ncbi.nlm.nih.gov/geo/query/acc.cgi?acc=GSE62254 (n = 225). B, Kaplan‐Meier curves of OS according to the 6‐lncRNA signature. C, ROC curve analyses based on the 6‐lncRNA signature
Additionally, ROC curve analyses were implemented to compare whether the survival prediction was sensitive and specific among the 6‐lncRNA signature‐based risk scores (Figure 4C). The AUCs were assessed by 1‐year (AUC = 0.71), 3‐year (AUC = 0.76), and 5‐year (AUC = 0.77) survival, suggesting that this 6‐lncRNA signature can effectively make the prognosis evaluation of GC patients.
3.5. The 6‐lncRNA signature as an independent factor for prognosis
The role of the 6‐lncRNA signature as an independent factor for GC prognosis was also tested. A univariate Cox regression analysis was implemented at first to determine the association between the 6‐lncRNA signature‐based risk score (HR = 3.05, 95% CI 2.26‐4.12, P‐value <.0001) and prognosis of GC (Table S6).
Furthermore, we analyzed the risk score distribution among different clinical stages, degrees of tumor invasion, degrees of lymph node involvement, and metastasis (Figure 5A). The results suggested that there were significant differences in risk scores based on different stages, and more advanced stages were associated with higher risk scores. Moreover, similar trends were observed for other clinical characteristics including pT, pN, and pM. Besides, we observed the prognostic evaluation ability of this model especially in Stage III and Stage IV in GC. As shown in Figure S1A,B, we found this 6‐lncRNA signature was with an AUC of 0.81 for 5‐year survival and the OS times of patients in the high‐risk group were significantly shorter than those in the low‐risk group in Stage III (log‐rank test P‐value <.0001). In addition, the 6‐lncRNA signature was with an AUC of 0.75 for 5‐year survival and different survival outcomes in Stage IV (log‐rank test P‐value = .02).
Figure 5.
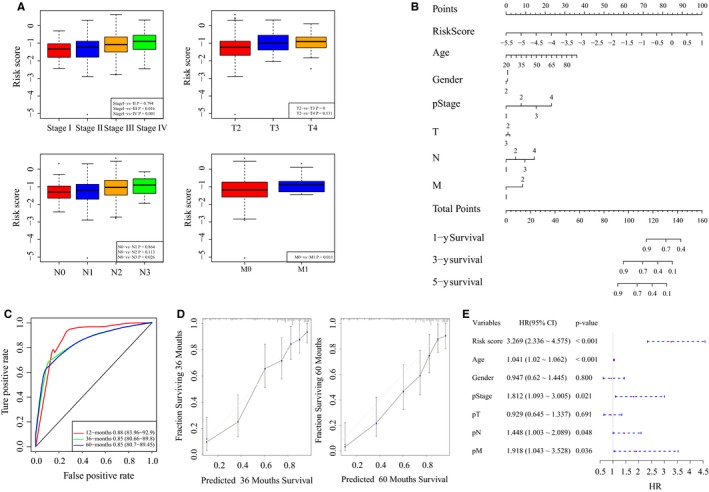
The association between the 6‐lncRNA signature and clinical characteristics. A, The distribution of risk scores according to different clinical information. B, The nomogram to predict the probabilities 1‐y, 3‐y, and 5‐y OS in patients. C, ROC curves according to the nomogram and lncRNA risk score. D, Calibration plots to predict the 3‐y and 5‐y OS of patients. The probability of survival predicted by the nomogram was plotted on the x‐axis, and actual survival was plotted on the y‐axis. E, The forest plot of risk scores and clinical characteristics
Next, we established a nomogram using clinical features, including age, sex, pT, pN, pM, pStage, and risk score (Figure 5B). The AUC for 3‐year survival using the predictive nomogram reached 0.85 (Figure 5C). According to the calibration curve, predictive values were consistent with observed values considering the probabilities of 3‐year OS and 5‐year OS (Figure 5D). Moreover, we used a forest plot to visualize the distribution of the clinical features including pT, pN, pM, pStage, and risk score by a multivariable Cox regression analysis (Figure 5E). The HR of the risk score was approximately 3.27 with a P‐value <.001 (Table S7).
3.6. Relationships between the 6‐lncRNA signature and biological functions
To observe the relationships between risk scores and biological functions across different samples, we selected the gene expression profiles corresponding to these samples using the R package GSVA for ssGSEA. By calculating the scores for each sample based on different biological functions, we further calculated the correlation between these functions and risk scores (Table S8). As shown in Figure S2A, Kyoto Encyclopedia of Genes and Genomes (KEGG) pathways with correlations greater than 0.3 were selected. Most of these pathways were negatively correlated with the sample risk scores, and a small number of pathways were positively related to the risk score. We selected the top 20 most relevant KEGG pathways and performed cluster analysis based on their enrichment scores (Figure S2B). Pathways such as adherens junction, gap junction, and Wnt signaling were activated as the risk score increased. Moreover, pathways such as the p53 signaling and base excision repair were suppressed as the risk score increased, suggesting an imbalance in these pathways in GC.
3.7. Validation of the 6‐lncRNA signature for prognostic evaluation
To determine the robustness of this model, we used the same coefficients in the validation sets. First, using the same risk formula in the internal validation set http://www.ncbi.nlm.nih.gov/geo/query/acc.cgi?acc=GSE62254 (n = 75), we classified patients into groups with a high risk (n = 37) and a low risk (n = 38) taking the median score as the cutoff point. The distributions of risk scores, survival durations of patients, and lncRNA expression levels are shown in Figure 6A. The Kaplan‐Meier curves of OS suggested that patients with high‐risk scores had significantly worse OS than patients with low‐risk scores (log‐rank test P‐value = .005, Figure 6C). The AUC exhibited by the 6‐lncRNA signature for 5‐year survival reached 0.65 (Figure 6B).
Figure 6.
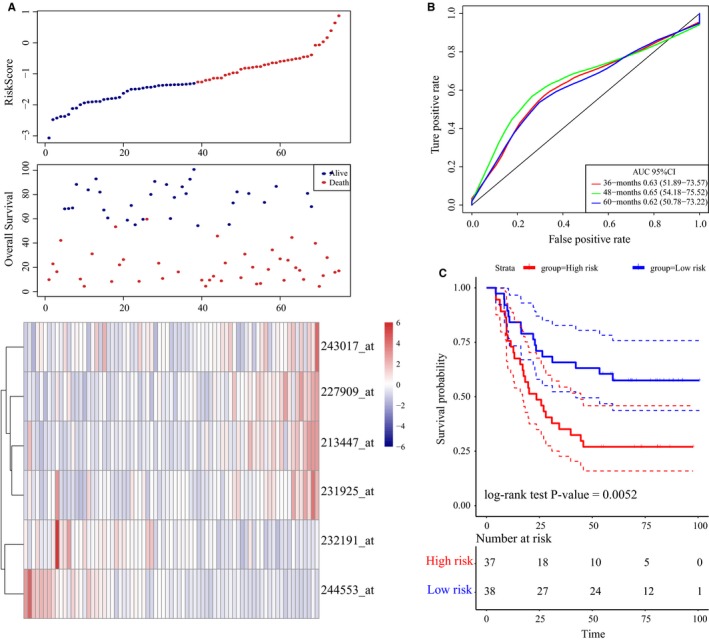
LncRNA risk score analysis using the internal validation set http://www.ncbi.nlm.nih.gov/geo/query/acc.cgi?acc=GSE62254. A, Distribution of 6‐lncRNA‐based risk scores, lncRNA expression levels and patient survival durations in the internal validation set http://www.ncbi.nlm.nih.gov/geo/query/acc.cgi?acc=GSE62254 (n = 75). B, ROC curve analyses based on the 6‐lncRNA signature. C, Kaplan‐Meier curves of OS based on the 6‐lncRNA signature
In addition, the distribution of risk scores, lncRNA expression signatures, and survival durations in http://www.ncbi.nlm.nih.gov/geo/query/acc.cgi?acc=GSE62254 (n = 300) was evaluated (Figure S3A). We also validated the robustness of this 6‐lncRNA signature with an AUC of 0.73 for 5‐year survival (Figure S3B). Moreover, the survival outcomes of patients in the high‐risk group were worse than that of patients in the low‐risk group (log‐rank test P‐value <.0001, Figure S3C). In agreement with the abovementioned findings, the OS times of patients in the high‐risk group were markedly shorter than that of patients in the low‐risk group from the external validation set (http://www.ncbi.nlm.nih.gov/geo/query/acc.cgi?acc=GSE57303, n = 70, log‐rank test P‐value = 0.03, Figure 7A‐C). According to the abovementioned findings, the 6‐lncRNA signature can be used to effectively make the prognosis evaluation of GC patients.
Figure 7.
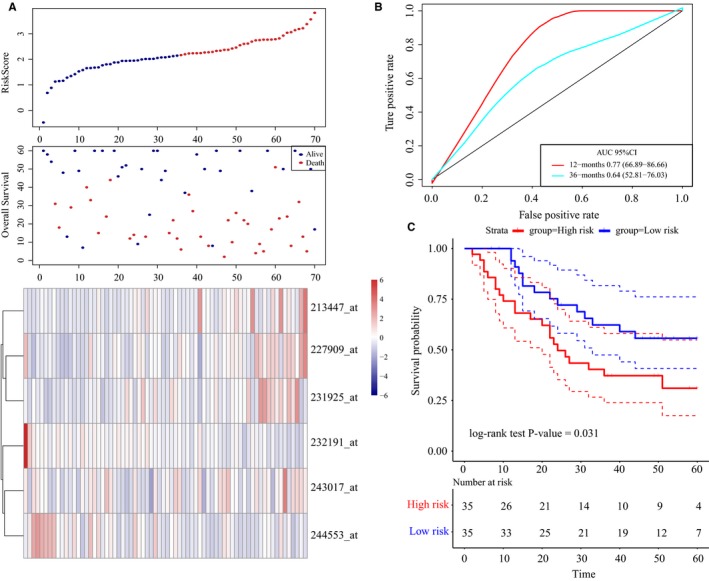
LncRNA risk score analysis using the external validation set http://www.ncbi.nlm.nih.gov/geo/query/acc.cgi?acc=GSE57303. A, Distribution of 6‐lncRNA‐based risk scores, lncRNA expression levels, and patient survival durations in the external validation set http://www.ncbi.nlm.nih.gov/geo/query/acc.cgi?acc=GSE57303 (n = 70). B, ROC curve analyses based on the 6‐lncRNA signature. C, Kaplan‐Meier curves of OS based on the 6‐lncRNA signature
4. DISCUSSION
In this study, we performed a multistep re‐annotation analysis of lncRNA expression in GC. Based on the lncRNA expression profiles of http://www.ncbi.nlm.nih.gov/geo/query/acc.cgi?acc=GSE62254, robust likelihood‐based survival and LASSO models were used to establish a 6‐lncRNA signature with prognostic value. In addition, the internal validation set http://www.ncbi.nlm.nih.gov/geo/query/acc.cgi?acc=GSE62254 and the external validation set http://www.ncbi.nlm.nih.gov/geo/query/acc.cgi?acc=GSE57303 were successfully used to validate the robustness of our 6‐lncRNA signature. The above results indicated that the 6‐lncRNA signature exhibited a robust ability to make the prognosis evaluation of GC patients.
Prognostic evaluation remains necessary for the selection of appropriate treatments for cancer patients because of poor prognosis. Recently, lncRNAs have been identified as significant regulators in various human cancers. Moreover, some lncRNAs and lncRNA signatures have been treated as potential prognostic indicators. Based on a meta‐analysis, lncRNA BLACAT1 may serve as a prognostic predictor in cancer,16 similar to other well‐known lncRNAs, such as H19,15 PVT1,31 HOTAIR,32 and PANDAR.33 There have been many studies on the lncRNA signatures for GC. For example, Zhu et al34 used http://www.ncbi.nlm.nih.gov/geo/query/acc.cgi?acc=GSE62254 and http://www.ncbi.nlm.nih.gov/geo/query/acc.cgi?acc=GSE15459 datasets to establish a set of 24 lncRNAs that showed an obvious relation to disease‐free survival (DFS) in GC. In addition, based on the TCGA database and LASSO models, Cheng identified a 3‐lncRNA prognostic signature including RP11‐108 M12.3, CYP4A22‐AS1, and AP000695.6.35 Using the random survival forests method, Song et al36 found a set of three lncRNAs including TGFB2‐OT1, LINC01140, and RP11‐347C12.10. Fan et al37 also used GEO datasets and survival forest algorithm to build a 5‐lncRNA signature with prognostic value of 0.86. In another study,38 http://www.ncbi.nlm.nih.gov/geo/query/acc.cgi?acc=GSE79973, including 10 paired GC and normal tissues, was first used to identify the differentially expressed lncRNAs. Based on LASSO Cox regression model, 12‐lncRNA signature was finally identified with AUC of 0.869. Although there have been a series of methods for lncRNA signature establishment, the power of prognostic evaluation was different for each study. The ROC values of some models proposed in other literatures were higher than the model proposed in our study; however, the number of lncRNAs in these prognostic signatures was much higher than that in our 6‐lncRNA signature (5‐year AUC = 0.77 in our study). Considering clinical application values, the number of lncRNAs in the model should be as small as possible with high prognostic evaluation value. Here, we compared the predictive power using the AUC value among recent reports on lncRNA signatures in GC (Table 4).
Table 4.
The comparison of studies about lncRNA signature for GC
| Databases | Methods | LncRNA signature | LncRNA symbols | AUC value | Reference |
|---|---|---|---|---|---|
| http://www.ncbi.nlm.nih.gov/geo/query/acc.cgi?acc=GSE62254 and http://www.ncbi.nlm.nih.gov/geo/query/acc.cgi?acc=GSE15459 | Random survival forest‐variable hunting | 24‐lncRNAs | AF035291, AI028608, AK026189, H04858, BC037827, BC038210, AI916498, AA463827, AA041523, BE621082, AK056852, AW206234, AL703532, AI095542, AI080288, BC021187, BF238392, BC005107, BC039674, AI056187, T79746, H11436, BF511694, and BC035722 | 0.82 | Zhu et al |
| TCGA | LASSO Cox regression model | 3‐lncRNAs | CYP4A22‐AS1, AP000695.6, and RP11‐108M12.3 | 0.737 | Cheng et al |
| http://www.ncbi.nlm.nih.gov/geo/query/acc.cgi?acc=GSE62254 and http://www.ncbi.nlm.nih.gov/geo/query/acc.cgi?acc=GSE15459 | Univariable Cox regression analysis and random survival forest‐variable hunting | 3‐lncRNAs | LINC01140, TGFB2‐OT1, and RP11‐347C12.10 | 0.688 | Song et al |
| TCGA | Limma, univariate, and multivariate Cox regression models | 5‐lncRNAs | CTD‐2616J11.14, RP1‐90G24.10, RP11‐150O12.3, RP11‐1149O23.2, and MLK7‐AS1 | None | Ren et al |
| http://www.ncbi.nlm.nih.gov/geo/query/acc.cgi?acc=GSE65801, http://www.ncbi.nlm.nih.gov/geo/query/acc.cgi?acc=GSE29998, E‐MTAB‐1338, and TCGA | Weighted correlation network and LASSO analysis | 11‐lncRNAs | ARHGAP5‐AS1, FLVCR1‐AS1, H19, HOTAIR, LINC00221, MCF2L‐AS1, MUC2, PRSS30P, SCARNA9, TP53TG1, and XIST | None | Zhang et al |
| http://www.ncbi.nlm.nih.gov/geo/query/acc.cgi?acc=GSE27342, http://www.ncbi.nlm.nih.gov/geo/query/acc.cgi?acc=GSE38749, http://www.ncbi.nlm.nih.gov/geo/query/acc.cgi?acc=GSE50710, and http://www.ncbi.nlm.nih.gov/geo/query/acc.cgi?acc=GSE63089 | Random survival forest‐variable hunting | 5‐lncRNAs | AK001094, AK024171, AK093735, BC003519, and NR_003573 | 0.95 | Fan et al |
Robust likelihood‐based survival modeling is frequently used in prognostic signature construction for cancers in recent years. For example, a prognostic 11‐lncRNA expression signature was constructed for breast invasive carcinoma (BRCA).39 In that study, He et al used the lncRNA expression profiles of BRCA samples obtained from the TCGA database. They carried out a univariable Cox analysis for the convenience of primary screening and repeated the modeling process approximately 1000 times for robust likelihood‐based survival. Thus, 11 lncRNAs with frequencies exceeding 600 were chosen for predicting BRCA prognosis, which offered new insights into the potential treatment approaches for breast cancer. For lung squamous cell carcinoma, Luo et al40 used RNA‐Seq data of primary lung cancer samples from TCGA database and a robust likelihood‐based survival model to establish a 4‐lncRNA‐based prognostic model. In addition, a 4‐lncRNA prognostic signature was identified in head and neck squamous cell carcinoma by Diao et al41 based on TCGA database using robust likelihood‐based survival, random sampling iteration, and univariate Cox regression survival analyses. However, there have been no studies on lncRNA signatures in GC.
In our study, using the robust likelihood‐based survival and LASSO models, we established a 6‐lncRNA signature with prognostic value in GC. These six lncRNAs were IPW, NCRNA00086, RP11‐38P22.2, ERVH48‐1, LOC158572, and AC004080.17. The human homologue IPW of the lncRNA IPW is located on chromosome 15, which is deleted in over 70% of patients with Prader‐Willi syndrome (PWS).42 ERVH48‐1 has been considered as a new biomarker for evaluation of the prognosis of tongue squamous cell carcinoma by analyzing the competing endogenous RNA network associated with lncRNAs.43 However, NCRNA00086, RP11‐38P22.2, LOC158572, and AC004080.17 have been reported for the first time in our present study. According to these findings, these lncRNAs might play an unknown biological role in GC tumorigenesis.
Regarding the results of ssGSEA, we found that several pathways, such as adherens junction, gap junction, calcium signaling, actin cytoskeleton regulation, extracellular matrix receptor interaction, Wnt signaling, and mammalian target of rapamycin (mTOR) signaling, were positively associated with risk scores. The mTOR signaling pathway participates in different human cancers.44 Oncogenic activation of the mTOR signaling pathway is beneficial for the development, proliferation, and survival of cancer cells, which emphasizes that targeting carcinogenic mTOR pathway members can be used to effectively treat cancer.45 In addition, catenins and cadherins act as central molecules between cells in adherens junction and play essential roles in cell adhesion, tissue morphogenesis, and cancer.46 Therefore, the activation of the above pathways may lead to tumorigenesis and the development and progression of GC.
Accurate prognosis is the basis for planning appropriate treatments for cancer patients. Due to the heterogeneity, the stage of greater change in survival rate will encounter greater uncertainty. Patient outcomes vary widely even within similarly staged cohorts.47 Thus, techniques utilizing multidimensional data not limited to tumor, node, metastasis staging system with histopathological features can improve the prognosis of cancer patients. For example, Dimitriou et al47 made a point that a principled machine learning framework can improve accuracy of stage II colorectal cancer prognosis. In our study, we identified a 6‐lncRNA prognostic signature in GC. Besides, we observed the prognostic evaluation ability of this model especially in Stage III and Stage IV in GC. Results determined that our model had the value of prognostic evaluations in patients with advanced GC.
Although the 6‐lncRNA prognostic signature identified in our study was robust, there were several limitations. First, we need to validate this 6‐lncRNA signature in large‐scale clinical GC samples. Second, this signature should be subjected to prospective validation prior to its clinical applications. Finally, whether the 6‐lncRNA combined with other clinical characteristics can increase the predictive power of based on AUC values remains an interesting question for us.
In conclusion, we performed multistep prognostic analyses of lncRNAs in GC. Robust likelihood‐based survival and LASSO models were used to successfully establish a 6‐lncRNA prognostic signature. The robustness of our 6‐lncRNA signature was also validated. In conclusion, the 6‐lncRNA signature can effectively make GC patient prognosis evaluation.
CONFLICT OF INTEREST
The authors declare that there was no conflict of interest.
AUTHORS' CONTRIBUTIONS
BM conceived and designed the study. BM and YML performed this work. BM drafted the manuscript. YPR reviewed and revised the paper. All authors read and approved the manuscript.
Supporting information
ACKNOWLEDGMENT
We thank the Department of Colorectal Surgery in Liaoning Cancer Hospital and Institute for technical advice. We also gratefully thank American Journal Experts (https://www.aje.cn/) for editing the present paper.
Ma B, Li Y, Ren Y. Identification of a 6‐lncRNA prognostic signature based on microarray re‐annotation in gastric cancer. Cancer Med. 2020;9:335–349. 10.1002/cam4.2621
DATA AVAILABILITY STATEMENT
The data used for supporting the results of the study are included within the article.
REFERENCES
- 1. Bray F, Ferlay J, Soerjomataram I, Siegel RL, Torre LA, Jemal A. Global cancer statistics 2018: GLOBOCAN estimates of incidence and mortality worldwide for 36 cancers in 185 countries. CA Cancer J Clin. 2018;68(6):394‐424. [DOI] [PubMed] [Google Scholar]
- 2. Plummer M, Franceschi S, Vignat J, Forman D, de Martel C. Global burden of gastric cancer attributable to Helicobacter pylori. Int J Cancer. 2015;136(2):487‐490. [DOI] [PubMed] [Google Scholar]
- 3. Youn Nam S, Park BJ, Nam JH, et al. Association of current Helicobacter pylori infection and metabolic factors with gastric cancer in 35,519 subjects: a cross‐sectional study. United Eur Gastroenterol J. 2019;7(2):287‐296. [DOI] [PMC free article] [PubMed] [Google Scholar]
- 4. Tan Z. Recent advances in the surgical treatment of advanced gastric cancer: a review. Med Sci Monit. 2019;25:3537‐3541. [DOI] [PMC free article] [PubMed] [Google Scholar]
- 5. Balakrishnan M, George R, Sharma A, Graham DY. Changing trends in stomach cancer throughout the world. Curr Gastroenterol Rep. 2017;19(8):36. [DOI] [PMC free article] [PubMed] [Google Scholar]
- 6. Rawla P, Barsouk A. Epidemiology of gastric cancer: global trends, risk factors and prevention. Prz Gastroenterol. 2019;14(1):26‐38. [DOI] [PMC free article] [PubMed] [Google Scholar]
- 7. Casamayor M, Morlock R, Maeda H, Ajani J. Targeted literature review of the global burden of gastric cancer. Ecancermedicalscience. 2018;12:883. [DOI] [PMC free article] [PubMed] [Google Scholar]
- 8. Mathias C, Zambalde EP, Rask P, Gradia DF, de Oliveira JC. Long non‐coding RNAs differential expression in breast cancer subtypes: what do we know? Clin Genet. 2019;95(5):558‐568. [DOI] [PubMed] [Google Scholar]
- 9. Gugnoni M, Long CA. Noncoding RNA and epithelial mesenchymal transition in cancer. Int J Mol Sci. 2019;20(8):1924. [DOI] [PMC free article] [PubMed] [Google Scholar]
- 10. Nasrollahzadeh‐Khakiani M, Emadi‐Baygi M, Schulz WA, Nikpour P. Long noncoding RNAs in gastric cancer carcinogenesis and metastasis. Brief Funct Genomics. 2017;16(3):129‐145. [DOI] [PubMed] [Google Scholar]
- 11. Youness RA, Gad MZ. Long non‐coding RNAs: functional regulatory players in breast cancer. Noncoding RNA Res. 2019;4(1):36‐44. [DOI] [PMC free article] [PubMed] [Google Scholar]
- 12. Zhu W, Liu H, Wang X, Lu J, Yang W. Long noncoding RNAs in bladder cancer prognosis: a meta‐analysis. Pathol Res Pract. 2019;215(6):152429. [DOI] [PubMed] [Google Scholar]
- 13. Tang X, Qiao X, Chen C, Liu Y, Zhu J, Liu J. Regulation mechanism of long noncoding RNAs in colon cancer development and progression. Yonsei Med J. 2019;60(4):319‐325. [DOI] [PMC free article] [PubMed] [Google Scholar]
- 14. Botti G, Scognamiglio G, Aquino G, Liguori G, Cantile M. LncRNA HOTAIR in tumor microenvironment: what role? Int J Mol Sci. 2019;20(9):2279. [DOI] [PMC free article] [PubMed] [Google Scholar]
- 15. Liu Y, He A, Liu B, Huang Z, Mei H. Potential role of lncRNA H19 as a cancer biomarker in human cancers detection and diagnosis: a pooled analysis based on 1585 subjects. Biomed Res Int. 2019;2019:9056458. [DOI] [PMC free article] [PubMed] [Google Scholar]
- 16. Lu H, Liu H, Yang X, et al. LncRNA BLACAT1 may serve as a prognostic predictor in cancer: evidence from a meta‐analysis. Biomed Res Int. 2019;2019:1275491. [DOI] [PMC free article] [PubMed] [Google Scholar]
- 17. Xiong T, Li J, Chen F, Zhang F. PCAT‐1: a novel oncogenic long non‐coding RNA in human cancers. Int J Biol Sci. 2019;15(4):847‐856. [DOI] [PMC free article] [PubMed] [Google Scholar]
- 18. Al‐Rugeebah A, Alanazi M, Parine NR. MEG3: an oncogenic long non‐coding RNA in different cancers. Pathol Oncol Res. 2019;25(3):859‐874. [DOI] [PubMed] [Google Scholar]
- 19. Sun Y, Ma L. New insights into long non‐coding RNA MALAT1 in cancer and metastasis. Cancers. 2019;11(2):216. [DOI] [PMC free article] [PubMed] [Google Scholar]
- 20. Wu W, Sui J, Liu T, et al. Integrated analysis of two‐lncRNA signature as a potential prognostic biomarker in cervical cancer: a study based on public database. PeerJ. 2019;7:e6761. [DOI] [PMC free article] [PubMed] [Google Scholar]
- 21. Sun Y, Zhang F, Wang L, et al. A five lncRNA signature for prognosis prediction in hepatocellular carcinoma. Mol Med Rep. 2019;19(6):5237‐5250. [DOI] [PMC free article] [PubMed] [Google Scholar]
- 22. Zhou H, Zhang H, Chen J, et al. A seven‐long noncoding RNA signature predicts relapse in patients with early‐stage lung adenocarcinoma. J Cell Biochem. 2019;120(9):15730‐15739. [DOI] [PubMed] [Google Scholar]
- 23. Zhang H, Zhu M, Du Y, et al. A panel of 12‐lncRNA signature predicts survival of pancreatic adenocarcinoma. J Cancer. 2019;10(6):1550‐1559. [DOI] [PMC free article] [PubMed] [Google Scholar]
- 24. Edgar R, Domrachev M, Lash AE. Gene expression omnibus: NCBI gene expression and hybridization array data repository. Nucleic Acids Res. 2002;30(1):207‐210. [DOI] [PMC free article] [PubMed] [Google Scholar]
- 25. Cristescu R, Lee J, Nebozhyn M, et al. Molecular analysis of gastric cancer identifies subtypes associated with distinct clinical outcomes. Nat Med. 2015;21(5):449‐456. [DOI] [PubMed] [Google Scholar]
- 26. Qian Z, Zhu G, Tang L, et al. Whole genome gene copy number profiling of gastric cancer identifies PAK1 and KRAS gene amplification as therapy targets. Genes Chromosomes Cancer. 2014;53(11):883‐894. [DOI] [PubMed] [Google Scholar]
- 27. Zhang X, Sun S, Pu JK, et al. Long non‐coding RNA expression profiles predict clinical phenotypes in glioma. Neurobiol Dis. 2012;48(1):1‐8. [DOI] [PubMed] [Google Scholar]
- 28. Wang Y, Ren F, Chen P, Liu S, Song Z, Ma X. Identification of a six‐gene signature with prognostic value for patients with endometrial carcinoma. Cancer Med. 2018;7(11):5632‐5642. [DOI] [PMC free article] [PubMed] [Google Scholar]
- 29. Friedman J, Hastie T, Tibshirani R. Regularization paths for generalized linear models via coordinate descent. J Stat Softw. 2010;33(1):1‐22. [PMC free article] [PubMed] [Google Scholar]
- 30. Hanzelmann S, Castelo R, Guinney J. GSVA: gene set variation analysis for microarray and RNA‐seq data. BMC Bioinformatics. 2013;14:7. [DOI] [PMC free article] [PubMed] [Google Scholar]
- 31. Lu D, Luo P, Wang Q, Ye Y, Wang B. lncRNA PVT1 in cancer: a review and meta‐analysis. Clin Chim Acta. 2017;474:1‐7. [DOI] [PubMed] [Google Scholar]
- 32. Botti G, Marra L, Malzone MG, et al. LncRNA HOTAIR as prognostic circulating marker and potential therapeutic target in patients with tumor diseases. Curr Drug Targets. 2017;18(1):27‐34. [DOI] [PubMed] [Google Scholar]
- 33. Ma PJ, Guan QK, Xu DW, Zhao J, Qin N, Jin BZ. LncRNA PANDAR as a prognostic marker in Chinese cancer. Clin Chim Acta. 2017;475:172‐177. [DOI] [PubMed] [Google Scholar]
- 34. Zhu X, Tian X, Yu C, et al. A long non‐coding RNA signature to improve prognosis prediction of gastric cancer. Mol Cancer. 2016;15(1):60. [DOI] [PMC free article] [PubMed] [Google Scholar]
- 35. Cheng P. A prognostic 3‐long noncoding RNA signature for patients with gastric cancer. J Cell Biochem. 2018;119(11):9261‐9269. [DOI] [PubMed] [Google Scholar]
- 36. Song P, Jiang B, Liu Z, Ding J, Liu S, Guan W. A three‐lncRNA expression signature associated with the prognosis of gastric cancer patients. Cancer Med. 2017;6(6):1154‐1164. [DOI] [PMC free article] [PubMed] [Google Scholar]
- 37. Fan ZY, Liu W, Yan C, et al. Identification of a five‐lncRNA signature for the diagnosis and prognosis of gastric cancer. Tumour Biol. 2016;37(10):13265‐13277. [DOI] [PubMed] [Google Scholar]
- 38. Tian X, Zhu X, Yan T, et al. Differentially expressed lncRNAs in gastric cancer patients: a potential biomarker for gastric cancer prognosis. J Cancer. 2017;8(13):2575‐2586. [DOI] [PMC free article] [PubMed] [Google Scholar]
- 39. He Y, Li X, Meng Y, et al. A prognostic 11 long noncoding RNA expression signature for breast invasive carcinoma. J Cell Biochem. 2019;120(10):16692‐16702. [DOI] [PubMed] [Google Scholar]
- 40. Luo D, Deng B, Weng M, Luo Z, Nie X. A prognostic 4‐lncRNA expression signature for lung squamous cell carcinoma. Artif Cells Nanomed Biotechnol. 2018;46(6):1207‐1214. [DOI] [PubMed] [Google Scholar]
- 41. Diao P, Song Y, Ge H, et al. Identification of 4‐lncRNA prognostic signature in head and neck squamous cell carcinoma. J Cell Biochem. 2019;120(6):10010‐10020. [DOI] [PubMed] [Google Scholar]
- 42. Kanduri C. Long noncoding RNAs: lessons from genomic imprinting. Biochim Biophys Acta. 2016;1859(1):102‐111. [DOI] [PubMed] [Google Scholar]
- 43. Zhang S, Cao R, Li Q, Yao M, Chen Y, Zhou H. Comprehensive analysis of lncRNA‐associated competing endogenous RNA network in tongue squamous cell carcinoma. PeerJ. 2019;7:e6397. [DOI] [PMC free article] [PubMed] [Google Scholar]
- 44. Alayev A, Holz MK. mTOR signaling for biological control and cancer. J Cell Physiol. 2013;228(8):1658‐1664. [DOI] [PMC free article] [PubMed] [Google Scholar]
- 45. Xu K, Liu P, Wei W. mTOR signaling in tumorigenesis. Biochim Biophys Acta. 2014;1846(2):638‐654. [DOI] [PMC free article] [PubMed] [Google Scholar]
- 46. Kourtidis A, Lu R, Pence LJ, Anastasiadis PZ. A central role for cadherin signaling in cancer. Exp Cell Res. 2017;358(1):78‐85. [DOI] [PMC free article] [PubMed] [Google Scholar]
- 47. Dimitriou N, Arandjelovic O, Harrison DJ, Caie PD. A principled machine learning framework improves accuracy of stage II colorectal cancer prognosis. NPJ Digit Med. 2018;1:52. [DOI] [PMC free article] [PubMed] [Google Scholar]
Associated Data
This section collects any data citations, data availability statements, or supplementary materials included in this article.
Supplementary Materials
Data Availability Statement
The data used for supporting the results of the study are included within the article.


