


Abstract
Illumina sequencing has allowed for population-level surveys of transposable element (TE) polymorphism via split alignment approaches, which has provided important insight into the population dynamics of TEs. However, such approaches are not able to identify insertions of uncharacterized TEs, nor can they assemble the full sequence of inserted elements. Here, we use nanopore sequencing and Hi-C scaffolding to produce de novo genome assemblies for two wild strains of Drosophila melanogaster from the Drosophila Genetic Reference Panel (DGRP). Ovarian piRNA populations and Illumina split-read TE insertion profiles have been previously produced for both strains. We find that nanopore sequencing with Hi-C scaffolding produces highly contiguous, chromosome-length scaffolds, and we identify hundreds of TE insertions that were missed by Illumina-based methods, including a novel micropia-like element that has recently invaded the DGRP population. We also find hundreds of piRNA-producing loci that are specific to each strain. Some of these loci are created by strain-specific TE insertions, while others appear to be epigenetically controlled. Our results suggest that Illumina approaches reveal only a portion of the repetitive sequence landscape of eukaryotic genomes and that population-level resequencing using long reads is likely to provide novel insight into the evolutionary dynamics of repetitive elements.
INTRODUCTION
Transposable elements (TEs) are dynamic components of almost every eukaryotic genome: they serve as both a major source of deleterious mutations as well as an important source of genomic novelty and evolutionary innovation. The transposable elements of Drosophila melanogaster have been studied for decades and have led to important breakthroughs that have increased our understanding of the ability of TEs to invade new populations (1), the role of piRNAs in genome defense (2), and the population genetics of TE insertion frequencies (3).
Illumina sequencing has played an important role in advancing this field, not only by providing a means for the high-throughput sequencing of small RNAs, but also for characterizing variation in TE insertion frequencies within and between related species. However, there are significant limitations to using short-read technology to characterize TE insertions. For example, many TE insertions are completely missing from genome assemblies created from short reads, which has led to an alternative approach where Illumina population resequencing data (from pooled or separate individuals) is aligned to a high-quality reference genome assembly and polymorphic TE insertions are identified based on split-read alignments and/or paired-end information (4–10). Studies using these approaches for identifying polymorphic TEs in D. melanogaster populations have found that most polymorphic TE insertions are present at very low frequencies in the population, wild strains differ from each other by hundreds of unique TE insertions, lab strains have particularly distinct TE insertion landscapes, and new TE insertions tend to down-regulate the expression of nearby genes due to spreading of heterochromatin (7,11–14). However, these short-read approaches have their own limitations. They require a database of known TE sequences and are only able to identify TE insertions that are flanked by unique sequence. Furthermore, these methods are only able to obtain sequence from the 5′ and 3′ ends of each TE insertion and do not allow the assembly of the entire inserted sequence. The inability of these methods to fully characterize the TE landscape of a strain of interest has important implications for the analysis of small RNAs as well. Although a high-quality reference genome exists for the D. melanogaster iso-1 strain (15), small RNA sequencing experiments are frequently performed using a variety of D. melanogaster strains with different genetic backgrounds. Because these strains do not have their own high-quality assembly, the TE population giving rise to many of the sequenced small RNAs is not fully characterized. Previous work examining natural variation in piRNA production among wild strains of D. melanogaster found that there was very little variation in expression level among piRNA-producing loci across multiple strains from the Drosophila Genetic Reference Panel (DGRP) (16), although a subsequent study found a negative correlation between piRNA abundance per TE family and the copy number of that family, across the same DGRP strains (7). Another comparison between two different lab strains of D. melanogaster found that strain genotype was not associated with differences in piRNA abundance (17).
For studies of TE polymorphism, long-read sequencing (e.g. PacBio and Oxford Nanopore technologies) has the potential to overcome many of the limitations related to short-read methods. Long-reads can be used to identify novel TE insertions based on alignment to a reference genome assembly (25–28) or by comparing genome assemblies between strains and/or species (18). Recently, long-read sequencing using PacBio and Oxford Nanopore technology has been applied to various Drosophila species and shown to produce highly contiguous assemblies with a much more accurate representation of repetitive elements (19–24). These third-generation sequencing approaches have led to large improvements in the assembly of genomic contigs, while other recent techniques have improved the ability to link contigs into larger scaffolds. Notably, the Hi-C chromosome conformation capture approach has been shown to dramatically improve the scaffolding of genomic contigs (29). In this study, we have generated long-read genome assemblies and Hi-C data from two individuals from the Drosophila Genetic Reference Panel (DGRP), whose TE insertion profiles and ovarian piRNA populations were previously characterized using Illumina technology (16). Our goals for this study were several-fold: (i) compare the TE insertion profiles identified from de novo assembly of long-reads to those identified from short reads, for the same strains, (ii) determine the benefits of using Hi-C data to scaffold the genomic contigs and (iii) use the de novo assemblies and piRNA sequencing data to assess natural variation in TE content and piRNA abundance between these strains. We find that, while nanopore sequencing produced genome assemblies with higher contiguity than Illumina-based assemblies, the largest benefit in contiguity came from scaffolding with Hi-C data, which dramatically improved the scaffold N50, yielding scaffolds the length of chromosome arms, while correctly identifying and repairing contig assembly errors. Comparing these two strains, we find hundreds of strain-specific TE insertions that were not identified by the Illumina-based TIDAL method (7), including a novel micropia-like element that appears to have recently invaded the DGRP population. We also find hundreds of piRNA-producing loci that show strain-specific expression, suggesting that there is more inter-strain variation in piRNA abundance than previously reported.
MATERIALS AND METHODS
Nanopore sequencing
We extracted DNA from ∼30 females from each strain using the Qiagen DNeasy Blood & Tissue kit and used the Oxford Nanopore Technologies (ONT) SQK-LSK108 library preparation kit to construct PCR-free libraries according to the ONT 1D Genomic DNA by Ligation protocol. The DGRP379 library was sequenced on a single r9.4 flow cell. For DGRP732, two libraries were constructed and each was sequenced on a single r9.4 flow cell. The raw signal data were basecalled on a high-performance computing cluster using the ONT Albacore software package with default parameters (version 1.1.1).
Hi-C chromosome conformation capture
Strains were maintained in population cages on molasses agar with yeast paste and 8–16 h embryos were collected and dechorionated in 50% commercial bleach for 2.5 min. Nuclei were isolated from ∼200 mg of embryos and fixed in 1.8% formaldehyde for 15 minutes according to the protocol in (30). In situ Hi-C chromosome conformation capture was performed according to the previously published DNase-based protocol (31) and libraries were sequenced using 150 bp, paired-end mode on an Illumina NextSeq 500.
Genome assembly
Nanopore reads from each strain were assembled using Canu (32) (version 1.5) with an estimated genome size of 140 Mb and the extra parameters (recommended for nanopore data): overlapper = mhap utgReAlign = true. The Hi-C data were aligned to their genome of origin using the Juicer pipeline (33) (version 1.5) with option -s none for DNase Hi-C data. The genomic contigs were scaffolded by using the Juicer output along with the 3d-dna pipeline (29) (version 170123, options: -m diploid -t 5000 -s 10). The 3d-dna pipeline arranges contigs into a single ‘megascaffold’ which was manually divided into chromosome arms based on comparison to the D. melanogaster iso-1 genome assembly. Hi-C contact matrices were created using Hi-C Explorer (34) (version 1.4, options: –filterThreshold -4 5 –perchr). Comparisons to the iso-1 reference genome were made using the release 6 assembly (15), downloaded from FlyBase (35), and dotplots comparing the assemblies were made using mummerplot (36) (version 3.5).
Genomic scaffolds were polished using the raw nanopore reads with the Racon software package (37) (version 0.5.0, options: –sam -t 20 -b 50000). For Illumina polishing, uninformative Hi-C reads (i.e. those that did not include a ligation junction) were used as single-end reads with the Pilon software package (38) (version 1.23, options: –fix snps,indels –minmq 15) to identify and correct sequence errors in the assembly. Pilon was run for a total of 10 iterations for each assembly.
To assess the base quality of the polished nanopore assemblies, we assembled the uninformative Hi-C Illumina reads from each strain using IDBA (39) (version 1.1.3, default options) and aligned the IDBA contigs to the nanopore assemblies using the dnadiff utility from MUMmer (36) (version 3.5, default options), which reports single nucleotide variants and indels between assemblies. We excluded putatively heterozygous positions from our basecall accuracy calculation by calling SNPs from the Illumina data. We first used bowtie2 (40) (version 2.2.9, options: –rg-id STRAIN_ID –rg SM:STRAIN_ID) to align the Illumina reads to the nanopore assembly and then used FreeBayes (version 1.2.0, options: -0 –use-reference-allele –use-best-n-alleles 4) to identify nucleotide variants and indels. We then excluded positions identified by dnadiff as differing between the Illumina and nanopore assemblies if they overlapped a FreeBayes heterozygous variant.
Transposable element annotation
Repeatmasker (www.repeatmasker.org, version 4.0.7, default options plus -e ncbi) was used with D. melanogaster RepBase consensus sequences (41) to identify transposable elements in each assembly. An estimated copy number for each TE was calculated by taking the sum of all genomic sequence annotated as that TE and dividing by the length of the RepBase consensus sequence. To search for novel elements, RepeatModeler (www.repeatmasker.org/RepeatModeler, version 1.0.11, default options) was used to identify all repetitive sequences in the assemblies. The consensus of each of these de novo repeats was then searched, using BLASTN (42) (version 2.6.0+, default options), against the D. melanogaster RepBase sequences to determine if it matched a known D. melanogaster TE with ≥90% identity. To find polymorphic TEs, the two genome assemblies were aligned using nucmer (version 3.5, options: –mum -c 250) and strain-specific TE insertions were identified by searching for breaks in the one-to-one nucmer alignments. Nucmer finds maximal exact matches between scaffolds, clusters them into consistently ordered groups and then attempts to extend the alignments from each group (200 bp by default). Any sequence > 200 bp that is present in one strain but missing from the other will create a break in the alignment. We identified all insertion mutations >200 bp in each strain by using the nucmer output to identify the coordinates of the breaks between alignments. From the set of all insertions, we identified TE insertions as those where the entire length of the TE was contained within the insertion and the entire insertion was composed of TE sequence. Comparisons to TIDAL-fly TE predictions (7) were made using bedtools intersect (43) (version 2.25.0, default options) after transferring the DGRP assembly coordinates to the iso-1 coordinate space using a whole-genome alignment created by Mercator (version 0.4) according to the protocol in (44).
Comparison to TIDAL-fly
When comparing our insertions to those identified by TIDAL-fly, we only considered those that are absent from the iso1 reference strain and polymorphic between DGRP379 and DGRP732. We did this in order to make a fair comparison to TIDAL, which only identifies non-reference insertions and focuses on polymorphic elements. To identify TE insertions that are present in both our data and in the TIDAL callset, we first transferred the coordinates of the DGRP379 and DGRP732 TIDAL insertions to their respective assemblies using the Mercator sliceAlignment utility (44). We then used bedtools to intersect the two insertion sets. Because the TIDAL approach may not precisely identify the TE insertion location, we initially counted insertions as overlapping if the TE sequence present in our assembly was within 100 bp of a TIDAL insertion, but we later expanded this to 500 bp, as described in the Results section. We used bedtools closest with the -d option to obtain these distances. We used paired-end Illumina sequences to validate potential false-negative TE insertions that were missed by TIDAL as well as false-positive insertions that were called by TIDAL but missing from our assembly. For DGRP732, we used the same paired-end Illumina data used by TIDAL. The published data for DGRP379 is only single-end, so we used paired-end data that we generated ourselves. We used bowtie2 (40) (version 2.2.9, options: –very-sensitive –no-mixed –no-discordant -X 1000) to align the paired-end sequences, requiring mates to align concordantly and excluding discordant alignments. We required at least one read from each pair to have mapping quality ≥20 and visualized read alignments using the R package ggplot (45). To identify orphaned mates, we realigned the Illumina data using bowtie2 without the –no-mixed and –no-discordant options and used bedtools to identify orphan mates that flanked the TIDAL predictions that were missing from our assemblies. We extracted the sequence of the orphans from the BAM file, converted them to FASTA format, and used BLAST to search them against the RepBase TE consensus library. We required a putatively heterozygous insertion to have at least 4 orphaned mates that matched the same TE sequence.
Identification of piRNA-producing loci
We used cutadapt (version 1.16, options: -a AGATCGGAAGAGCACACGTCTGAACTCCAGTCACTGACCAATCTCGTATG -m 16 -q 15) to trim adapter sequences from the piRNA reads and removed reads derived from rRNA and tRNA by aligning all reads to the annotated rDNA and tRNA sequences present in the D. melanogaster reference assembly and retaining those that did not align to either feature type. The piRNA data were aligned using bowtie (46) (version 1.0.0, options: -v 1 -a -m 50 –best –strata). PiRNA source loci were identified as previously described (47). Briefly, each assembly was divided into 1 kb bins and the number of uniquely-mapping piRNAs between 23 and 30 nt in size was counted for each bin and normalized by the total number of mapped reads. A cutoff of 1 read per million mapped was used for identification of piRNA-producing bins. We then followed the methods of Mohn et al. to merge bins into loci (47). We merged piRNA producing bins into a single locus if they were either adjacent to each other or separated only by bins containing <10% uniquely mappable sequence. For merged bins larger than 10 kb, we merged them into larger domains if they were within 5 kb of another large (≥10 kb) bin. Because of this merging step, rather than bins, we are identifying contiguous regions of the chromosome that produce piRNAs, hence we refer to these regions as ‘loci’, rather than bins. To determine the percentage of total piRNAs aligning to piRNA loci, we extracted the sequence of each locus and used bowtie (46) (version 1.0.0, options: -v 1 -a -m 50 –best –strata) to align the piRNA reads to the set of piRNA loci. We then compared the total number of unique + multi-mapping reads that aligned to the piRNA loci versus the complete genome.
To compare expression of piRNA loci between strains, the nucmer whole genome alignment was used to identify orthologous regions and piRNA expression was calculated from alignments generated using the unique-weighting mode in ShortStack (48) (version 3.8.5, options: –mmap u –nohp) which aligns multi-mapping reads probabilistically based on the number of nearby uniquely mapping reads. FPKM values for each piRNA locus were calculated by dividing the ShortStack counts by the size of the locus (in kilobases) and then by the total number of aligned reads (in millions). Inactive piRNA loci were defined as regions that were orthologous to a piRNA source locus in the other strain, but whose piRNA abundance in the strain-of-interest was <0.1 FPKM.
Identification of pericentromeric heterochromatin
We used a sliding window approach (100 Kb windows, step size of 5 kb), and calculated the percent of each window containing repetitive elements as identified by RepeatMasker (including TEs, simple repeats, satellites, and low complexity sequence). We merged overlapping windows where at least 50% of each window was composed of repetitive elements and retained the centromere-proximal merged windows, which amounted to ∼17 Mb of sequence in total. We assessed the chromatin state of the regions we defined as pericentromeric heterochromatin by comparing them to the chromatin states defined by Filion et al. (49). Our regions are highly enriched for the ‘Green’ chromatin state (75% of observed annotated sequence has state ‘Green’, versus 2.7% expected by chance), which is defined as ‘Classic (including pericentric) heterochromatin’.
RESULTS
Genome assembly
We chose two DGRP strains for which piRNA sequencing data is publicly available: DGRP379 and DGRP732. We generated >50-fold coverage of 1D nanopore sequencing data for each strain (DGRP379: 1 flow cell, 54× coverage; DGRP732: 2 flow cells, 71× coverage) (Supplementary Table S1, Figure S1). We basecalled the raw signal data using Albacore and assembled the basecalled data using Canu (32) to produce assemblies with contig N50 metrics of 6.6 Mb (DGRP379) and 5.4 Mb (DGRP732) (Table 1). We used an in situ DNase-based protocol (31) to generate Hi-C data from embryos for each strain. We then used the 3d-dna analysis pipeline (29) to scaffold the Canu contigs and identify and repair misassembled contigs.
Table 1.
Comparison of genome assemblies for DGRP379 and DGRP732 to the D. melanogaster reference genome (Iso-1). DGRP strain contigs were assembled from nanopore reads and scaffolded with Hi-C data
| DGRP-379 | DGRP-732 | Iso-1a | |||
|---|---|---|---|---|---|
| Contigs | Scaffolds | Contigs | Scaffolds | Scaffolds | |
| Size b | 134 693 935 | 133 660 114 | 139 557 193 | 141 550 979 | 139 819 141 |
| N50 | 6 596 424 | 24 495 473 | 5 444 332 | 25 701 336 | 25 287 040 |
| NG50 c | 3 858 703 | 24 035 717 | 3 214 717 | 25 701 336 | 23 542 372 |
| N | 113 | 100 | 179 | 250 | 1857 |
aRelease 6 with known Y-linked scaffolds removed.
bDifference in assembly size between contigs and scaffolds is due to insertion of gaps during scaffolding and insertion/deletion of sequence during polishing.
cTrue genome size of 175 Mb was used for all calculations.
We assessed the accuracy of the Canu assemblies by aligning them to the D. melanogaster reference sequence (Figure 1). DGRP379 contains the standard arrangement for all sixteen inversions that are known to be polymorphic in D. melanogaster (50), therefore its genomic scaffolds should be largely collinear with the iso-1 reference assembly. Instead, we found two obvious contig assembly errors in the DGRP379 assembly, however the Hi-C scaffolding process split the incorrectly joined contigs and reoriented them to their correct location (Figure 1). There were no obvious contig assembly errors for DGRP732 (Supplementary Figure S2). Scaffolding with Hi-C data also dramatically improved the contiguity of the assemblies with the scaffold N50 reaching ∼25 Mb, which is comparable to that of the D. melanogaster reference genome (Table 1).
Figure 1.

DGRP379 nanopore genome assembly before and after Hi-C scaffolding. The top half of the figure shows the Hi-C contact matrices before and after scaffolding. Lighter shades indicate more 3D interactions between genomic regions and darker shades indicate fewer interactions. The red boxes show the location of contigs/scaffolds and red arrows point to off-diagonal interactions that are due to assembly errors in the contigs. The bottom half of the figure shows dotplots representing the alignment of the assembly to the D. melanogaster iso-1 reference genome before and after scaffolding. The red arrows point to the contig assembly errors.
We polished the scaffolds with nanopore reads using Racon (37) and Illumina reads by running 10 iterations of Pilon (38), which corrected a total of 856 thousand (DGRP379) and 835 thousand (DGRP732) base errors (Supplementary Figure S3). We assessed the base quality of the polished assemblies by comparing them to Illumina assemblies from the same strains. We generated de novo Illumina assemblies using our uninformative Hi-C read pairs for both strains. We then used nucmer (36) to align the Illumina contigs to our nanopore assembly. 99.8% and 99.9% of bases in the DGRP379 and DGRP732 Illumina assemblies aligned to our nanopore assemblies. We used the dnadiff (36) tool to identify nucleotide variants and indels in these alignments, after excluding potentially heterozygous positions (see Methods). If we conservatively assume that all variants and indels are due to errors in the nanopore assembly rather than the Illumina assembly, we can estimate a lower bound on the basecall accuracy of the polished nanopore assemblies as 99.98% and 99.95%, for DGRP379 and DGRP732 respectively, which is equivalent to a Phred score of 38 and 33. We identified ∼20-fold more heterozygous positions in DGRP732 compared to DGRP379 (170,446 versus 8,628), the majority of which were concentrated on chromosome 3R. The lower base accuracy for DGRP732 may, at least in part, be due to conflicting basecalls resulting from additional heterozygous positions that we were unable to identify.
Transposable elements
We used RepeatMasker with the D. melanogaster RepBase TE consensus sequences (41) to annotate TEs in both DGRP assemblies. We identified 13.0% and 16.3% of the DGRP379 and DGRP732 assemblies as derived from TEs (versus 15.8% of the iso-1 reference assembly) (Figure 2A). Overall, copy number per TE family is highly correlated between strains (spearman's rho = 0.93; Figure 2B). Across all families, DGRP732, which has a larger assembly size (and a larger genome size according to flow cytometry (50)), has significantly more TE copies (paired Wilcoxon test P < 2.2e−16) (Figure 2A), in agreement with the TIDAL TE predictions (267 non-reference insertions for DGRP379 versus 483 for DGRP732).
Figure 2.

Comparative analysis of transposable element (TE) insertion profiles. Both TEs and strain-specific insertion mutations were annotated in each DGRP genome assembly. Panel A shows the percentage of each assembly annotated as TE sequence and the percentage of each assembly that is strain-specific. Most strain specific insertion sequences are derived from TEs and 14–20% of all TEs are strain-specific insertions. Panel B: TE copy number is strongly correlated between strains (Spearman's rho = 0.93). Each dot in the scatterplot represents a single TE family and is colored based on its classification. TEs showing a 2-fold or larger difference in copy number and/or TEs where at least 50% of insertions are strain-specific are labeled with their family name. Panel C shows all TE families where the majority (≥50%) of insertions in at least one of the two assemblies are strain-specific.
We identified strain-specific TE insertions by using nucmer (36) to align the two DGRP genome assemblies (see Methods). From this analysis, we identified 3.2% (DGRP379) and 4.5% (DGRP732) of the assemblies as representing strain-specific insertions. We then identified the subset of TE sequences whose entire length was contained within a strain-specific insertion. From this analysis we found that 57.0% (DGRP379) and 70.7% (DGRP732) of strain-specific insertions consist of TEs and these polymorphic TEs represent 13.9% (DGRP379) and 19.7% (DGRP372) of the total TE sequences in each assembly (Figure 2A). Comparing the locations of these sequences, we found that a larger proportion of euchromatic TE insertions are polymorphic, compared to those within the pericentric heterochromatin: At least 60% (DGRP379: 60%, DGRP732: 67%) of the total TE sequences within euchromatin are from polymorphic insertions, compared to 20–30% (DGRP379: 18%, DGRP732: 31%) of TE sequences within the pericentric heterochromatin. We identified 15 TE families where the majority of insertions were specific to one of the two strains (Figure 2C). These TEs tend to be young, active elements such as roo, blood and copia, and the copy number for these families showed a much lower correlation between strains (spearman rho = 0.26; Supplementary Figure S4).
Our estimate of the percentage of euchromatic insertions that are unique to each strain is conservative and likely a lower bound on the true percentage. For the percentages listed above, we included all Repbase TEs (as annotated by RepeatMasker) in our calculations including the abundant, but inactive, INE-1 element, whose insertions are mostly shared between strains (8). We also included a tandem array of TEs on chromosome 3R composed of ∼25 copies each of a copia2 and invader1 LTR (i.e. ∼50 copies in total) (51). 41 of these copies are shared between strains, which inflates the number of shared insertions. Excluding both INE-1 elements and this tandem array brings the percentage of strain-specific insertions to 80% and 83%, for DGRP379 and DGRP732, respectively. Furthermore, previous studies using PCR or Illumina paired-end approaches necessarily focus on TE insertions that are flanked by unique sequence. If we further constrain our analysis to TEs that are at least 10 kb away from another TE, the strain-specific insertions again increase to 88% and 87% respectively.
We also identified many large insertion/deletion mutations in the pericentric heterochromatin spanning multiple fragmented TE copies. For both strains, more than half of the pericentric insertion/deletion mutations contain sequences from multiple TE families, whereas the majority of euchromatic insertion/deletion mutations contain a single TE insertion (Figure 3). Single insertions that carry multiple fragments of TEs from different families are likely to be due to errors during the replication of the repeat-rich pericentric heterochromatin, rather than new TE insertions. Such mutations are abundant in these genomic regions, resulting in a striking amount of structural divergence compared to euchromatic regions (Figures 4 and 5, Supplementary Figure S5). To confirm that these were not assembly errors, we aligned the raw nanopore data back to the assemblies and searched for individual sequencing reads with alignments that covered the entire indel region. We found, in each assembly, ∼97% (DGRP379: 97.5%, DGRP732: 96.9%) of all large indel mutations were completely contained by multiple sequencing reads, suggesting that the structural variation in these pericentric regions does not result from assembly errors. We further assessed the accuracy of all identified insertions by aligning the nanopore sequences from DGRP379 to the DGRP732 assembly and vice versa. We used the error-corrected nanopore sequences produced by Canu, which have an average coverage of ∼33× for both strains. If the insertions are actually misassembled regions, they should show reduced or missing read coverage for both strains when we align our sequencing data back to the assemblies. On the other hand, if the insertions are correctly assembled, we expect ∼33× coverage for the sequencing data from the strain that carries the insertion, and zero coverage at these regions for the strain that lacks the insertion. From the nanopore sequence alignments, we calculated the median coverage for each strain, for each insertion. Across all insertions, the median coverage for the strain with the insertion is ∼33x whereas the median coverage is zero for the strain without the insertion (Figure 6). We see a similar pattern when considering euchromatic and heterochromatic insertions separately, although the median coverage for strains without the insertion in the pericentric heterochromatin is 1 rather than zero, which is likely due to mismapping of a relatively small number of sequences to these repetitive regions (Supplementary Figure S6). That said, repeat-rich sequences like those found in the pericentric heterochromatin are very difficult to assemble and there are likely a relatively small number of regions in our assembly that are not assembled correctly, given that some insertions do show relatively high coverage in the strain where the insertion should be missing if our assemblies are correct (Supplementary Figure S6).
Figure 3.
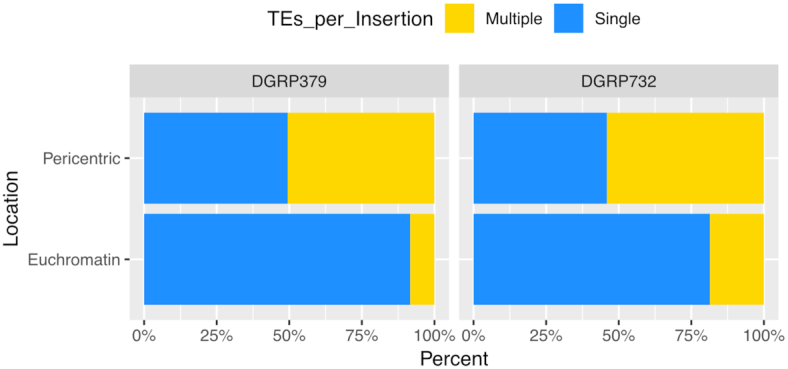
Most euchromatic insertion mutations contain a single transposable element. We classified all insertion mutations that contained transposable element sequences in both the euchromatin and pericentromeric heterochromatin based on whether they contained a single TE insertion or insertions from multiple TE families. Euchromatic insertions are much more likely to correspond to a single TE insertion event whereas many insertion mutations in the pericentromeric heterochromatin are likely due to errors in replication rather than new TE insertions.
Figure 4.

Transposable elements, large insertions, and piRNA source loci are all enriched in the pericentric heterochromatin. The three large chromosomes of D. melanogaster are shown with their missing centromeric sequence represented by gray boxes. The chromosome arms were divided into 100 kb windows and the number of features per window is shown for TEs, other large insertion/deletion mutations, and piRNA source loci. The feature densities shown here are from the DGRP379 assembly. The densities for DGRP732 are shown in Supplementary Figure S5.
Figure 5.

Pericentric heterochromatin contains abundant structural variation. The two panels show the location of nucmer alignments (grey polygons) between the two DGRP strain genome assemblies for a 1 Mb region from chromosome 2R pericentric heterochromatin (Panel A) and a 1 Mb region from chromosome 2R euchromatin (Panel B). The location of TE insertions is represented by colored lines (see legends on right side of panel) and piRNA expression for 1 kb bins is shown above and below the chromosome boxes (dark red: high expression, pale yellow: low expression, white: no expression).
Figure 6.
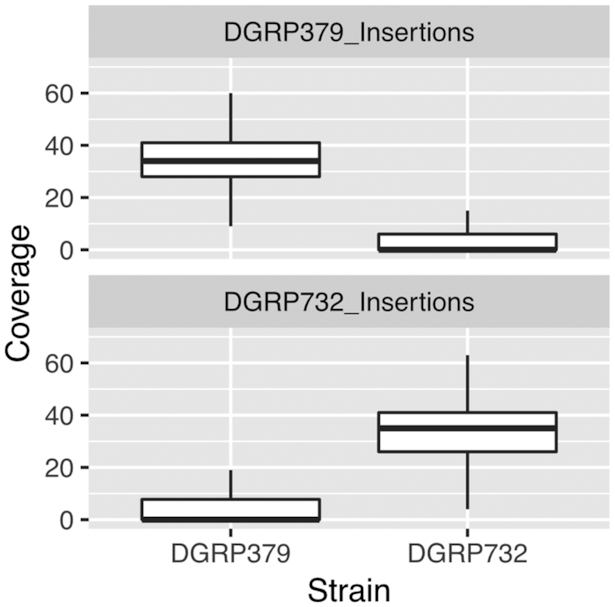
Sequencing coverage of insertion mutations. We verified that the majority of insertion mutations that we identify are true mutations rather than assembly errors by aligning the nanopore reads from each strain to each assembly. We used the error-corrected nanopore sequences produced by Canu, which have an average coverage of ∼33× for both strains. Insertions that result from assembly errors should have low coverage in both strains, whereas true insertions should have typical coverage for the strain that carries the insertion and coverage of zero for the strain that is missing the insertion. Across all insertions that we identify, we find that the median coverage is ∼33× for the strain with the insertion and zero for the strain that lacks the insertion. We find a similar pattern when considering euchromatic insertions separately from pericentromeric insertions (see Supplementary Figure S6).
To compare the number and location of the polymorphic TEs that we identified to those predicted by TIDAL-fly using an Illumina approach (7), we first transferred the coordinates of the TIDAL predictions from the iso1 reference assembly to our de novo assemblies. We were able to transfer a total of 721 predictions (96%) to our assemblies: 258 for DGRP379 and 463 for DGRP732. The vast majority of TIDAL-fly predicted insertions were present in our assemblies (98% [DGRP379] and 89% [DGRP732]), however we were able to identify several hundred strain-specific insertions that were missed by TIDAL-fly: 407 and 489 additional insertions in DGRP379 and DGRP732, respectively. For DGRP379, there are five TE insertions predicted by TIDAL that are not present in our assembly, and for DGRP732, there are 54 TE insertions that are not present in our assembly. We required the TIDAL prediction to be within 100 bp of the TE location. If we extend this to 500 bp, we find an additional four DGRP732 TIDAL predictions that agree with our assembly. To test the remaining TIDAL predictions, we mapped DGRP379/732 paired-end Illumina reads to the corresponding nanopore genome assembly. If the Illumina data supports a TE insertion that is missing from our assembly, there should be at least one location near the predicted TIDAL insertion that is not spanned by Illumina paired-end alignments. Instead, the alignments are tiled across our assembly at all five of the predicted TIDAL insertions for DGRP379, suggesting those predictions are not supported by Illumina alignments and are therefore likely to be false positives (Supplementary Figure S7). For 46 of the 50 remaining DGRP732 regions, the paired-end read alignments are concordantly tiled across the region of our assembly that is predicted by TIDAL to contain a TE insertion (Supplementary Figure S8). There are however, four regions where the paired-end alignments do not tile across the region, raising the possibility that the TIDAL prediction is correct (Supplementary Figure S8).
Another possibility that would explain the discrepancies between TIDAL and our assemblies is the presence of within-strain TE polymorphisms. Our nanopore and Illumina genomic sequencing data is derived from pooled flies, as is the original DGRP sequencing data. Our assembly could reflect the allele lacking the insertion, whereas the TIDAL prediction could be derived from the other allele. In these cases, we would expect a subset of the paired-end alignments at the insertion boundary to have orphan mates where one mate aligns to the flanking sequence and the other aligns to the TE insertion (which is missing from our assembly), while the remaining paired-end sequences align concordantly with our assembly. For each of the TIDAL predictions that were missing from our assembly, we determined whether the flanking regions had orphaned paired-end alignments. If so, we extracted the sequence of the orphan and used BLAST to determine whether it shares homology with a transposable element. Using this approach, we identified five loci (out of the 50 DGRP732 TIDAL insertions that were missing from our assembly) that are consistent with a within-strain polymorphic insertion. None of the DGRP379 predictions were consistent with such an insertion.
Overall, of the 55 TIDAL predictions (5 from DGRP379 and 50 from DGRP732) that are missing from our assembly, 46 (84%) appear to be false positive predictions by TIDAL. Out of the full set of 721 TIDAL predictions, this is equivalent to a false positive rate of 6.4%.
We also investigated the TE insertions present in our assemblies that were missed by TIDAL. For each strain, roughly half of the TE insertions missed by TIDAL correspond to full or nearly full-length TEs or solo LTRs (207/407 [DGRP379], 249/489 [DGRP732]). Of the full-length elements, 27% (DGRP379) and 49% (DGRP732) were <250 bp away from another TE insertion. The presence of repetitive sequence in the region flanking the TE of interest would make it difficult to obtain accurate split-read alignments, which are needed by TIDAL to identify TE insertions. For the remaining full-length insertions located at least 250 bp away from another TE, we aligned paired-end Illumina data to these locations and retained PE alignments where at least one of the mates had mapping quality > = 20. We considered the presence of multiple PE alignments, where one mate maps to the flanking sequence and the other maps to the TE, as positive confirmation of the insertion. Using this criterion, we confirmed 149/151 DGRP379 insertions and 122/128 DGRP732 insertions that were missed by TIDAL (Supplementary Figures S9 and S10). Of the 721 TIDAL insertions we were able to assess, our approach identifies the same insertion in 93% of cases whereas our predictions have a false negative rate of 0.6%.
Unlike short-read approaches, whole-genome assembly also allows for distinguishing between full-length versus partial TE insertions. For example, we found that, while both strains have a similar number of full-length insertions of the burdock retrotransposon, DGRP379 has ∼10-fold more insertions of the burdock long terminal repeat (LTR) alone (see Figure 2B, C for burdock LTR copy number differences). These so-called solo-LTRs are formed from full-length insertions due to unequal homologous recombination.
We searched for novel TEs in the DGRP assemblies by running RepeatModeler (http://www.repeatmasker.org/RepeatModeler). We filtered the RepeatModeler output to exclude multicopy genes (such as histones) and simple repeat/low complexity sequence. All of the remaining de novo RepeatModeler consensus sequences matched a D. melanogaster RepBase element with ≥90% identify except for a single sequence. This sequence is a novel micropia-like TE and it is present in both DGRP assemblies. The micropia-like consensus sequence is only ∼70% identical to the micropia element that is present in the iso-1 reference genome and in RepBase (Supplementary Figure S11). This novel element is present in 13 and 17 full-length copies (plus an additional 37 and 27 fragmented copies) in the DGRP379 and DGRP732 assemblies and the full-length copies are >99% identical to the consensus sequence, suggesting the element has recently invaded the DGRP population.
piRNA source loci
We used previously published piRNA sequencing data which were generated from ovaries using the periodate oxidation and β-elimination approach (16). We trimmed adaptor sequences and aligned these datasets to their genome of origin, retaining only unique alignments of sequences between 23 and 30 bp in length. We identified piRNA source loci from these alignments as has been done previously (47) (see Materials and Methods), which resulted in 5101 and 4884 loci from DGRP379 and DGRP732, respectively. We found that these loci cluster within the pericentric heterochromatin (Figure 4) and, although only ∼12% of the genome assembly of each strain is annotated as a piRNA locus, ∼92% of all piRNAs align to these regions.
We also compared our piRNA source loci to those previously identified by Mohn et al. (47). The total number of basepairs contained in our loci is ∼16% (DGRP379) and ∼21% (DGRP732) larger than the set reported by Mohn et al. and our loci include a larger percentage of the total TE sequences present in the genome (58% [DGRP379] and 49% [DGRP732] versus 40% in the Mohn et al. study). Although a larger percentage of the Mohn et al. loci overlap TEs (74%) compared to our loci, this is largely due to the fact that their set is smaller than ours and we identify more loci arising from genes. Many genes have been shown to produce piRNAs, especially in their 3′ UTRs. One well-studied example is the 3′ UTR of traffic jam (52). In a separate study, Robine et al. identified a total of 2,356 genes in Drosophila OSS cells whose transcripts produce piRNAs (53). We annotate ∼70% of these genes as piRNA loci in both DGRP379 and DGRP732. Across both strains, at least 90% of our piRNA-producing loci overlap either a TE or a gene.
For each piRNA-producing locus in DGRP379, we used our whole-genome alignment to identify the orthologous coordinates in DGRP732, which allowed us to compare piRNA expression levels between the two strains. We were able to identify orthologous loci for most coordinates: 4584 out of 5101 loci for DGRP379 and 4255 out of 4884 loci for DGRP732. To quantify expression from these loci, we realigned the piRNA data, identifying all possible alignments for each read. We then used the unique-weighting mode in ShortStack (48,54) to probabilistically assign alignments of multi-mapping reads based on the number of nearby uniquely mapping reads. Although almost half of DGRP379 piRNA loci (∼45%) showed similar expression levels in DGRP732 (less than 2-fold difference between strains), we identified 2517 loci with more than 2-fold difference in piRNA expression, most of which showed piRNA expression levels that were reduced or inactive (i.e. below the identification threshold, see Methods) in DGRP732 (1809 and 466 loci, respectively) (Figure 7A). We obtained similar results when performing the analysis in the opposite direction (i.e. starting with piRNA loci in DGRP732 and comparing their expression to DGRP379), with most of the differentially-expressed DGRP732 piRNA loci showing reduced or inactive expression in DGRP379 (Supplementary Figure S12).
Figure 7.

Variation in expression of piRNA source loci. Panel A: Normalized expression values from piRNA producing loci (also known as piRNA source loci) were calculated for each strain. The piRNA loci from DGRP379 were classified based on the expression of the orthologous locus in DGRP732: Up-regulated (UPREG) loci show two-fold or greater expression in DGRP379 (versus DGRP732), SIMILAR loci show less than a 2-fold difference in expression, downregulated loci (DOWNR) show two-fold or greater down-regulation in DGRP379 (versus DGRP732), and INACTIVE loci were not identified as piRNA source loci in DGRP732. See Supplementary Figure S5 for the analogous scatterplot from the perspective of DGRP732. Panel B: Comparison of piRNA expression categories using FPKM ≥1 versus FPKM ≥10 to define piRNA source loci. Colors represent the same categories as in Panel A.
It is possible that most of the variation in piRNA expression between strains is due to our relatively lenient threshold for defining a piRNA-producing locus (≥1 FPKM). To determine whether the proportion of piRNA loci falling into the differential versus similar expression categories would change with a more stringent threshold, we repeated our analysis using FPKM ≥10 (Supplementary Figure S13). Although we only identify ∼26% of the original loci with this cutoff, the proportion of loci in each category is very similar (Figure 7B), suggesting that our ≥1 FPKM threshold is not biasing our results. Based on these results, we continued using the ≥1 FPKM threshold for the analyses described below.
Overall, ∼48% of the piRNA producing loci from DGRP379 and DGRP732 overlap transposable elements. For both strains, we found that ∼25% of strain-specific piRNA producing loci overlap strain-specific transposable elements, which is significantly more than expected by chance (hypergeometric test P = 2.6e−24 [DGRP379] and P = 9.5e−23 [DGRP732]), in agreement with previous work suggesting that TE insertions can create de novo piRNA producing loci (55). Interestingly, the DGRP379-specific insertions of the burdock solo LTR consistently produced de novo piRNAs, as inferred from the ShortStack alignments (Figure 8A). In fact, after correcting for their difference in length, the solo LTR produces ∼2.6× more piRNAs than the polymorphic insertions of the full-length burdock elements. Overall however, the majority of strain-specific piRNA loci either do not overlap TEs at all (∼57%; Figure 8B and Supplementary Figure S14) or overlap the same TE in both strains (∼17%). We further investigated the subset of strain-specific loci that lack TEs and found that the majority (∼94% [DGRP379] and 76% [DGRP732]) overlap genes. We also confirmed that they are not adjacent to TEs: the average distance to the nearest TE for these loci is ∼22 kb. To determine if the strain-specific piRNA production at these loci is associated with the expression level of the genes they overlap, we used previously published microarray data from whole adult females (56) to compare expression of these genes between the DGRP379 and DGRP732 strains. Surprisingly, we found these genes to be expressed similarly in both strains (Supplementary Figure S15), suggesting that the between-strain differences in piRNA production in these cases may be epigenetically controlled, as has been described in Drosophila virilis (57,58).
Figure 8.
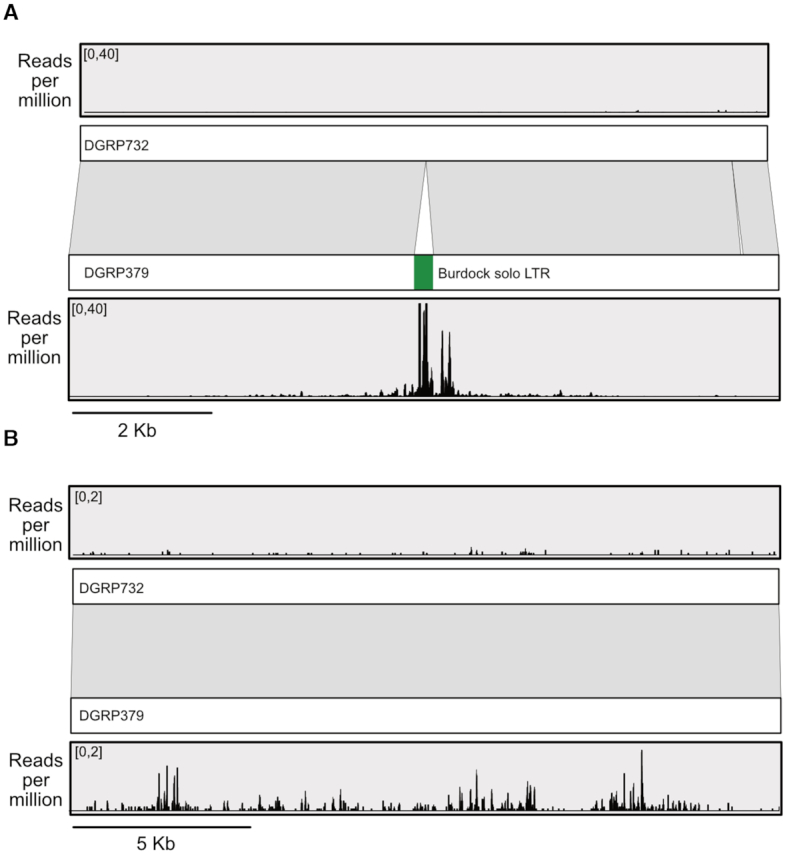
De novo and epigenetically controlled piRNA production. Panel A shows a 10.3 kb region that contains a solo-LTR from the burdock retrotransposon that is present only in DGRP379. Abundant piRNAs are being produced from the LTR itself as well as several kilobases of the region flanking the LTR insertion, whereas very few piRNAs align to this region in the DGRP732 genome. Panel B shows a 20 kb region within the intron of the transcriptional corepressor gene known as Smr. The two DGRP strains are 98% identical across this region and there are no TE insertions present in either strain, but DGRP379 piRNAs are much more abundant compared to those from DGRP732. See Supplementary Figure S13 for an expanded view which includes the Smr gene model. piRNA coverage values for both panels were obtained from alignments based on the unique-weighting mode in ShortStack to probabilistically assign alignments of multi-mapping reads based on the number of nearby uniquely mapping reads.
DISCUSSION
Our results show that nanopore sequencing can produce genome assemblies with much higher contiguity than Illumina-based assemblies, consistent with previous work in D. melanogaster (19,20). In contrast to these previous studies, however, we also used Hi-C data to scaffold the nanopore contigs. Scaffolding with Hi-C data substantially improved our genome assemblies by correcting assembly errors and allowing the accurate placement of even the small, repeat-rich, pericentromeric contigs into the final chromosome-length scaffolds, which is crucial for the study of piRNA-producing loci as the vast majority of piRNAs come from these regions.
By aligning these assemblies, we were able to identify a large set of insertion/deletion mutations containing sequences that are unique to one of the two strains, many of which are due to transposable element insertions. We used multiple approaches to verify that these are true insertion/deletion mutations, rather than assembly errors. The majority of insertions show the expected level of sequencing coverage in the strain with the insertion and close to zero coverage in the strain lacking the insertion. We also compared the TE insertions we identified to the TE insertions predicted by TIDAL-fly for these same strains. 93% of the TIDAL predicted insertions are present in our assembly and the majority of those that are missing appear to be incorrect calls by TIDAL. We also found hundreds of TE insertions that were missed by TIDAL. In order to control false positives, TIDAL set stringent requirements for coverage of split read alignments. Alignment of Illumina reads by TIDAL could be negatively impacted by sequence divergence between the DGRP strains and the reference genome, or between the TE and its consensus sequence, as well as by the presence of repetitive sequence flanking the insertion itself. Furthermore, differences in Illumina sequencing coverage between DGRP strains means that there will be more TIDAL false negatives in low coverage strains compared to high-coverage strains. All of these factors likely contributed to the missed insertions.
On the other hand, our results suggest that TIDAL is more sensitive in detecting within-strain TE polymorphisms. 10% of the TIDAL insertions that were missing from our assembly appear to be correct calls that are polymorphic in the DGRP732 strain. Long read mapping-based approaches for detection of TE polymorphisms or algorithms designed to produce diploid assemblies from long reads (25–28, 59) could potentially be more sensitive at identifying within-strain polymorphic TEs, compared to the approach used here.
Another caveat with respect to our comparison with TIDAL is that the DGRP strains have been in culture for at least ∼200 generations between when the Illumina data used by TIDAL was generated and when we performed the nanopore sequencing. Based on the TE insertion and excision rates from (60), there could be as many as 50 new TE insertions and 3 TE deletions that have occurred in each strain over this time period. However, these new insertions would only explain ∼12.5% of the of the >400 TE insertions in each strain that were missed by TIDAL, but present in our assemblies.
By analyzing these assemblies, we also gained information about specific TE insertions that would not have been possible with Illumina-based methods. For example, our discovery of the novel micropia-like TE that has invaded the DGRP population raises the possibility that there are other novel TEs in various D. melanogaster populations that have not yet been described. Such TEs would provide additional opportunities for studying the early stages of TE invasion and suppression by the host genome, similar to work on the P-element (61–63). Additionally, our observation of large discrepancies in Burdock solo-LTR numbers across strains challenges the notion that solo-LTRs are rare in the D. melanogaster genome (64). This observation would not be possible with Illumina methods because it is very difficult to differentiate insertions of full-length elements from solo-LTRs or internally truncated elements with short reads. Previous work has found that different insertions of what was assumed to be the same TE based on Illumina inference, show large differences in their ability to spread heterochromatin into adjacent genomic regions (14). Our study raises the possibility that different structural variants of the same TE could explain those results. For example, the burdock solo-LTRs in DGRP379 tend to produce abundant piRNAs that spread into the flanking genomic regions, in much greater amounts than their full-length counterparts.
Using these assemblies to characterize TE content and piRNA expression at the whole-genome level, we found that TE content and piRNA abundance per TE family were both fairly highly conserved between these two strains, which is consistent with previous findings (16,17). However, these assemblies also reveal a level of dynamism in their repeat content that has previously been underappreciated. For example, although the overall TE content is conserved between these two strains, there is a subset of young, active, TEs that show insertion profiles that are highly variable and which frequently act as de novo piRNA-producing loci. On the other hand, the pericentromeric heterochromatin, which is mostly composed of inactive, fragmented TEs, is enriched for both TE sequences and large insertion/deletion mutations in general (Figure 4). The enrichment of high-frequency and/or fixed TE insertions in the pericentric heterochromatin is generally believed to be the result of a reduction in recombination, which also reduces the efficiency by which purifying selection can remove these insertions from the population (3,65,66). Relatedly, the euchromatic chromosome arms experience higher levels of recombination and deleterious TE insertions are more efficiently purged from the population. We also observed more complex structural variation in the pericentromeric regions that is likely due to errors in replication rather than TE insertions. An elevated mutation rate in pericentric heterochromatin may seem counterintuitive given that one of the purposes of this chromatin state is to protect these repeat-rich regions from aberrant double-strand break repair via homologous recombination (67), however work in cancer cells has shown that H3K9me3-enriched regions show elevated rates of both point mutations and structural variation (68–72). The mechanism behind the elevated mutation rate is unclear, but may be due to increased replication stress or decreased repair efficiency in repetitive DNA (69).
In summary, our work suggests that there are significant features of the repetitive portion of the genome that can only be observed from long-read sequencing and that in the future, population resequencing with long-read approaches will shed new light on the evolutionary dynamics of repetitive elements.
Supplementary Material
ACKNOWLEDGEMENTS
Sequencing data are deposited in the NCBI Short Read Archive (SRA) and Whole Genome Shotgun (WGS) databases. Nanopore accessions: SRR8643355, SRR8627922, and SRR8627923. Hi-C accessions: SRR8627924 and SRR8627920. Illumina accession: SRR10066285. Genome assemblies: SIXD01000000 and SISJ02000000. The micropia-like transposon consensus sequence is deposited in GenBank under accession MN418888. The authors acknowledge the Office of Advanced Research Computing (OARC) at Rutgers, The State University of New Jersey for providing access to the Amarel cluster and associated research computing resources that have contributed to the results reported here.
SUPPLEMENTARY DATA
Supplementary Data are available at NAR Online.
FUNDING
National Institutes of Health [R01GM130698 to C.E.E.]. Funding for open access charge: National Institutes of Health [R01GM130698 to C.E.E.].
Conflict of interest statement. None declared.
REFERENCES
- 1. Anxolabehere D., Kidwell M.G., Periquet G.. Molecular characteristics of diverse populations are consistent with the hypothesis of a recent invasion of Drosophila melanogaster by mobile P elements. Mol. Biol. Evol. 1988; 5:252–269. [DOI] [PubMed] [Google Scholar]
- 2. Brennecke J., Aravin A.A., Stark A., Dus M., Kellis M., Sachidanandam R., Hannon G.J.. Discrete small RNA-generating loci as master regulators of transposon activity in Drosophila. Cell. 2007; 128:1089–1103. [DOI] [PubMed] [Google Scholar]
- 3. Charlesworth B., Langley C.H.. The population genetics of Drosophila transposable elements. Annu. Rev. Genet. 1989; 23:251–287. [DOI] [PubMed] [Google Scholar]
- 4. Cridland J.M., Macdonald S.J., Long A.D., Thornton K.R.. Abundance and distribution of transposable elements in two Drosophila QTL mapping resources. Mol. Biol. Evol. 2013; 30:2311–2327. [DOI] [PMC free article] [PubMed] [Google Scholar]
- 5. Fiston-Lavier A.S., Barron M.G., Petrov D.A., Gonzalez J.. T-lex2: genotyping, frequency estimation and re-annotation of transposable elements using single or pooled next-generation sequencing data. Nucleic Acids Res. 2015; 43:e22. [DOI] [PMC free article] [PubMed] [Google Scholar]
- 6. Kofler R., Betancourt A.J., Schlotterer C.. Sequencing of pooled DNA samples (Pool-Seq) uncovers complex dynamics of transposable element insertions in Drosophila melanogaster. PLos Genet. 2012; 8:e1002487. [DOI] [PMC free article] [PubMed] [Google Scholar]
- 7. Rahman R., Chirn G.W., Kanodia A., Sytnikova Y.A., Brembs B., Bergman C.M., Lau N.C.. Unique transposon landscapes are pervasive across Drosophila melanogaster genomes. Nucleic Acids Res. 2015; 43:10655–10672. [DOI] [PMC free article] [PubMed] [Google Scholar]
- 8. Sackton T.B., Kulathinal R.J., Bergman C.M., Quinlan A.R., Dopman E.B., Carneiro M., Marth G.T., Hartl D.L., Clark A.G.. Population genomic inferences from sparse high-throughput sequencing of two populations of Drosophila melanogaster. Genome Biol. Evol. 2009; 1:449–465. [DOI] [PMC free article] [PubMed] [Google Scholar]
- 9. Zhuang J., Wang J., Theurkauf W., Weng Z.. TEMP: a computational method for analyzing transposable element polymorphism in populations. Nucleic Acids Res. 2014; 42:6826–6838. [DOI] [PMC free article] [PubMed] [Google Scholar]
- 10. Linheiro R.S., Bergman C.M.. Whole genome resequencing reveals natural target site preferences of transposable elements in Drosophila melanogaster. PLoS One. 2012; 7:e30008. [DOI] [PMC free article] [PubMed] [Google Scholar]
- 11. Cridland J.M., Thornton K.R., Long A.D.. Gene expression variation in Drosophila melanogaster due to rare transposable element insertion alleles of large effect. Genetics. 2015; 199:85–93. [DOI] [PMC free article] [PubMed] [Google Scholar]
- 12. Kofler R., Nolte V., Schlotterer C.. Tempo and mode of transposable element activity in Drosophila. PLos Genet. 2015; 11:e1005406. [DOI] [PMC free article] [PubMed] [Google Scholar]
- 13. Lee Y.C. The role of piRNA-mediated epigenetic silencing in the population dynamics of transposable elements in Drosophila melanogaster. PLos Genet. 2015; 11:e1005269. [DOI] [PMC free article] [PubMed] [Google Scholar]
- 14. Lee Y.C.G., Karpen G.H.. Pervasive epigenetic effects of Drosophila euchromatic transposable elements impact their evolution. Elife. 2017; 6:e25762. [DOI] [PMC free article] [PubMed] [Google Scholar]
- 15. Hoskins R.A., Carlson J.W., Wan K.H., Park S., Mendez I., Galle S.E., Booth B.W., Pfeiffer B.D., George R.A., Svirskas R. et al.. The Release 6 reference sequence of the Drosophila melanogaster genome. Genome Res. 2015; 25:445–458. [DOI] [PMC free article] [PubMed] [Google Scholar]
- 16. Song J., Liu J., Schnakenberg S.L., Ha H., Xing J., Chen K.C.. Variation in piRNA and transposable element content in strains of Drosophila melanogaster. Genome Biol. Evol. 2014; 6:2786–2798. [DOI] [PMC free article] [PubMed] [Google Scholar]
- 17. Kelleher E.S., Barbash D.A.. Analysis of piRNA-mediated silencing of active TEs in Drosophila melanogaster suggests limits on the evolution of host genome defense. Mol. Biol. Evol. 2013; 30:1816–1829. [DOI] [PMC free article] [PubMed] [Google Scholar]
- 18. Caspi A., Pachter L.. Identification of transposable elements using multiple alignments of related genomes. Genome Res. 2006; 16:260–270. [DOI] [PMC free article] [PubMed] [Google Scholar]
- 19. Miller D.E., Staber C., Zeitlinger J., Hawley R.S.. Highly contiguous genome assemblies of 15 Drosophila species generated using nanopore sequencing. G3 (Bethesda). 2018; 8:3131–3141. [DOI] [PMC free article] [PubMed] [Google Scholar]
- 20. Solares E.A., Chakraborty M., Miller D.E., Kalsow S., Hall K., Perera A.G., Emerson J.J., Hawley R.S.. Rapid low-cost assembly of the Drosophila melanogaster reference genome using low-coverage, long-read sequencing. G3 (Bethesda). 2018; 8:3143–3154. [DOI] [PMC free article] [PubMed] [Google Scholar]
- 21. Khost D.E., Eickbush D.G., Larracuente A.M.. Single-molecule sequencing resolves the detailed structure of complex satellite DNA loci in Drosophila melanogaster. Genome Res. 2017; 27:709–721. [DOI] [PMC free article] [PubMed] [Google Scholar]
- 22. Chakraborty M., VanKuren N.W., Zhao R., Zhang X., Kalsow S., Emerson J.J.. Hidden genetic variation shapes the structure of functional elements in Drosophila. Nat. Genet. 2018; 50:20–25. [DOI] [PMC free article] [PubMed] [Google Scholar]
- 23. Mahajan S., Wei K.H., Nalley M.J., Gibilisco L., Bachtrog D.. De novo assembly of a young Drosophila Y chromosome using single-molecule sequencing and chromatin conformation capture. PLoS Biol. 2018; 16:e2006348. [DOI] [PMC free article] [PubMed] [Google Scholar]
- 24. Berlin K., Koren S., Chin C.S., Drake J.P., Landolin J.M., Phillippy A.M.. Assembling large genomes with single-molecule sequencing and locality-sensitive hashing. Nat. Biotechnol. 2015; 33:623–630. [DOI] [PubMed] [Google Scholar]
- 25. Disdero E., Filee J.. LoRTE: Detecting transposon-induced genomic variants using low coverage PacBio long read sequences. Mob DNA. 2017; 8:5. [DOI] [PMC free article] [PubMed] [Google Scholar]
- 26. Stuart T., Eichten S.R., Cahn J., Karpievitch Y.V., Borevitz J.O., Lister R.. Population scale mapping of transposable element diversity reveals links to gene regulation and epigenomic variation. Elife. 2016; 5:e20777. [DOI] [PMC free article] [PubMed] [Google Scholar]
- 27. Huddleston J., Chaisson M.J.P., Steinberg K.M., Warren W., Hoekzema K., Gordon D., Graves-Lindsay T.A., Munson K.M., Kronenberg Z.N., Vives L. et al.. Discovery and genotyping of structural variation from long-read haploid genome sequence data. Genome Res. 2017; 27:677–685. [DOI] [PMC free article] [PubMed] [Google Scholar]
- 28. Sedlazeck F.J., Rescheneder P., Smolka M., Fang H., Nattestad M., von Haeseler A., Schatz M.C.. Accurate detection of complex structural variations using single-molecule sequencing. Nat. Methods. 2018; 15:461–468. [DOI] [PMC free article] [PubMed] [Google Scholar]
- 29. Dudchenko O., Batra S.S., Omer A.D., Nyquist S.K., Hoeger M., Durand N.C., Shamim M.S., Machol I., Lander E.S., Aiden A.P. et al.. De novo assembly of the Aedes aegypti genome using Hi-C yields chromosome-length scaffolds. Science. 2017; 356:92–95. [DOI] [PMC free article] [PubMed] [Google Scholar]
- 30. Sandmann T., Jakobsen J.S., Furlong E.E.. ChIP-on-chip protocol for genome-wide analysis of transcription factor binding in Drosophila melanogaster embryos. Nat. Protoc. 2006; 1:2839–2855. [DOI] [PubMed] [Google Scholar]
- 31. Ramani V., Cusanovich D.A., Hause R.J., Ma W., Qiu R., Deng X., Blau C.A., Disteche C.M., Noble W.S., Shendure J. et al.. Mapping 3D genome architecture through in situ DNase Hi-C. Nat. Protoc. 2016; 11:2104–2121. [DOI] [PMC free article] [PubMed] [Google Scholar]
- 32. Koren S., Walenz B.P., Berlin K., Miller J.R., Bergman N.H., Phillippy A.M.. Canu: scalable and accurate long-read assembly via adaptive k-mer weighting and repeat separation. Genome Res. 2017; 27:722–736. [DOI] [PMC free article] [PubMed] [Google Scholar]
- 33. Durand N.C., Shamim M.S., Machol I., Rao S.S., Huntley M.H., Lander E.S., Aiden E.L.. Juicer provides a one-click system for analyzing loop-resolution Hi-C experiments. Cell Syst. 2016; 3:95–98. [DOI] [PMC free article] [PubMed] [Google Scholar]
- 34. Ramirez F., Bhardwaj V., Arrigoni L., Lam K.C., Gruning B.A., Villaveces J., Habermann B., Akhtar A., Manke T.. High-resolution TADs reveal DNA sequences underlying genome organization in flies. Nat. Commun. 2018; 9:189. [DOI] [PMC free article] [PubMed] [Google Scholar]
- 35. Thurmond J., Goodman J.L., Strelets V.B., Attrill H., Gramates L.S., Marygold S.J., Matthews B.B., Millburn G., Antonazzo G., Trovisco V. et al.. FlyBase 2.0: the next generation. Nucleic Acids Res. 2019; 47:D759–D765. [DOI] [PMC free article] [PubMed] [Google Scholar]
- 36. Kurtz S., Phillippy A., Delcher A.L., Smoot M., Shumway M., Antonescu C., Salzberg S.L.. Versatile and open software for comparing large genomes. Genome Biol. 2004; 5:R12. [DOI] [PMC free article] [PubMed] [Google Scholar]
- 37. Vaser R., Sovic I., Nagarajan N., Sikic M.. Fast and accurate de novo genome assembly from long uncorrected reads. Genome Res. 2017; 27:737–746. [DOI] [PMC free article] [PubMed] [Google Scholar]
- 38. Walker B.J., Abeel T., Shea T., Priest M., Abouelliel A., Sakthikumar S., Cuomo C.A., Zeng Q., Wortman J., Young S.K. et al.. Pilon: an integrated tool for comprehensive microbial variant detection and genome assembly improvement. PLoS One. 2014; 9:e112963. [DOI] [PMC free article] [PubMed] [Google Scholar]
- 39. Peng Y., Leung H.C., Yiu S.M., Chin F.Y.. IDBA-UD: a de novo assembler for single-cell and metagenomic sequencing data with highly uneven depth. Bioinformatics. 2012; 28:1420–1428. [DOI] [PubMed] [Google Scholar]
- 40. Langmead B., Salzberg S.L.. Fast gapped-read alignment with Bowtie 2. Nat. Methods. 2012; 9:357–359. [DOI] [PMC free article] [PubMed] [Google Scholar]
- 41. Bao W., Kojima K.K., Kohany O.. Repbase Update, a database of repetitive elements in eukaryotic genomes. Mob. DNA. 2015; 6:11. [DOI] [PMC free article] [PubMed] [Google Scholar]
- 42. Altschul S.F., Gish W., Miller W., Myers E.W., Lipman D.J.. Basic local alignment search tool. J. Mol. Biol. 1990; 215:403–410. [DOI] [PubMed] [Google Scholar]
- 43. Quinlan A.R., Hall I.M.. BEDTools: a flexible suite of utilities for comparing genomic features. Bioinformatics. 2010; 26:841–842. [DOI] [PMC free article] [PubMed] [Google Scholar]
- 44. Dewey C.N. Aligning multiple whole genomes with Mercator and MAVID. Methods Mol. Biol. 2007; 395:221–236. [DOI] [PubMed] [Google Scholar]
- 45. Wickham H. ggplot2: elegant graphics for data analysis. Use R. 2009; 1–212. [Google Scholar]
- 46. Langmead B. Aligning short sequencing reads with Bowtie. Curr. Protoc. Bioinformatics. 2010; doi:10.1002/0471250953.bi1107s32. [DOI] [PMC free article] [PubMed] [Google Scholar]
- 47. Mohn F., Sienski G., Handler D., Brennecke J.. The rhino-deadlock-cutoff complex licenses noncanonical transcription of dual-strand piRNA clusters in Drosophila. Cell. 2014; 157:1364–1379. [DOI] [PubMed] [Google Scholar]
- 48. Johnson N.R., Yeoh J.M., Coruh C., Axtell M.J.. Improved placement of multi-mapping small RNAs. G3 (Bethesda). 2016; 6:2103–2111. [DOI] [PMC free article] [PubMed] [Google Scholar]
- 49. Filion G.J., van Bemmel J.G., Braunschweig U., Talhout W., Kind J., Ward L.D., Brugman W., de Castro I.J., Kerkhoven R.M., Bussemaker H.J. et al.. Systematic protein location mapping reveals five principal chromatin types in Drosophila cells. Cell. 2010; 143:212–224. [DOI] [PMC free article] [PubMed] [Google Scholar]
- 50. Huang W., Massouras A., Inoue Y., Peiffer J., Ramia M., Tarone A.M., Turlapati L., Zichner T., Zhu D., Lyman R.F. et al.. Natural variation in genome architecture among 205 Drosophila melanogaster genetic reference panel lines. Genome Res. 2014; 24:1193–1208. [DOI] [PMC free article] [PubMed] [Google Scholar]
- 51. Bergman C.M., Quesneville H., Anxolabehere D., Ashburner M.. Recurrent insertion and duplication generate networks of transposable element sequences in the Drosophila melanogaster genome. Genome Biol. 2006; 7:R112. [DOI] [PMC free article] [PubMed] [Google Scholar]
- 52. Saito K., Inagaki S., Mituyama T., Kawamura Y., Ono Y., Sakota E., Kotani H., Asai K., Siomi H., Siomi M.C.. A regulatory circuit for piwi by the large Maf gene traffic jam in Drosophila. Nature. 2009; 461:1296–1299. [DOI] [PubMed] [Google Scholar]
- 53. Robine N., Lau N.C., Balla S., Jin Z., Okamura K., Kuramochi-Miyagawa S., Blower M.D., Lai E.C.. A broadly conserved pathway generates 3′UTR-directed primary piRNAs. Curr. Biol. 2009; 19:2066–2076. [DOI] [PMC free article] [PubMed] [Google Scholar]
- 54. Axtell M.J. ShortStack: comprehensive annotation and quantification of small RNA genes. RNA. 2013; 19:740–751. [DOI] [PMC free article] [PubMed] [Google Scholar]
- 55. Shpiz S., Ryazansky S., Olovnikov I., Abramov Y., Kalmykova A.. Euchromatic transposon insertions trigger production of novel Pi- and endo-siRNAs at the target sites in the drosophila germline. PLos Genet. 2014; 10:e1004138. [DOI] [PMC free article] [PubMed] [Google Scholar]
- 56. Huang W., Carbone M.A., Magwire M.M., Peiffer J.A., Lyman R.F., Stone E.A., Anholt R.R., Mackay T.F.. Genetic basis of transcriptome diversity in Drosophila melanogaster. Proc. Natl. Acad. Sci. U.S.A. 2015; 112:E6010–E6019. [DOI] [PMC free article] [PubMed] [Google Scholar]
- 57. Le Thomas A., Marinov G.K., Aravin A.A.. A transgenerational process defines piRNA biogenesis in Drosophila virilis. Cell Rep. 2014; 8:1617–1623. [DOI] [PMC free article] [PubMed] [Google Scholar]
- 58. Erwin A.A., Galdos M.A., Wickersheim M.L., Harrison C.C., Marr K.D., Colicchio J.M., Blumenstiel J.P.. piRNAs are associated with diverse transgenerational effects on gene and transposon expression in a hybrid dysgenic syndrome of D. virilis. PLos Genet. 2015; 11:e1005332. [DOI] [PMC free article] [PubMed] [Google Scholar]
- 59. Chin C.S., Peluso P., Sedlazeck F.J., Nattestad M., Concepcion G.T., Clum A., Dunn C., O’Malley R., Figueroa-Balderas R., Morales-Cruz A. et al.. Phased diploid genome assembly with single-molecule real-time sequencing. Nat. Methods. 2016; 13:1050–1054. [DOI] [PMC free article] [PubMed] [Google Scholar]
- 60. Adrion J.R., Song M.J., Schrider D.R., Hahn M.W., Schaack S.. Genome-wide estimates of transposable element insertion and deletion rates in Drosophila melanogaster. Genome Biol. Evol. 2017; 9:1329–1340. [DOI] [PMC free article] [PubMed] [Google Scholar]
- 61. Kelleher E.S. Reexamining the P-element invasion of Drosophila melanogaster through the lens of piRNA silencing. Genetics. 2016; 203:1513–1531. [DOI] [PMC free article] [PubMed] [Google Scholar]
- 62. Kelleher E.S., Azevedo R.B.R., Zheng Y.. The evolution of small-RNA-mediated silencing of an invading transposable element. Genome Biol. Evol. 2018; 10:3038–3057. [DOI] [PMC free article] [PubMed] [Google Scholar]
- 63. Kofler R., Hill T., Nolte V., Betancourt A.J., Schlotterer C.. The recent invasion of natural Drosophila simulans populations by the P-element. Proc. Natl. Acad. Sci. U.S.A. 2015; 112:6659–6663. [DOI] [PMC free article] [PubMed] [Google Scholar]
- 64. Kaminker J.S., Bergman C.M., Kronmiller B., Carlson J., Svirskas R., Patel S., Frise E., Wheeler D.A., Lewis S.E., Rubin G.M. et al.. The transposable elements of the Drosophila melanogaster euchromatin: a genomics perspective. Genome Biol. 2002; 3:RESEARCH0084. [DOI] [PMC free article] [PubMed] [Google Scholar]
- 65. Barron M.G., Fiston-Lavier A.S., Petrov D.A., Gonzalez J.. Population genomics of transposable elements in Drosophila. Annu. Rev. Genet. 2014; 48:561–581. [DOI] [PubMed] [Google Scholar]
- 66. Lee Y.C., Langley C.H.. Transposable elements in natural populations of Drosophila melanogaster. Philos. Trans. R. Soc. Lond. B Biol. Sci. 2010; 365:1219–1228. [DOI] [PMC free article] [PubMed] [Google Scholar]
- 67. Chiolo I., Minoda A., Colmenares S.U., Polyzos A., Costes S.V., Karpen G.H.. Double-strand breaks in heterochromatin move outside of a dynamic HP1a domain to complete recombinational repair. Cell. 2011; 144:732–744. [DOI] [PMC free article] [PubMed] [Google Scholar]
- 68. Cramer D., Serrano L., Schaefer M.H.. A network of epigenetic modifiers and DNA repair genes controls tissue-specific copy number alteration preference. Elife. 2016; 5:e16519. [DOI] [PMC free article] [PubMed] [Google Scholar]
- 69. Janssen A., Colmenares S.U., Karpen G.H.. Heterochromatin: guardian of the genome. Annu. Rev. Cell Dev. Biol. 2018; 34:265–288. [DOI] [PubMed] [Google Scholar]
- 70. Lim B., Mun J., Kim Y.S., Kim S.Y.. Variability in chromatin architecture and associated DNA repair at genomic positions containing somatic mutations. Cancer Res. 2017; 77:2822–2833. [DOI] [PubMed] [Google Scholar]
- 71. Wu W., Nishikawa H., Fukuda T., Vittal V., Asano M., Miyoshi Y., Klevit R.E., Ohta T.. Interaction of BARD1 and HP1 is required for BRCA1 retention at sites of DNA damage. Cancer Res. 2015; 75:1311–1321. [DOI] [PMC free article] [PubMed] [Google Scholar]
- 72. Nair N., Shoaib M., Sorensen C.S.. Chromatin dynamics in genome stability: roles in suppressing endogenous DNA damage and facilitating DNA repair. Int. J. Mol. Sci. 2017; 18:E1486. [DOI] [PMC free article] [PubMed] [Google Scholar]
Associated Data
This section collects any data citations, data availability statements, or supplementary materials included in this article.