Abstract
Glutathione S‐transferase Zeta 1‐1 (GSTZ1‐1), an enzyme involved in the catabolism of phenylalanine and the detoxification of xenobiotics, plays a tumour suppressor role in hepatocellular carcinoma (HCC), but the underlying mechanism remains largely unknown. Here, we further explored the function of GSTZ1‐1 in HCC through transcriptome analysis by RNA sequencing. The analysis revealed that 223 genes were upregulated and 290 genes were downregulated in GSTZ1‐1‐overexpressing Huh7 cells. Gene Ontology analysis showed that these differentially expressed genes (DEGs) were highly enriched for protein phosphorylation, cell cycle arrest and metabolic processes. Pathway analysis revealed that metabolic pathways were the predominant enriched pathways among the upregulated genes, while the TGF‐β and Wnt/β‐catenin signalling pathways were prominent in the downregulated clusters. Pathway interaction networks also showed that the Wnt/β‐catenin pathway was located in the centre of the cluster. The expression levels of selected DEGs were validated by qRT‐PCR, and Wnt/β‐catenin involvement was validated by luciferase assays, western blotting and immunohistochemical analysis in vitro and in vivo. These results provide a comprehensive overview of the transcriptome in GSTZ1‐1‐overexpressing Huh7 cells and indicate that GSTZ1‐1 may play a tumour suppressor role by inactivating the Wnt/β‐catenin signalling pathway.
Keywords: GSTZ1‐1, HCC, hepatocellular carcinoma, RNA‐Seq, Wnt, β‐catenin signalling pathway
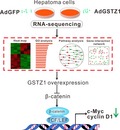
Glutathione S‐transferase Zeta 1‐1 (GSTZ1‐1), an enzyme involved in the catabolism of phenylalanine and the detoxification of xenobiotics, plays a tumour suppressor role in hepatocellular carcinoma. Here, we found that GSTZ1‐1 could downregulate Wnt/β‐catenin signalling in hepatoma cells.
Abbreviations
- DEG
differentially expressed genes
- GO
Gene Ontology
- HCC
hepatocellular carcinoma
- IHC
immunohistochemical
- KEGG
Kyoto Encyclopedia of Genes and Genomes
- NASH
nonalcoholic steatohepatitis
- RNA‐seq
RNA sequencing
Introduction
Liver cancer is the sixth most common human malignancy and ranked fourth in global mortality in 2018 1. Hepatitis B virus or hepatitis C virus infection, nonalcoholic steatohepatitis (NASH) and alcohol consumption are the main risk factors for liver cancer 2. Recently, the roles of metabolic disorders in tumorigenesis have been increasingly researched. Many studies have reported that metabolic disorders such as obesity, diabetes and NASH can trigger hepatocellular carcinoma (HCC) 3, 4, 5, 6.
Glutathione S‐transferase Zeta 1 was identified by sequence alignment and phylogenetic analysis approximately 20 years ago 7. GSTZ1‐1 is a 24‐kDa cytoplasmic protein that isomerizes maleylacetoacetate to produce fumarylacetoacetate, which is the penultimate step in phenylalanine (Phe) degradation; furthermore, GSTZ1‐1 can detoxify xenobiotics 8, 9, 10.
Importantly, our previous work and other data have shown that GSTZ1‐1 is downregulated in (HCC) and that it plays a tumour suppressor role in HCC progression by inhibiting the NRF2/IGF1R axis 11, 12. However, a full and comprehensive understanding of the molecular mechanism of GSTZ1‐1 in HCC development remains largely unknown.
High‐throughput RNA sequencing (RNA‐Seq) is a sequencing‐based tool that surveys the entire transcriptome at the cellular level 13. In the present work, we aimed to comprehensively identify differentially expressed gene (DEG) profiles related to GSTZ1‐1 overexpression in hepatoma cells. Huh7 cells, which exhibit relatively low endogenous GSTZ1‐1 levels, were infected with a recombinant adenovirus prior to RNA‐Seq analysis and DEG profiling. Gene Ontology (GO), pathway, pathway interaction network, gene interaction network and co‐expression network analyses were conducted to determine the potential associations between the identified DEGs and HCC. Our findings may help illuminate the molecular mechanisms underlying the tumour suppressor role of GSTZ1‐1 during HCC development.
Materials and methods
Antibodies, cell lines and plasmids
The following antibodies were used in this study: GSTZ1‐1 (Cat#GTX106109; GeneTex, Irvine, CA, USA), β‐catenin (Cat#RLM3403; Ruiying, Suzou, Jiangsu, China), c‐Myc (Cat#BS2462; Bioworld, Louis Park, MN, USA), cyclin D1 (Cat#2978; CST, Beverly, MA, USA), RB (Cat#BS1310; Bioworld) and β‐actin (Cat#BL005B; Biosharp, Hefei, Anhui, China). Huh7 cells were obtained from the Cell Bank of the Chinese Academy of Sciences (CBCAS, Shanghai, China). HepG2, SNU449 and HEK293T cells were obtained from the American Type Culture Collection (ATCC, Rockville, MD, USA). The cells were cultured in Dulbecco’s modified Eagle’s medium (HyClone, Logan, UT, USA) supplemented with 10% FBS (Gibco, Grand Island, NY, USA) and 100 units per mL penicillin and streptomycin under standard conditions (37 °C in a humidified 5% CO2 atmosphere).
Adenovirus‐mediated GSTZ1‐1 overexpression
The full‐length cDNA of GSTZ1‐1 (NM_145870.2) was cloned into the shuttle vector pAdTrack‐TO4. The recombinant adenovirus AdGSTZ1‐1 was prepared as described previously 14. Huh7 cells were infected with AdGSTZ1‐1 to establish a GSTZ1‐1‐overexpression (GSTZ1‐1‐OE) cell model.
CRISPR‐Cas9‐mediated knockout of GSTZ1‐1
A single guide RNA (sgRNA) targeting GSTZ1‐1 was designed, synthesized and then cloned into a lentiCRISPR‐v2 vector. HEK293T cells were treated with GSTZ1‐1 sgRNA or lentiCRISPR‐v2, pMD2.G and psPAX2 for lentiviral preparation. Then, HepG2 and SNU449 cells were infected with the collected lentiviral supernatants for 48 h. The transduced cells were selected with 1 μg·mL−1 puromycin and diluted to single‐cell suspensions in a 96‐well plate. Single clones were generated from T‐A clones for genotyping and confirmed by western blotting. The associated primer sequences are shown in Table 1.
Table 1.
Sequences of the primers.
| FZD4 | Forward: TCCCACCACAGAACGACCA |
| Reverse: AAGCCAGCATCATAGCCACA | |
| FZD5 | Forward: CGTGGGCAACCAGAACCT |
| Reverse: GACCGTGTAGAGCAGCGTGA | |
| FZD6 | Forward: TCTGCTGTCTTCTGGGTTGG |
| Reverse: GCTGTAGCTCCTGTGCTGGTT | |
| WNT11 | Forward: ACAACAGTGAAGTGGGGAGACA |
| Reverse: ACCAGGTGCTTGCGGGT | |
| VANGL2 | Forward: CACGCATCGCCAAGGAC |
| Reverse: GGGCACGCAGCACAAAG | |
| NFAT5 | Forward: GTGTTTGTGGGCAACGACTC |
| Reverse: TGGAACCAGCAATTCCTATTCT | |
| UGT2B11 | Forward: GCAAACCTGCCAAACCCC |
| Reverse: TATTCCCGTCAAATCTCCACA | |
| EPHX1 | Forward: CACCGCCAGGATCTTTTACA |
| Reverse: GCCAAGAAACCTCCCGAAA | |
| E2F2 | Forward: CGTGCTGTTGGCAACTTTAA |
| Reverse: GGCAGAGGGTGGAGGTAGAG | |
| RB1 | Forward: CAAGTTTCCTAGTTCACCCTTACG |
| Reverse: CGGTCGCTGTTACATACCATCT | |
| TFDP2 | Forward: ATCAGAAGAACATTAGGCGAAGA |
| Reverse: AAAGCGATTTGCTGTAGGAGAA | |
| GSTZ1‐sg | Forward: CACCGCCCAGAACGCCATCACTTG |
| Reverse: AAACCAAGTGATGGCGTTCTGGGC | |
| GSTZ1‐seq | Forward: GGACCATGCAAGGGAGAA |
| Reverse: TTAAGACGGTTTAGTGGGAGTG |
Top‐luc reporter assays
Huh7 cells infected with a GFP‐expressing adenovirus (AdGFP) and AdGSTZ1‐1 were transiently co‐transfected with a Top‐luc reporter plasmid and a pRL‐TK plasmid using Lipofectamine™ 3000 (L3000015; Invitrogen, Carlsbad, CA, USA). Firefly and Renilla luciferase activity was measured using a Dual‐Glo Luciferase Assay System (Promega, Madison, WI, USA). The relative firefly luciferase activity was normalized to the corresponding Renilla luciferase activity.
RNA preparation and quantitative reverse‐transcription (RT)‐PCR (qRT‐PCR)
Total cellular RNA was extracted from cultured cells with TRIzol™ reagent (Invitrogen) and then reverse transcribed to generate cDNA using a PrimeScript™ RT Reagent Kit (Takara, Dalian, Liaoning, China) with random hexamers following the manufacturer’s procedures. qRT‐PCR was performed using iTaq™ Universal SYBR® Green Supermix according to the manufacturer’s manual. The primer sequences for qRT‐PCR are shown in Table 1.
Western blotting
Total cellular protein was extracted with cell lysis buffer (Beyotime, Nantong, China) and then quantified by BCA assay. The protein lysates were separated by SDS/PAGE, transferred to polyvinylidene difluoride membranes, probed with the indicated primary antibodies and HRP‐conjugated secondary antibodies, and then detected by enhanced chemiluminescence.
Patient tissues
Paired human HCC and nontumour tissues (NT) were obtained from eight patients who underwent surgery at the Second Affiliated Hospital of Chongqing Medical University between 2017 and 2018 approved by the Institutional Review Board of Chongqing Medical University. Informed written consent was obtained from all patients. The study methodologies conformed to the standards set by the Declaration of Helsinki.
Immunohistochemical (IHC) analysis
Human HCC and paired NT sections were deparaffinized, and then, antigens were retrieved in 10 mm citric acid buffer (pH 6.0) by microwave. Subsequently, the section samples were penetrated with 0.5% Triton X‐100, and endogenous peroxidase was blocked with 3% hydrogen peroxide (Cat#ZLI‐9311; zsbio, Beijing, China). The sections were incubated overnight at 4 °C with anti‐β‐catenin (1 : 200) and anti‐GSTZ1(1 : 200) primary antibodies. The slides were processed with a DAB Substrate Kit (Cat#ab64238; Abcam, Cambridge, MA, USA) according to the manufacturer’s protocol and counterstained with haematoxylin.
RNA‐Seq analysis
Total RNA was extracted from Huh7 cells infected with AdGFP or AdGSTZ1‐1 (n = 3 for each). RNA quality was assessed by a Nano Drop 2000 Bioanalyzer, and RNA‐Seq was performed by Shanghai Novel‐bio Company. The gene expression data have been deposited in the Gene Expression Omnibus (GEO) database under accession number http://www.ncbi.nlm.nih.gov/geo/query/acc.cgi?acc=GSE117822 15.
DEG analysis
Differentially expressed genes were screened using the algorithm DESeq under a threshold of |log2(fold change)|≥ 0.585 with a false discovery rate (FDR) ≤ 0.05.
GO analysis
Fisher’s exact test was used to classify the GO category (P ≤ 0.01), and the FDR values were calculated to correct the P‐values.
Pathway analysis
Pathway analysis was used to find significantly enriched pathways according to the Kyoto Encyclopedia of Genes and Genomes (KEGG) database. The upregulated and downregulated pathway categories with FDR values ≤0.05 are shown.
Pathway interaction network and gene interaction network analyses
The KEGG database was used to build a network of upregulated and downregulated pathways and genes according to their relationships with each other using a threshold of P ≤ 0.05.
Co‐expression network analysis
Gene co‐expression networks were used to search for interactions among genes as described previously 16. For each pair of genes, Pearson’s correlation coefficient was calculated and significantly correlated pairs were chosen for construction of the network 17. In network analysis, the degree of centrality is the simplest and most important measure of the relative importance of a gene within a network. The degree of centrality is defined as the number of links one node has to another 18. The k‐core for each specific gene, indicating its hub status, was used to identify the core regulatory factors in networks. The degree difference (DifDegree) and k‐core difference (DifKcore) between two classes of samples were used to locate the core regulatory factors in this study. Genes with a DifDegree ≥ 12 and a DifKcore ≥ 8 were considered to be core regulatory factors 19, 20.
Statistical analysis
Statistical data are shown as the means and standard deviations (SDs). P‐values were calculated by two‐tailed Student’s t‐tests using graph‐pad prism 6.0 software (GraphPad‐Prism Software Inc., San Diego, CA, USA), and a P ≤ 0.05 was defined as significant in this study.
Results
Analysis of DEGs identified with RNA‐Seq
To further assess the function of GSTZ1‐1 in HCC, we performed RNA‐Seq to identify the DEGs between GSTZ1‐1‐overexpressing hepatoma cells and control cells. The DESeq algorithm was used to identify DEGs between the AdGSTZ1‐1 group and the AdGFP control group. The thresholds for DEG detection in this study were an FDR ≤ 0.05 and a│log2FC│≥ 0.585 (GSTZ1‐1‐OE vs control). A heat map (Fig. 1A) and a volcano plot (Fig. 1B) were constructed to display the comprehensive gene expression changes that were associated with GSTZ1‐1 overexpression. In total, 513 DEGs were identified following GSTZ1‐1 overexpression. Of these genes, 223 were upregulated and 290 were downregulated in GSTZ1‐1‐overexpressing Huh7 cells.
Figure 1.
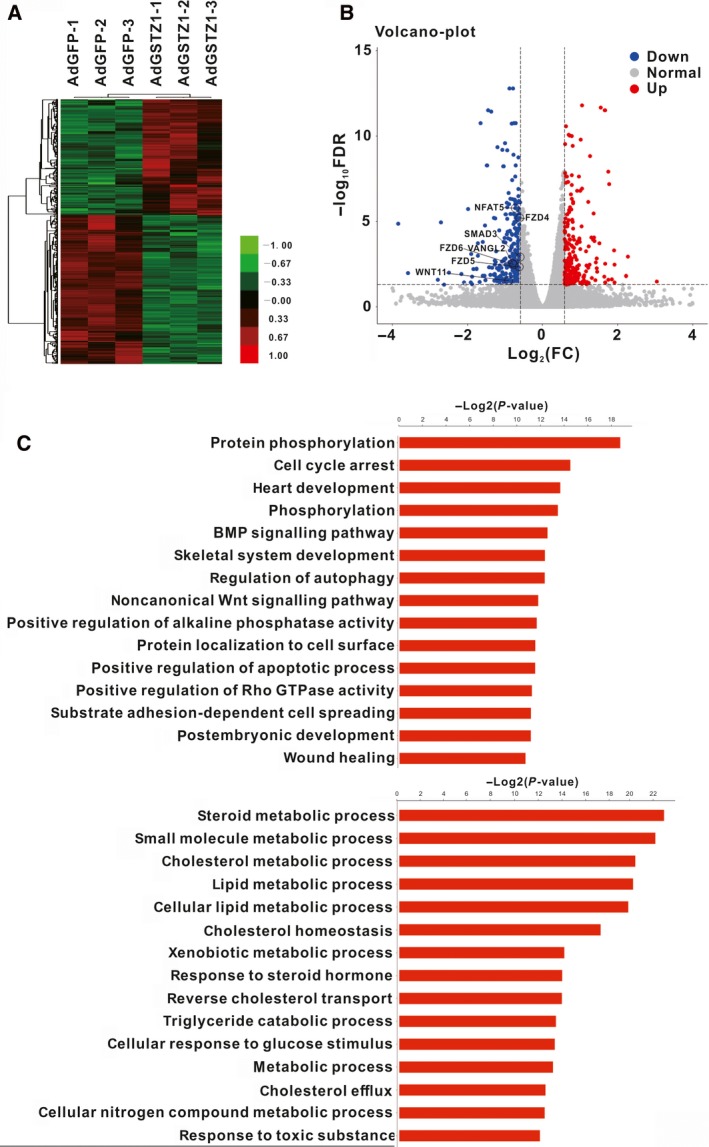
Identification of DEGs between Huh7 cells overexpressing GSTZ1‐1 and control Huh7 cells and GO analysis of the significant DEGs. (A) Clustering of DEGs showing transcript enrichment, which is encoded in the heat map from low (green) to high (red). (B) Volcano plot representing whole‐transcriptome changes in GSTZ1‐1‐overexpressing Huh7 cells (C) The top 15 downregulated (top) and upregulated (bottom) biological process (BP) terms are shown. P < 0.01 for all significant BP terms.
GO analysis
To investigate the exact impacts of these DEGs on HCC development, GO analysis was used for gene annotation. A total of 304 GO terms were enriched among all downregulated DEGs. Among the upregulated DEGs, 292 GO terms were enriched. The enriched biological processes for the downregulated genes included protein phosphorylation and cell cycle arrest. However, the significant biological processes enriched for the upregulated genes were mainly metabolic processes, such as steroid metabolism, small molecule metabolism, xenobiotic metabolic process and responses to toxic substances (Fig. 1C).
Pathway analysis and pathway interaction network analysis
The KEGG database was used to annotate the identified DEGs. Importantly, downregulated pathway terms, such as the TGF‐β signalling and Wnt/β‐catenin signalling pathway terms, are tightly associated with the development of liver cancer 21, 22. Among the upregulated pathways, the glycine, serine and threonine metabolism pathway was the most enriched, followed by the pathway for metabolism of xenobiotics by cytochrome P450 (Fig. 2A). A pathway interaction network was established for analysis of the associations of these pathways (Fig. 2B). As expected, we found that most upregulated metabolic pathways were located in the centre of the network, indicating metabolic pathway as the key upregulated pathway. Among the downregulated pathways, the Wnt and TGF‐β pathways were associated with many other pathways, suggesting that these were core downregulated pathways regulated by GSTZ1‐1 in HCC.
Figure 2.
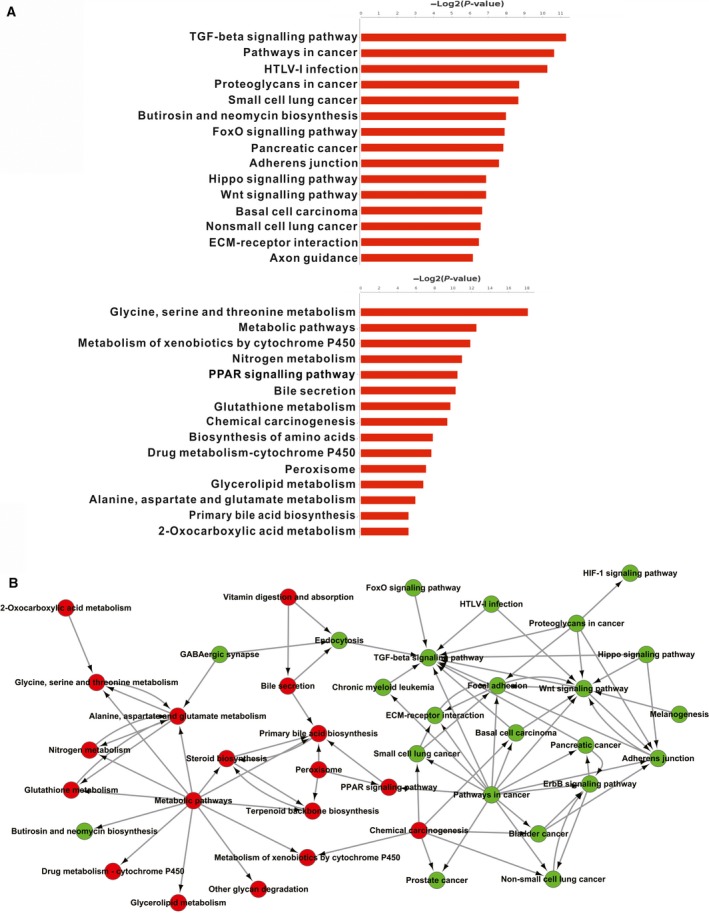
Pathway enrichment and pathway interaction network analysis. (A) The top 15 downregulated (top) and upregulated (bottom) pathways are shown. (B) Pathway interaction network. Red and green, represent upregulated and downregulated pathways, respectively.
DEG interaction network analysis
The DEGs identified in this study were used to establish a gene interaction network to determine the associations between the DEGs. The relationships between DEGs included activation/phosphorylation, binding/association, expression, inhibition, dissociation and compound relationships. The TGF‐β pathway‐related genes TGFBR1, SMAD3, SMAD6, BMP8A, SMAD9, FST and ACVR2B were downregulated. Similarly, we found that the Wnt/β‐catenin pathway‐related genes FZD4, FZD5, FZD6 VANGL2, NFAT5 and WNT11 were also downregulated. Notably, the cytochrome P450‐mediated xenobiotic metabolism‐related UGT2B11, GSTA2, EPHX1, SULT2A1, UGT1A8 and GSTA1 were upregulated and they interacted with each other (Fig. 3) 20. To validate the reliability of the RNA‐Seq data, we observed the mRNA levels of E2F2, Rb and TFDP2 in Huh7 GSTZ1‐1‐overexpressing and HepG2‐knockout cells by qRT‐PCR. We found that overexpression of GSTZ1‐1 reduced the mRNA expression of these genes, whereas knockout of GSTZ1‐1 had the opposite effect. We further detected Rb protein expression by western blot analysis and obtained the same results. As controls for GSTZ1‐1 function, UGT2B11 and EPHX1 (the metabolism of xenobiotics‐related genes) mRNA levels were detected by qRT‐PCR (Fig. 4A,B).
Figure 3.
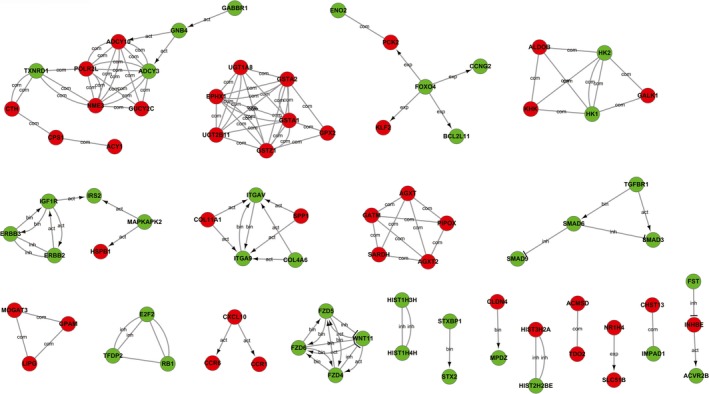
Gene interaction network analysis. The red and green circles represent upregulated and downregulated genes, respectively, in Huh7 cells overexpressing GSTZ1‐1. ‘Act’, activation; ‘inh’, inhibition; ‘bin’, binding; ‘com’, compound; ‘exp’, expression.
Figure 4.
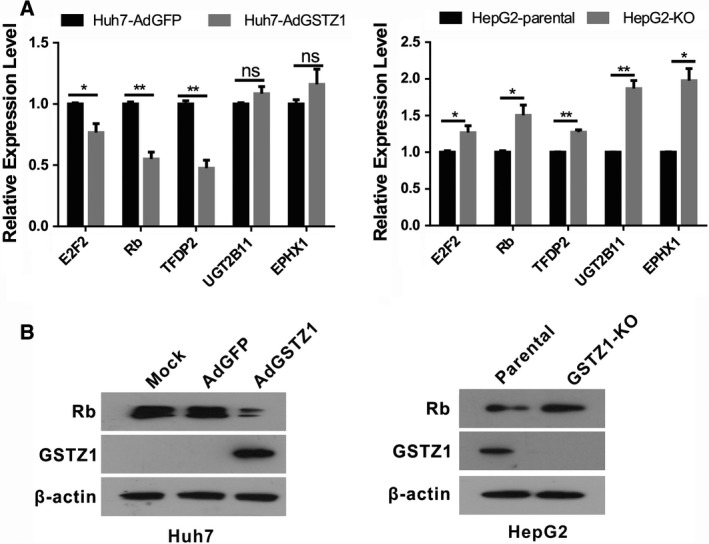
Validation of the gene interaction network analysis. (A) mRNA expression levels of cell proliferation‐related genes including E2F2, RB1 and TFDP2, metabolism of xenobiotic‐related genes including UGT2B11 and EPHX1 in GSTZ1‐1‐overexpressing and knockout cells. (B) Western blot analysis of endogenous Rb protein levels in GSTZ1‐1‐overexpressing and knockout cells. All error bars are the mean ± SD. All of the qRT‐PCR and western blot data are representative of three independent experiments. *P < 0.05, **P < 0.01, as determined by two‐tailed Student’s t‐test. ‘ns’ indicates ‘no significance’.
Co‐expression network analysis
Next, a co‐expression gene network was constructed to analyse the complex relationships among the DEGs. The co‐expression gene networks of the GSTZ1‐1 group and the GFP control group differed significantly. The co‐expression network of the control group comprised 314 network nodes and 2698 connections, including 1145 that were negative connection and 1553 positive connection (Fig. 5A). Similarly, the network of the GSTZ1‐1 group contained 314 network nodes and 2500 connections, including 1399 that were positive, and 1101 that were negative (Fig. 5B). Differentially co‐expressed genes with DifDegree values ≥ 12 and DifKcore ≥ 8 values were defined as the core regulatory factors in the network. Based on the above criteria, IDH1, TGFBR1, TRIM2, BIRC3 and NUDT8 might play pivotal roles in the interactions 19, 20.
Figure 5.
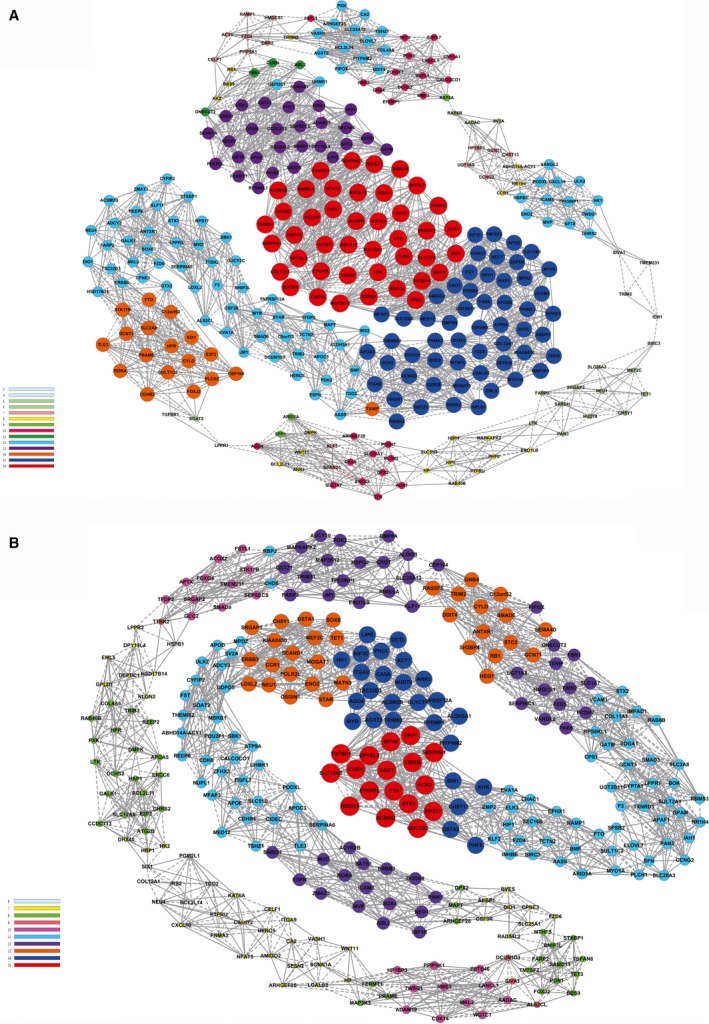
Gene co‐expression network. (A) Gene co‐expression networks for samples from control Huh7 cells. (B) Gene co‐expression networks for samples from GSTZ1‐1‐overexpressing Huh7 cells. A solid line indicates a positive correlation, and a dashed line indicates a negative correlation.
Validation of the correlation between GSTZ1‐1 and the Wnt/β‐catenin pathway
According to the results described above, the Wnt/β‐catenin pathway was downregulated and was in the centre of the pathway interaction network. The six downregulated DEGs (FZD4, FZD5, FZD6, WNT1, VANGL2 and NFAT5) (Fig. 6A) involved in the pathway were analysed by qRT‐PCR (Fig. 6B), and the results were consistent with the RNA‐Seq results. Considering the pivotal role of Wnt/β‐catenin signalling in hepatocarcinogenesis, we further explored whether overexpression of GSTZ1‐1 suppressed Wnt/β‐catenin signalling. Indeed, GSTZ1‐1 overexpression significantly reduced the activity of β‐catenin as determined by the Top‐luc reporter assay (Fig. 6C). Furthermore, GSTZ1‐1 overexpression decreased the protein expression levels of β‐catenin, as well as those of the downstream targets c‐Myc and cyclin D1 in Huh7 cells, whereas knockout of GSTZ1‐1 increased β‐catenin, c‐Myc and cyclin D1 protein levels in HepG2 and SNU449 cells (Fig. 6D).
Figure 6.
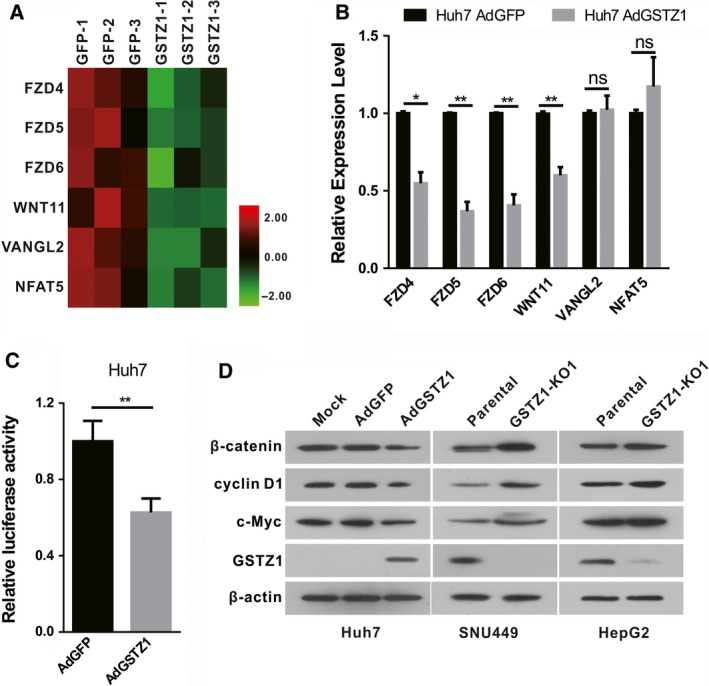
Validation of the Wnt/β‐catenin signalling pathway. (A) Heat map of downregulated genes involved in Wnt/β‐catenin signalling. (B) Six representative DEGs (FZD4, FZD5, FZD6, WNT11, VANGL2 and NFAT5) detected by RNA‐Seq were confirmed using qRT‐PCR. (C) GSTZ1‐1‐overexpressing Huh7 cells transfected with Top‐luc and Renilla pRL‐TK plasmids were subjected to dual luciferase assays 36 h after transfection. (D) Western blot analysis of the expression of β‐catenin, cyclin D1 and c‐Myc in GSTZ1‐1‐overexpressing Huh7 cells and HepG2, SNU449 knockout cells. All error bars are the mean ± SD. All of the qRT‐PCR and western blot data are representative of three independent experiments. *P < 0.05, **P < 0.01, as determined by two‐tailed Student’s t‐test. ‘ns’ indicates ‘no significance’.
To further investigate the clinical relevance of GSTZ1‐1 and the Wnt/β‐catenin pathway, we performed IHC analyses to assess the co‐existence of GSTZ1‐1 and β‐catenin in paired tumour and nontumour liver tissues from patients. We found that β‐catenin was expressed at low levels in the NT but was significantly highly expressed in tumours, exhibiting expression patterns exactly opposite of those of GSTZ1‐1 (Fig. 7A). We further detected the protein expression levels of β‐catenin and GSTZ1‐1 and found they were negatively correlated in human HCC tissues (Fig. 7B). Together, our data suggest that GSTZ1‐1 may negatively regulate Wnt/β‐catenin pathway in HCC tissues.
Figure 7.
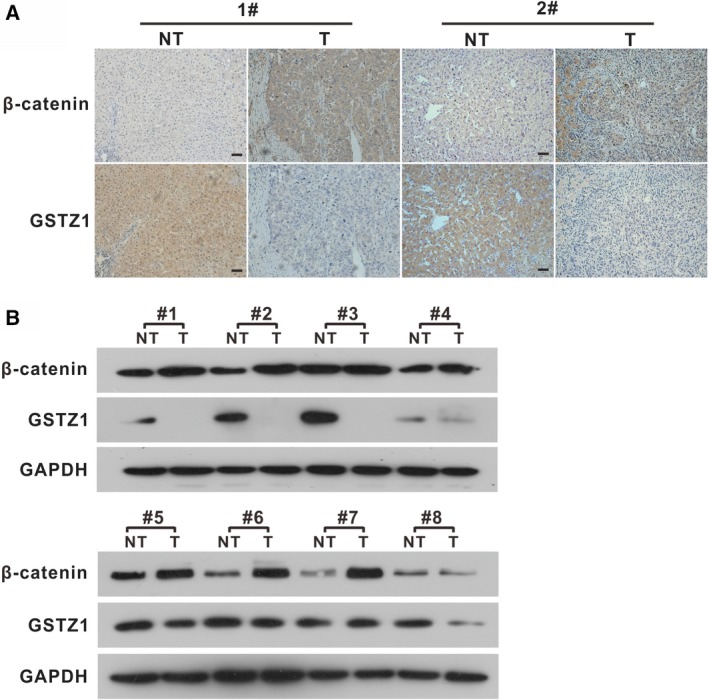
Validation of the negative correlation between GSTZ1‐1 expression and the Wnt/β‐catenin signalling pathway in HCC samples. (A) Representative images of IHC staining of β‐catenin and GSTZ1‐1 in paired HCC and NT. Scale bars, 50 μm. (B) Western blot analysis of β‐catenin and GSTZ1‐1 in paired HCC and paired NT samples. T, paired tumour tissues.
Discussion
Glutathione S‐transferases (GSTs) play various roles in xenobiotic and endogenous compound metabolism. Human genetic diseases have been reported that correspond to deficiencies in all enzymes in this pathway, with the exception of the penultimate enzyme, GSTZ1‐1 23. GSTZ1‐1, a member of the GSTs family that is widely distributed among many species, has essential functions in Phe metabolism. The previous study confirmed that GSTZ1‐1 deficiency is associated with poor prognosis in HCC.
In addition to the modulation of xenobiotic metabolism, GSTs are also tightly associated with the regulation of cellular signalling pathways. Class Mu and Pi GSTs have been reported to inhibit Ask1 and JNK by physically interacting with these kinases 24, 25. Moreover, GSTs deficiency has been reported to be involved in tumorigenesis. For example, Gstp1/p2 −/− mice show approximately threefold more papillomas than controls 26. Gstz1 −/− mice develop liver necrosis when administered 3% Phe in drinking water 27. These previous findings strongly suggested that GSTs may participate in tumorigenesis by regulating cellular pathways, but the exact molecular mechanisms remain unknown.
The RNA‐Seq data obtained in this study provide comprehensive expression profiles of GSTZ1‐1‐overexpressing Huh7 cells compared to control cells. The GO analysis results revealed the significant biological processes associated with the DEGs mainly included small molecule metabolic processes and xenobiotic metabolic processes. Our pathway interaction network analyses showed that most of the metabolic pathways were upregulated, while some oncogenic signalling pathways including the Wnt/β‐catenin pathway were downregulated. These results suggest that GSTZ1‐1 might suppress hepatocarcinogenesis and HCC progression by regulating metabolic programmes and downregulating relevant oncogenic signalling pathways.
Wnt/β‐catenin signalling is commonly aberrantly active in HCC 22. β‐Catenin, a core component of this signalling pathway, is bound to a multiprotein degradation complex comprising casein kinase I, glycogen synthase kinase 3β, adenomatous polyposis coli protein and axin 28. When Wnt proteins bind to cell‐surface receptors (frizzled) and co‐receptors, the canonical Wnt pathway is induced and β‐catenin accumulates in the cytoplasm and translocates to the nucleus 29, where it promotes the transcription of genes involved in cell proliferation, migration and metastasis 30, 31. Anneke et al. showed that GSTZ1‐1 deficiency leads to GSH depletion and oxidative stress 32. ROS may augment Wnt/β‐catenin signalling by mediating the redox‐dependent interaction between nucleoredoxin and dishevelled 33, 34. In our present work, we showed that GSTZ1‐1 can suppress β‐catenin expression and consequently Wnt/β‐catenin signalling. Therefore, we speculate that this regulation may be mediated by ROS, but the molecular mechanism remains to be further studied.
In summary, our transcriptomic results indicate, for the first time, that GSTZ1‐1 can downregulate Wnt/β‐catenin signalling in hepatoma cells. This study broadens our understanding of the biological function of GSTZ1‐1, which may be helpful in further elucidating the underlying molecular mechanism by which GSTZ1‐1 acts as a tumour suppressor in the context of HCC.
Conflict of interest
The authors declare no conflict of interest.
Author contributions
NT and KW conceived the study and modified the paper. CL completed the experiments, conducted the data analysis and drafted the manuscript. QJW helped with the data analysis.
Acknowledgements
We would like to thank Dr. T‐C He (University of Chicago, USA) for providing the pAdEasy plasmid system, pTop‐luc and the adenovirus AdGFP. The lentiCRISPR‐v2, pMD2.G and psPAX2 plasmids were provided by Prof. Ding Xue of Tsinghua University. This work was supported by the China National Natural Science Foundation under Grant (number 81872270 and 81572683 to NT and 81602417 to KW), the Scientific Research Innovation Project for Postgraduate in Chongqing under Grant (number CYS18207), the Program for Innovation Team of Higher Education in Chongqing under Grant (number CXTDX201601015), the Natural Science Foundation Project of Chongqing (number cstc2019jcyj‐msxmX0587 and cstc2018jcyjAX0254) and the Leading Talent Program of CQ CSTC under Grant (number CSTCCXLJRC201719).
Contributor Information
Ni Tang, Email: nitang@cqmu.edu.cn.
Kai Wang, Email: wangkai@cqmu.edu.cn.
Data accessibility
The gene expression data have been deposited in the Gene Expression Omnibus (GEO) database under accession number http://www.ncbi.nlm.nih.gov/geo/query/acc.cgi?acc=GSE117822.
References
- 1. Bray F, Ferlay J, Soerjomataram I, Siegel RL, Torre LA and Jemal A (2018) Global cancer statistics 2018: GLOBOCAN estimates of incidence and mortality worldwide for 36 cancers in 185 countries. CA Cancer J Clin 68, 394–424. [DOI] [PubMed] [Google Scholar]
- 2. Llovet JM, Zucman‐Rossi J, Pikarsky E, Sangro B, Schwartz M, Sherman Mand Gores G (2016) Hepatocellular carcinoma. Nat Rev Dis Primers 2, 16018. [DOI] [PubMed] [Google Scholar]
- 3. Erez A and DeBerardinis RJ (2015) Metabolic dysregulation in monogenic disorders and cancer ‐ finding method in madness. Nat Rev Cancer 15, 440–448. [DOI] [PubMed] [Google Scholar]
- 4. Ward PS and Thompson CB (2012) Metabolic reprogramming: a cancer hallmark even warburg did not anticipate. Cancer Cell 21, 297–308. [DOI] [PMC free article] [PubMed] [Google Scholar]
- 5. Masoudi‐Nejad A and Asgari Y (2015) Metabolic cancer biology: structural‐based analysis of cancer as a metabolic disease, new sights and opportunities for disease treatment. Semin Cancer Biol 30, 21–29. [DOI] [PubMed] [Google Scholar]
- 6. Xiang J, Zhang Y, Tuo L, Liu R, Gou D, Liang L, Chen C, Xia J, Tang N and Wang K (2019) Transcriptomic changes associated with PCK1 overexpression in hepatocellular carcinoma cells detected by RNA‐seq. Genes Dis. 10.1016/j.gendis.2019.04.004 [DOI] [PMC free article] [PubMed] [Google Scholar]
- 7. Board GP, Baker TR, Chelvanayagam G and Jermiin SL (1997) Zeta, a novel class of glutathione transferases in a range of species from plants to humans. Biochem J 328, 929–935. [DOI] [PMC free article] [PubMed] [Google Scholar]
- 8. Townsend DM and Tew KD (2003) The role of glutathione‐S‐transferase in anti‐cancer drug resistance. Oncogene 22, 7369–7375. [DOI] [PMC free article] [PubMed] [Google Scholar]
- 9. Fernández‐Cañón JM and P. M. A. (1998) Characterization of a fungal maleylacetoacetate isomerase gene and identification of its human homologue. J Biol Chem 273, 329–337. [DOI] [PubMed] [Google Scholar]
- 10. Hayes JD, Flanagan JU and Jowsey IR (2005) Glutathione transferases. Annu Rev Pharmacol Toxicol 45, 51–88. [DOI] [PubMed] [Google Scholar]
- 11. Jahn SC, Solayman MH, Lorenzo RJ, Langaee T, Stacpoole PW and James MO (2016) GSTZ1 expression and chloride concentrations modulate sensitivity of cancer cells to dichloroacetate. Biochim Biophys Acta 1860, 1202–1210. [DOI] [PMC free article] [PubMed] [Google Scholar]
- 12. Yang F, Li J, Deng H, Wang Y, Lei C, Wang Q, Xiang J, Liang L, Xia J, Pan X et al (2019) GSTZ1‐1 Deficiency activates NRF2/IGF1R axis in HCC VIA accumulation of Oncometabolite Succinylacetone. EMBO J. 38, e101964. [DOI] [PMC free article] [PubMed] [Google Scholar]
- 13. Wang Z, Gerstein M and Snyder M (2009) RNA‐Seq: a revolutionary tool for transcriptomics. Nat Rev Genet 10, 57–63. [DOI] [PMC free article] [PubMed] [Google Scholar]
- 14. Luo J, Deng ZL, Luo X, Tang N, Song WX, Chen J, Sharff KA, Luu HH, Haydon RC, Kinzler KW et al (2007) A protocol for rapid generation of recombinant adenoviruses using the AdEasy system. Nat Protoc 2, 1236–1247. [DOI] [PubMed] [Google Scholar]
- 15. Tuo L, Xiang J, Pan X, Gao Q, Zhang G, Yang Y, Liang L, Xia J, Wang K and Tang N (2018) PCK1 downregulation promotes TXNRD1 expression and hepatoma cell growth via the Nrf2/Keap1 pathway. Front Oncol 8, 611. [DOI] [PMC free article] [PubMed] [Google Scholar]
- 16. Pujana MA, Han JD, Starita LM, Stevens KN, Tewari M, Ahn JS, Rennert G, Moreno V, Kirchhoff T, Gold B et al (2007) Network modeling links breast cancer susceptibility and centrosome dysfunction. Nat Genet 39, 1338–1349. [DOI] [PubMed] [Google Scholar]
- 17. Prieto C, Risueno A, Fontanillo C and De Las Rivas J (2008) Human gene coexpression landscape: confident network derived from tissue transcriptomic profiles. PLoS ONE 3, e3911. [DOI] [PMC free article] [PubMed] [Google Scholar]
- 18. Barabasi AL and Oltvai ZN (2004) Network biology: understanding the cell's functional organization. Nat Rev Genet 5, 101–113. [DOI] [PubMed] [Google Scholar]
- 19. Hu S, Yao G, Wang Y, Xu H, Ji X, He Y, Zhu Q, Chen Z and Sun Y (2014) Transcriptomic changes during the pre‐receptive to receptive transition in human endometrium detected by RNA‐Seq. J Clin Endocrinol Metab 99, E2744–E2753. [DOI] [PubMed] [Google Scholar]
- 20. Ouyang Y, Pan J, Tai Q, Ju J and Wang H (2016) Transcriptomic changes associated with DKK4 overexpression in pancreatic cancer cells detected by RNA‐Seq. Tumor Biol 37, 10827–10838. [DOI] [PubMed] [Google Scholar]
- 21. David CJ and Massague J (2018) Contextual determinants of TGFbeta action in development, immunity and cancer. Nat Rev Mol Cell Biol 19, 419–435. [DOI] [PMC free article] [PubMed] [Google Scholar]
- 22. Perugorria MJ, Olaizola P, Labiano I, Esparza‐Baquer A, Marzioni M, Marin JJG, Bujanda L and Banales JM (2019) Wnt‐beta‐catenin signalling in liver development, health and disease. Nat Rev Gastroenterol Hepatol 16, 121–136. [DOI] [PubMed] [Google Scholar]
- 23. Sade D, Shaham‐Niv S, Arnon ZA, Tavassoly O and Gazit E (2018) Seeding of proteins into amyloid structures by metabolite assemblies may clarify certain unexplained epidemiological associations. Open Biol 8, 170229. [DOI] [PMC free article] [PubMed] [Google Scholar]
- 24. Dorion S, Lambert H and Landry J (2002) Activation of the p38 signaling pathway by heat shock involves the dissociation of glutathione S‐transferase Mu from Ask1. J Biol Chem 277, 30792–30797. [DOI] [PubMed] [Google Scholar]
- 25. Adler V, Yin Z, Fuchs SY, Benezra M, Rosario L, Tew KD, Pincus MR, Sardana M, Henderson CJ, Wolf CR et al (1999) Regulation of JNK signaling by GSTp. EMBO J 18, 1321–1334. [DOI] [PMC free article] [PubMed] [Google Scholar]
- 26. Henderson CJ, Smith AG, Ure J, Brown K, Bacon EJ and Wolf CR (1998) Increased skin tumorigenesis in mice lacking pi class glutathione S‐transferases. Proc Natl Acad Sci USA 95, 5275–5280. [DOI] [PMC free article] [PubMed] [Google Scholar]
- 27. Lim CE, Matthaei KI, Blackburn AC, Davis RP, Dahlstrom JE, Koina ME, Anders MW and Board PG (2004) Mice deficient in glutathione transferase zeta/maleylacetoacetate isomerase exhibit a range of pathological changes and elevated expression of Alpha, Mu, and Pi class glutathione transferases. AJP 165, 679–693. [DOI] [PMC free article] [PubMed] [Google Scholar]
- 28. Stamos JL and Weis WI (2013) The beta‐catenin destruction complex. Cold Spring Harb Perspect Biol 5, a007898. [DOI] [PMC free article] [PubMed] [Google Scholar]
- 29. MacDonald BT, Tamai K and He X (2009) Wnt/beta‐catenin signaling: components, mechanisms, and diseases. Dev Cell 17, 9–26. [DOI] [PMC free article] [PubMed] [Google Scholar]
- 30. Waisberg J and Saba GT (2015) Wnt‐/‐beta‐catenin pathway signaling in human hepatocellular carcinoma. World J Hepatol 7, 2631–2635. [DOI] [PMC free article] [PubMed] [Google Scholar]
- 31. Monga SP (2015) beta‐catenin signaling and roles in liver homeostasis, injury, and tumorigenesis. Gastroenterology 148, 1294–1310. [DOI] [PMC free article] [PubMed] [Google Scholar]
- 32. Blackburn AC, Matthaei KI, Lim C, Taylor MC, Cappello JY, Hayes JD, Anders MW and Board PG (2006) Deficiency of glutathione transferase zeta causes oxidative stress and activation of antioxidant response pathways. Mol Pharmacol 69, 650–657. [DOI] [PubMed] [Google Scholar]
- 33. Korswagen HC (2006) Regulation of the Wnt/beta‐catenin pathway by redox signaling. Dev Cell 10, 687–688. [DOI] [PubMed] [Google Scholar]
- 34. Funato Y, Michiue T, Asashima Mand Miki H (2006) The thioredoxin‐related redox‐regulating protein nucleoredoxin inhibits Wnt–β‐catenin signalling through Dishevelled. Nature Cell 8, 501. [DOI] [PubMed] [Google Scholar]
Associated Data
This section collects any data citations, data availability statements, or supplementary materials included in this article.
Data Availability Statement
The gene expression data have been deposited in the Gene Expression Omnibus (GEO) database under accession number http://www.ncbi.nlm.nih.gov/geo/query/acc.cgi?acc=GSE117822.


