Abstract
Equine influenza is a leading cause for respiratory illness in equines. Major control measures involve vaccination which requires continuous harmonization owing to antigenic drift. The present study focused on assessing the protective efficacy of an inactivated recombinant equine influenza virus (rgEIV) vaccine candidate adjuvanted with MontanideTM Pet Gel in murine model. The rgEIV was generated using reverse genetics by incorporating HA and NA segments from EIV/H3N8, clade 2-Florida sublineage in an A/WSN/33 /H1N1 backbone and inactivated by formalin. The vaccine was prepared by mixing inactivated rgEIV with MontanideTM Pet Gel adjuvant followed by intranasal inoculation into BALB/c mice intranasally. The immune responses and protective efficacy of the vaccine was evaluated by measurement of antibody titer, immunoglobulin subtyping, cytokines, clinical signs and pathological lesions after immunization and challenge with wild EIV. Serology and cytokine expression pattern indicated that the vaccine activated mixed Th1- and Th2-like responses of vaccine. Booster immunization stimulated strong antibody responses (HAI titre: 192 ± 28.6) at 42 days post immunization and the predominant antibody subtype was IgG1. Upregulation of interferon (IFN)-gamma, interleukin (IL)-12 and IL-2 levels indicates effective induction of Th1 type response. We found that vaccination has protected mice against equine influenza virus challenge as adjudged through a lack of nonappearance of visible clinical signs of disease, no loss of body weight loss, reduced pathology in the lungs and markedly reduced virus shedding from the respiratory tract. Therefore, we conclude that recombinant EIV vaccine candidate adjuvanted with MontanideTM Pet Gel could aid in quick harmonization of the vaccines through replacement of HA and NA genes for control of EIV outbreaks.
Keywords: adjuvant, equine influenza, MontanideTM pet gel, reverse genetics, vaccine
Equine influenza virus (EIV), a member of the family Orthomyxoviridae belonging to Influenza A virus genera, is one of the most important respiratory pathogens in horses, which causes huge economic losses in the equine industry worldwide. EIV is endemic in the U.S.A. and Europe and outbreaks also frequently occur in other parts of the world [31]. Similar to other influenza A viruses, EIV has 8 single stranded negative-sense RNA segments and has diverged into two main strains-H7N7 and H3N8; however, the former strain has not been isolated since the 1980’s [32]. Recently, H3N8 strain has been found circulating globally and has evolved into various lineages and sub-lineages. Sub-lineage Florida Clade 1 predominates in United States, while the Florida Clade 2 EIVs have been mainly isolated from Europe and Asia [14]. Like other influenza viruses, the containment measures for EIV infection are centered around controlling the movement of animals and effective vaccination strategies. The inactivated subunit and whole virus vaccines are currently being used for influenza control [19]. To ensure optimum protection efficacy, the vaccine must be frequently harmonized with the currently circulating strain(s) frequently as per the recommendation of the World Organization for Animal Health (OIE) owing to continuous viral antigenic drift [9]. In this context, plasmid-based reverse genetics technology has been exploited for the production of recombinant vaccines through replacement of HA and NA genes corresponding with circulating viruses in the established plasmid backbone [13, 17] (e.g. A/WSN/33 (H1N1)) [3]. This method aids quick vaccine harmonization and has the advantage of fast multiplication of recombinant virus in cell culture/embryonated eggs [17] which saves time and resources. Additionally, adjuvants play a major role in activating immune responses. Switching from conventional adjuvants such as alum to novel adjuvants can aid in long lasting cell mediated immunity (CMI) [22] as well as humoral immune response [4, 7]. The MontanideTM Pet Gel (MPG) (SEPPIC, Paris, France) is a highly stable microspherical polymer [7] which provides depot effect to the antigen and has been used in many vaccine formulations, including vaccines against influenza viruses [6]. Furthermore, MPG adjuvant also has a good safety profile in companion animals including horses [4].
In our study, the rgEIV (H3N8) seed strain was generated earlier through reverse genetic engineering [16] (having HA and NA genes of A/equine/Katra-Jammu/06/08 (H3N8) with the backbone of internal genes from A/WSN/33 (H1N1)) and utilized after formalin inactivation and adjuvanting with MPG. The immunogenicity and protective efficacy of rgEIV as a vaccine candidate was evaluated in BALB/c mice which were challenged with wild virus belonging to same clade as the HA and NA of the recombinant virus. This is the first study to report of a comprehensive study of novel MontanideTM Pet Gel adjuvanted inactivated recombinant EIV vaccine.
MATERIALS AND METHODS
Bio-safety and ethics statements
All animal studies were approved by the Institute Animal Ethical Committee (IAEC) (vide approval no. NRCE/CPCSEA/2017-18, dated: 18.09.2017) and the Institute Bio-safety Committee (vide approval no. NRCE/IBSC/2014/252, dated: 22.09.16) of the ICAR-National Research Center on Equines (NRCE), India. The guidelines as defined by the Committee for the Purpose of Control and Supervision of Experiments on Animals (CPCSEA), Ministry of Environment and Forestry, Government of India were strictly followed for the entire duration of the experiments. The challenge experiments with wild EIV were carried out after housing the mice in micro-ventilator cages in a Bio-safety level-III (BSL-III) facility at the ICAR- NRCE, Hisar, India. Furthermore, the necessary approval from the IAEC was obtained for non-exercising specific procedures to alleviate pain/suffering following EIV challenge in BALB/c mice. For the challenge study, EIV was administered intranasally in mice after intra-peritoneal injection of anesthesia with Xylazine and Ketamine mixture 100 mg/kg (Xylazine and Ketamine). Prior to experiment, mice were acclimatized and were provided feed and water (ad libitum) for the complete period of the study. The bio-hazard materials were safely disposed through the services of a private partner (Synergy Waste Management Pvt Ltd., Hisar, India).
Mice
Four to five-week-old female BALB/c mice (n=162) were procured from the National Institute of Nutrition (Hyderabad) and maintained in micro-ventilator cages in the BSL-III animal facility of the ICAR-NRCE (Hisar, India). Mice were acclimatized and randomly divided into three groups (A, B and C) each with 54 mice.
Viruses
The wild equine influenza virus (A/equine/Katra-Jammu/06/08 (H3N8)), belonging to clade 2 of Florida sublineage, isolated from the 2008–2009 outbreak [31] from horses was propagated in 10-day-old embryonated chicken eggs. The wild EIV was quantified by calculating the 50% egg infective dose (EID50) using the Reed and Munch method [23] which was then used for challenge studies in mice. The rgEIV previously constructed [16] using reverse genetics was used for preparation of our vaccine. The rgEIV was rescued using a 6:2 reverse-genetics system by transfection of co-cultured 293T/MDCK cells with plasmids of HA and NA genes of A/equine/Katra-Jammu/06/08 (H3N8) cloned into a pHW2000 vector and other six internal genes of A/WSN/33 (H1N1) cloned in pHW2000 vector (gifted by St. Jude Children’s Research Hospital, U.S.A.) as described previously [13]. Subsequently, the rgEIV was propagated in 10-day-old embryonated eggs by inoculating seed virus via the allantoic route and incubating for 72 hr at 35–36°C.
Vaccine formulation
The rgEIV was purified using the sucrose gradient centrifugation method with layers of 60, 30, and 15% sucrose solution. The virus pellet was collected from the interface of 30 and 60% sucrose and dissolved in phosphate buffered saline (PBS). The protein in the virus pellet contain was quantified using the Bradford Protein Assay kit (Bio-Rad, Hercules, CA, U.S.A.) according to the manufacturer’s instructions. The diluted rgEIV was inactivated with 0.2% (v/v) formalin for three days at 4°C. The inactivation of the virus was verified by inoculation of inactivated rgEIV preparation in 9–11-day-old embryonated eggs followed by HA assay of the allantoic fluid. Subsequently, the inactivated ultra-purified rgEIV was blended with MPG (gifted by SEPPIC, Paris, France), synthesized by stable dispersion of microspherical particles of sodium polyacrylate in water. The adjuvant was mixed with the antigen (as per manufacturer’s instructions) at a ratio of 10:90 (w:w) and placed on a magnetic stirrer at 10°C until consistent the solution was homogenous.
Immunization and challenge
Prior to vaccination, mice were confirmed as sero-negative by haemagglutination inhibition (HAI) assay. Mice belonging to group A were immunized with the inactivated rgEIV vaccine candidate. Group B were mock vaccinated with PBS and served as the EIV infected unvaccinated control. Group C animals were not given any treatment and served as unimmunized -uninfected control (Table 1). The vaccine dosage −15 µg of viral protein in 200 µl which had been previously standardized for mice on the basis of single radial immunodiffusion (SRD) content, total protein content of virus was utilized in the current study [20, 21]. Group A mice were immunized with the vaccine formulation −15 µg of viral protein in 200 µl intramuscularly on both the flanks on day 0 of the animal experimentation followed by booster doses −15 µg of viral protein on day 21 and 35 post immunization. On day 42 post immunization, groups A and B were challenged with the wild virus (A/equine/Katra-Jammu/06/08 (H3N8)) at 5 × 107.24 EID50 in 30 µl, intranasally. Group C mice served as mock control and were given sterile PBS intranasally on day 42. The mice were observed daily for clinical signs and body weight gain/loss post challenge. Mice (n=6) from each group were euthanized on days 1, 3, 5, 9, 14 and 28 post challenge and the gross pathological changes were observed and scored in situ (where grades 1–3 were given based on area of consolidation, 1 grade for congestion and 1 grade for grey discoloration of the lung). The organs (nasal turbinates, trachea, lungs and spleen) were collected for histopathology (in 10% neutral buffered formalin), virus titration, viral RNA copy number quantification and cytokine estimation studies (tissues were stored in RNAlater, Qiagen, Valencia, CA, U.S.A.). Nasal washings were collected using chilled sterile Hank’s balanced salt solution (HBSS) for virus titration and quantification studies.
Table 1. Experimental design, immunization and challenge schedule.
| Groups | Experimental design | ||||
|---|---|---|---|---|---|
| Immunization schedule | Mice sacrifice schedule (6 mice per group at each interval) | ||||
| Primary immunization (0 day) |
First booster (21st day) |
Second booster (35th day) |
Challenge with EIV (42nd day) |
43rd (1 dpc)−70th day (28 dpc) i.e. 1, 3, 5, 9, 14 & 28 dpc |
|
| Group A (mice, n=54) (Vaccine efficacy testing) |
√ | √ | √ | #, * | * |
| Group B (mice, n=54) (positive control) |
X | X | X | #, * | * |
| Group C (mice, n=54) (Negative control) |
X | X | X | Mock, * | * |
√, vaccinated; X, not vaccinated; #, challenged with wild equine influenza virus (EIV); *, sacrifice of mice.
Haemagglutination inhibition assay
Sera was collected from each mouse before and after immunization and challenge (i.e. days 0, 21, 35, 42, 43, 45, 47, 51, 56 and 70 post immunization). Blood samples were collected from retro orbital plexus after applying intraperitoneal anesthesia to each mouse using xylazine (10 mg) and ketamine (50 mg) at 100 kg/bwt. The collected sera were pooled for each group in individual interval and an HAI test was carried out following international protocols [18]. The non-specific haemagglutinins from test sera were removed by treatment with 0.016 M potassium periodate and excess periodate in the serum was neutralized by 3% glycerol. The pre-treated and heat inactivated (56°C for 30 min) serum was used for HAI assays using 4 HA units of ether treated EIV (A/equine/Katra-Jammu/06/08 (H3N8)).
Serum antibody isotyping
The various antibody subtypes viz., IgG1, IgG2a, IgG2b, IgG3, IgM and IgA against EIV were estimated by indirect enzyme-linked immunosorbent assay (ELISA) using mouse monoclonal antibody isotyping reagents –ISO2 (Sigma Aldrich). Briefly, the ELISA plates -Nunc MaxiSorp (Thermo Fisher Scientific, MA, U.S.A.) were coated overnight with H3N8 EIV- A/equine/Katra-Jammu/06/08 at 4°C and then blocked with 7.5% skim milk. The test sera were diluted and added to wells in duplicate (two-fold dilution from 1:500 onwards) and incubated at 37°C for 1 hr. The wells were washed with PBS supplemented with 0.05% Tween-20. Isotype-specific reagents (1:1,000 dilution in PBS) were added followed by incubation at 37°C for 1 hr. Subsequently, the rabbit anti-goat IgG (1:30,000) labeled with peroxidase was added to all wells and detected by 3,3′, 5,5′ tetramethylbenzidine substrate. The plates were read for absorbance at 450 nm in an ELISA plate reader. The isotype titer was expressed as log10 value of highest dilution of serum at which the absorbance was equal or greater than twice the baseline value of the negative control.
Quantification of mRNA expression of cytokines genes by qRT-PCR
The total RNA was purified from homogenates of 25 mg tissue samples (spleen and lungs) stored in RNAlater solution (Qiagen) using the RNAeasy mini kit (Qiagen) following manufacturer’s instructions. The purified RNA was reverse transcribed to synthesize complementary DNA (cDNA) using the High Capacity cDNA Reverse Transcriptase Kit (# Cat no.4368814, Applied Biosystems, Foster City, CA, U.S.A.) using random primer as per the manufacturer’s instruction. The reaction mixture (25 µl) was prepared with 1 µg RNA, 10× RT buffer, 0.8 µl 25× dNTP (100 mM), 2.0 µl 10× random primer, 0.5 µl RNase Inhibitor and 1.0 µl MultiScribe Reverse Transcriptase (50 U/µl). The cytokine gene(s) expressions were measured using TaqMan Cytokine Gene Expression kits (interferon (IFN)-gamma: Mm01168134_m1; interleukin (IL)-2: Mm00434256_m1; IL-12 alpha: Mm00434169_m1; IL-12 beta: Mm01288989_m1; IL-4: Mm00445259_m1; IL-6: Mm00446190_m1; IL-10: Mm01288386_m1; tumor necrosis factor (TNF) alpha: Mm00443258_m1 and GAPDH: 99999915_g1; Applied Biosystems) in a real-time PCR system (StepOne, Applied Biosystems) using comparative Ct method and Sequence Detection software v.1.2.2 (Applied Biosystems). The housekeeping glyceraldehyde 3-phosphate dehydrogenase (GAPDH) gene was included for normalization of the expression of cytokine genes. The mRNA expression level was determined as a fold increase given by the formula: Fold change=2-ΔΔCT where, ΔCT is the difference in threshold cycles for the target and the endogenous control and ΔΔCt=((Ct of target gene in treatment sample)−(Ct of GAPDH in treatment sample))−((Ct of target gene in control sample)−(Ct of GAPDH in control sample)). The −ΔΔCT is the difference between ΔCt values for immunized/challenged and control group. The IFN gamma (IFN-G) mRNA expression was estimated before vaccination [21, 35 and 42 days post immunization (dpi)] and after challenge [3, 5, 9 and 14 days post challenge (dpc)]. Other cytokines viz., IL-2, IL-12 alpha, IL-12 beta, IL-4, IL-6, IL-10 and TNF alpha mRNA expressions were estimated on 42 dpi and after challenge (3, 5, 9 and 14 dpc). The expression of cytokine genes is represented as the mean fold change.
Histopathological studies
Following fixation of tissues with 10% phosphate buffer formalin for 72 hr at room temperature, the tissues were processed by conventional methods for dehydration with ascending grades of alcohol followed by subsequent clearing with benzene, embedding in paraffin and sectioning (3–4 µm) thickness with a microtome. The sections were stained by hematoxylin and eosin (H&E) staining and examined under a microscope (Nikon model-80i). Grading of scores was done for 6 parameters: 1. Cellular infiltration, 2. Interstitial lesions, 3. Perivascular and peribronchial infiltration, 4. Necrotic changes, 5. Bronchial lesions and 6. Total histopathological score. Grades of 0 to 5 were given for each of the parameters with 0 indicating no pathological change while 5 indicating severe histopathological changes as described in our previous studies [20, 21].
Virus titration studies
The lung tissues and nasal washings were clarified in sterile PBS, freeze-thawed once after which each sample was serially diluted ten-fold in PBS. Subsequently, 100 µl of each dilution was inoculated into the allantoic cavity of 10-day-old embryonated eggs in triplicates. The embryonated chicken eggs were incubated for 72 hr at 37°C after which an HA assay was performed on the harvested allantoic fluid and virus titers were calculated using the Reed and Muench method [23]. The titers were finally expressed as log10 EID50/ml.
Virus quantification studies by TaqMan qRT-PCR
The EIV RNA was isolated from stock virus, lung homogenate and tracheal washing of various groups of mice at various time points (1, 3, 5, 9, 14 and 28 dpi) using the QIAamp® Viral RNA Mini kit (Qiagen) as per the manufacturer’s instructions. The quality and quantity of the purified RNA was determined by Nanodrop and stored at −80°C for further analysis by qRT-PCR. The qRT-PCR assay was carried out using primers targeting nucleoprotein (NP) gene, TaqMan probe, standards and TaqMan Fast Virus 1-Step Master Mix (Applied Biosystems) for quantification of virus copy numbers [20].
Statistical analysis
All the data were graphed and statistically analyzed using GraphPad PRISM. A two-way analysis of variance (ANOVA) by Bonferroni post-hoc test was used to compare mean values by row. Any value of P<0.05 was considered to be statistically significant.
RESULTS
Clinical signs and body weight analysis
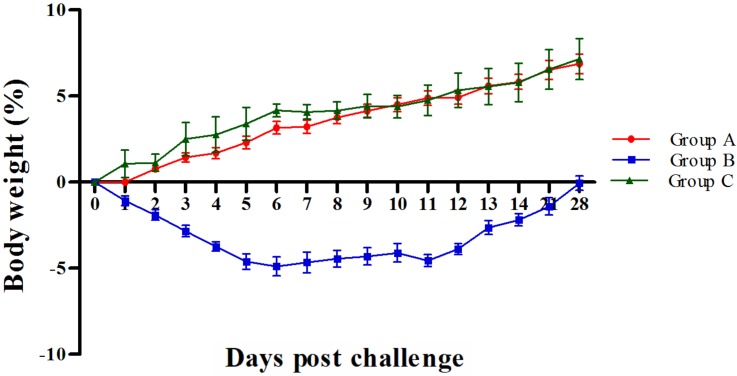
Subsequent to challenge with wild virus, only group B mice showed marked changes in behavior and clinical signs of disease viz. ruffled coat appearance, inappetence, reduced self-grooming, isolation of mice in corners in a crouching position, malaise, lethargy and dyspnoea. The clinical signs were observed between 3 to 9 dpc at decreasing intensity. Group A and C mice appeared to be normal. None of the mice from any of the groups died. The body weight loss was positively correlated with clinical signs as group B showed loss in body weight upto 8 dpc, with maximum body weight loss observed at 6 dpc (−4.89% ± 0.45) (Fig. 1). Groups A and C did not show any loss in body weight and had almost similar trends in increasing body weight (Fig. 1).
Fig. 1.
Mean percent changes in body weight challenged with equine influenza virus (EIV).
Humoral immune response induced by vaccine
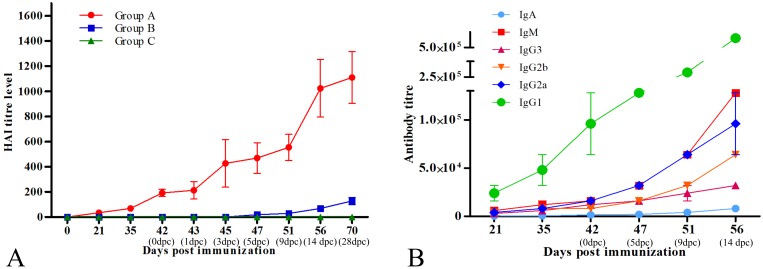
An HAI assay determined that all the mice were seronegative to EIV prior to immunization. At 21 dp), group A mice showed marked sero-conversion (34.67 ± 6.42). The titers observed after the 1st and 2nd booster (35 dpi and 42 dpi, respectively) were 69.33 ± 12.84 and 192 ± 28.62, respectively (Fig. 2A). Group B and C mice remained seronegative during this period. After challenge with wild EIV, there was a marked increase in the HAI titres of group A mice as compared to group B mice. At 3 dpc, group A mice had significantly higher (P<0.01) titers of 426.67 ± 188.89, when compared to the negligible titers in group B (1.33 ± 1.33) and higher titers (P<0.01) were maintained until the end of the experiment in group A (Fig. 2A). Group C mice continued to be seronegative for the entire duration of the experiment.
Fig. 2.
Immune response generated by vaccine. A: Humoral immune response by haemagglutination inhibition (HAI) assay for pre and post challenged mice. B: Serum antibody subclass response in group A mice.
Antibody sub-classes generated in response to immunization and challenge
The immune response was characterized by evaluation of subclass switching of immunoglobulins by isotyping ELISA. The primary immunization stimulated production of various antibody sub-classes including IgG1, IgG2a, IgG2b, IgG3, IgM and IgA in the serum. The mean antibody titers observed at 42 dpi (96,000 ± 32,000; 16,000 ± 0; 8,000 ± 0; 12,000 ± 400; 16,000 ± 0 and 1,500 ± 500, respectively for IgG1, IgG2a, IgG2b, IgG3, IgM and IgA) are shown in Fig. 2B. The significantly higher (P>0.05) titers of all antibody subclasses were observed in immunized mice (group A) following challenge with wild H3N8 EIV at 3 dpc onwards and recorded peak levels (titers–512,000± 0; 96,000 ± 32,000; 64,000 ± 0; 32,000 ± 0; 128,000± 0 and 8,000 ± 0 for IgG1, IgG2a, IgG2b, IgG3, IgM and IgA, respectively) at 14 dpc.
Cytokine responses to vaccine
The expressions of mRNA transcripts of various cytokines were evaluated upon immunization followed by challenge with wild EIV (Fig. 3). The booster immunization with MPG adjuvanted vaccine (group A mice) stimulated higher mRNA expression (P<0.001) of IFN-G (~434 fold), IL-4 (~7 fold), IL-12 alpha (~4 fold), IL-12 beta (~4 fold), IL-6 (~2 fold), IL-10 (~2 fold) and TNF alpha (1 fold) in spleen at 42 dpi (Fig. 3A and 3C). In the lungs, increased expression levels of IL-6 (~15 folds), TNF alpha (~3 folds), IL-4 (2 folds) and IL-10 (~1 fold) were observed in group A mice upon immunization (Fig. 3B). The expression pattern of cytokines changed following challenge with wild EIV, where a significant (P<0.001) increased in the mRNA expression of IL-4 (~18 fold), IL-6 (~5 fold) and IL-10 (~5 fold), IL-2 (~2 fold) and TNF alpha (2 fold) were found in spleen at 3 dpc (45 dpi) (Fig. 3C). However, IFN-G level (163 fold) decreased at 3 dpc in the spleen (Fig. 3A). Furthermore, we detected a significant increase in the mRNA expression of IFN-G (455 fold), IL-4 (~25 fold) and IL-6 (~6 fold) were observed in lungs of group A mice at 3 dpc (Fig. 3C). A varied level of expression of different cytokines was also observed in subsequent days after challenge (Fig. 3).
Fig. 3.
Cytokine profiling through relative quantification of gene expression in the spleen and lungs of immunized animals. A: Mean fold changes in expression of interferon (IFN)-G in the spleen and lungs. B: Mean fold changes in expression of interleukin (IL)-2, IL-4, IL-6, IL-10, IL-12α, IL-12β and tumor necrosis factor (TNF)-α in spleen of immunized challenged mice. C: Mean fold changes in expression of IL-2, IL-4, IL-6, IL-10, IL-12α, IL-12β and TNF-α in the lung of immunized challenged mice. Each value represents mean ± SEM (n=5).
Gross pathological changes
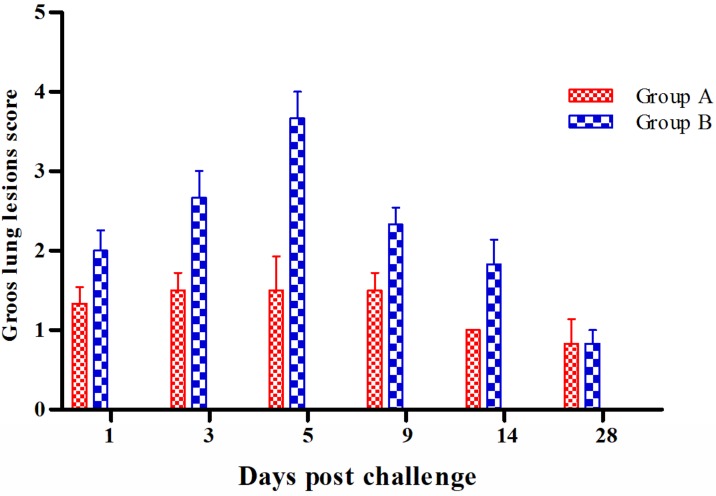
Characteristic gross changes were noted only in the lungs. Group B mice showed much more marked changes compared to group A and the lesions could be described as moderate to severe congestion at 1 dpc, and red hepatization at 3 dpc which turned into grey coloured hepatization on 5 dpc with larger areas of consolidation (up to 6 × 5 mm) (Fig. 4). At 9 dpc, consolidation had been limited to small foci in apical and middle lobe and by 14 dpc, the lungs were mild to moderately congested. Lungs showed nearly normal texture and appearance by 28 dpc. In group A mice congestion seemed to be the only characteristic change up to 5 dpc after which the lungs regained their normal texture. Scoring of the lesions revealed that at all intervals mice from group B had the highest score with a peak at 5 dpc (3.67 ± 0.33), and the highest significant difference in scores on 3 dpc (P<0.001) (Fig. 4).
Fig. 4.
Mean gross lung lesion scores of group A and B at different intervals after challenge with equine influenza virus (EIV). Each value represents mean ± SEM (n=5).
Histopathology
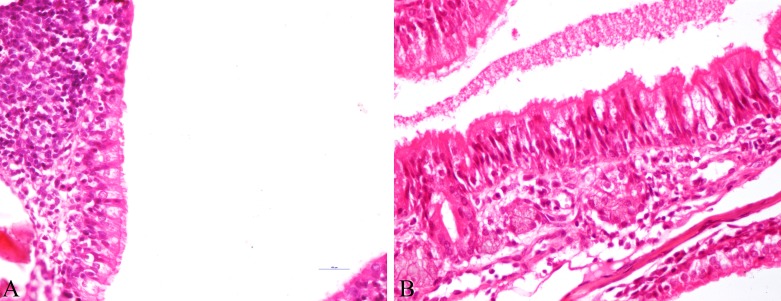
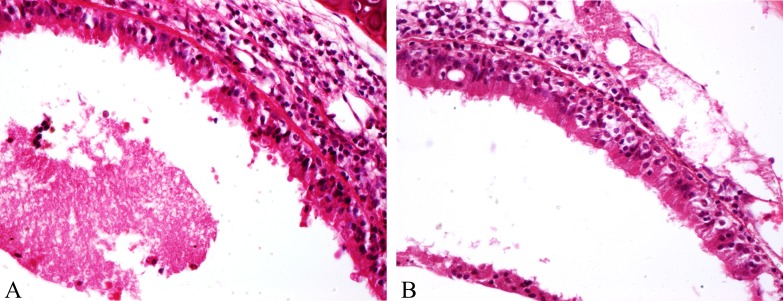
In the nasal turbinates of mice, histopathological lesions could be observed from 1 dpc onwards, in both groups A and B, albeit less severe in group A. The lesions in group A started with deciliation of epithelial lining with goblet cell hyperplasia and mucous accumulation in the lumen while group B also had impaction of submucosal lumens with necrotic debris and inflammatory cells. At 3 and 5 dpc, group B mice showed severe degeneration and vacuolation of epithelium, with its subsequent desquamation into the lumen and conglomeration with mucous and inflammatory cells (Fig. 5A) whereas, group A animals had mild infiltration of neutrophils at 3 dpc (Fig. 5B), and the lesions were resolved by 5 dpc. No histopathological changes were observed in the nasal turbinate 9 dpc onwards in group B animals as well. Lesions in the trachea showed almost the same trend with the presence of desquamated epithelial cells along with inflammatory cells predominantly macrophages and lymphocytes in the lumen of group B animals at 3 and 5 dpc (Fig. 6A) and squamous metaplasia of tracheal epithelium by 9 dpc. The intensity of lesions in respect of infiltration and damage to epithelial lining was far less in group B mice (Fig. 6B) with no appreciable changes from 9 dpc onwards.
Fig. 5.
Protection of lesions in recombinant equine influenza virus (rgEIV) immunized BALB/c mice against equine influenza virus (EIV) challenge. A: Group A-Nasal turbinates showing intact epithelial cells, along with deciliation and submucosal infiltration of inflammatory cells at 3 dpc (H&E × 400). B: Group-Nasal turbinates showing degeneration of epithelium, loss of cilia, infiltration of inflammatory cells in submucosa with goblet cell hyperplasia and mucous accumulation in lumen at 3 dpc (H&E × 400).
Fig. 6.
Protection conferred by recombinant equine influenza virus (rgEIV) immunization in BALB/c mice against equine influenza virus (EIV) challenge. A: Group A-Trachea showing mild degeneration of epithelial cells, accumulation of inflammatory cells in lamina propria, with mucous in lumen and hyperplasia of goblet cells at 3 dpc (H&E × 400). B: Group B-Trachea showing severe necrosis of epithelial cells along with mucous accumulation in lumen at 3 dpc (H&E × 400).
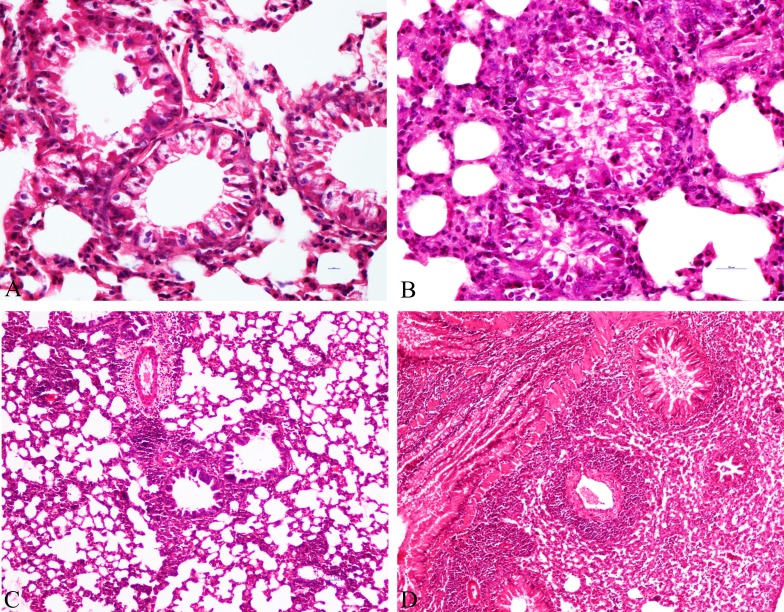
Overall maximum lesions were observed in the lungs and they were also scored for objective quantification. The lesions in the control group mice (group B) which started with congestion of blood vessels, bronchiolar epithelium necrosis and mild neutrophilic infiltration at 1 dpc progressed to histiocytic alveolitis along with infiltration of mainly lymphocytes and macrophages as well as with neutrophils and necrotizing bronchitis at 3 dpc (Fig. 7B), which further progressed to peribronchiolar and perivascular pneumonitis along with the collapse of the alveolar space with marked thickening of alveolar septa caused mainly by extravasation of lymphoplasmacytic infiltrations into alveolar spaces on 5 dpc (Fig. 7D), while, proliferation of type II pneumocytes and denuding bronchiolitis were a characteristic finding on 9 dpc. Similar changes regarding organization of the diffused alveolar damage and squamous metaplasia of bronchial epithelial cells were discernible at 14 dpc with continuation of proliferation of type II pneumocytes. None of the mice showed any specific lesions at 28 dpc.
Fig. 7.
Protection conferred by recombinant equine influenza virus (rgEIV) immunization from lung histopathology in BALB/c mice after challenge with equine influenza virus (EIV) (H3N8). A: Lung-Group A mice on 3 dpc showed goblet cell hyperplasia along with denudation of epithelial cells into lumen (H&E × 400). B: Lung-Group B mice on 3 dpc showing severe necrotizing erosive bronchiolitis with heavy accumulation of mucous admixed with inflammatory cells and thickening of alveolar septa (H&E × 400). C: Lungs-Group A mice on 5 dpc showing mild cellular infiltrations along with evident perivascular and peribronchial cuffing (H&E × 400). D: Group B mice on 5 dpc showing high degree of cellular infiltrations along with severe consolidation and very much evident perivascular and peribronchial cuffing (H&E × 400).
In comparison, vaccinated animals (Group A) showed markedly fewer lesions with generalized congestion as the only consistent finding at 1 dpc. At 3 dpc mild bronchiolar degeneration, goblet cell hyperplasia and mild diffused infiltration of lymphocytes, neutrophils and macrophages (Fig. 7A) was observed. At 5 dpc the lesions included diffused mild infiltration of lymphocytes, edema around blood vessels along with perivascular and peribronchial cuffing (Fig. 7C) which was much less intensity as compared to group B animals. By 9 dpc the mice had nearly regained normal histology barring mild bronchial degeneration and mild focal lymphocytic infiltration. By 14 dpc, the lung histology was back to normal.
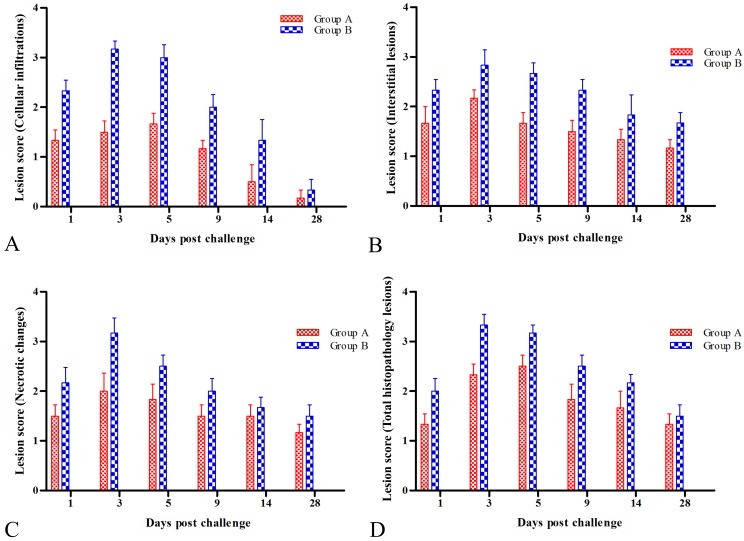
Our findings were substantiated with histopathological scoring for all the lesions where barring perivascular and peribronchial cuffing, for all parameters mice from the group A had significant (P<0.05) to highly significant (P<0.001) reduction in lesion scores compared to group B at 1, 3, 5 and 9 dpc (Fig. 8, Table 2). In terms of cellular infiltration, group B had the highest mean score of 3.17 ± 0.31 at 3 dpc compared to 1.5 ± 0.34 in group A mice (Fig. 8A, Table 2). In terms of interstitial lesions, Group A had much lower scores than group B on 3 and 5 dpc (P<0.01) and continued to remain significant on 9 and 14 dpc (P<0.05) (Fig. 8B, Table 2). With respect to necrotic changes, group B scores were very significantly higher (P<0.001) compared to group A mice at 3 dpc (Fig. 8C, Table 2). In terms of bronchial lesions, group B mice showed the highest overall score with a peak of 3.33 ± 0.21 at 3 dpc and mice from the vaccinated group (A) showed significantly lower scores (P<0.001) on 3 and 5 dpc (Fig. 8D, Table 2).
Fig. 8.
Overall histopathological scoring for all the lesions. A: Histopathological lesion scores for cellular infiltrations in lungs. B: Histopathological lesion scores for interstitial lesions in lungs. C: Histopathological lesion scores for necrotic changes in lungs. D: Total histopathological lesion score in lungs
Table 2. Histopathological lung lesion scores at different intervals in group A and B mice after challenge with wild H3N8 equine influenza virus.
| Days post challenge | Cellular infiltrations | Interstitial lesions | Necrotic changes | Total histopathological lesion | ||||
|---|---|---|---|---|---|---|---|---|
| Group A | Group B | Group A | Group B | Group A | Group B | Group A | Group B | |
| 1 | 1.17 ± 0.31c) | 2.33 ± 0.21 | 1 ± 0.25 | 1.83 ± 0.31 | 0.17 ± 0.17b) | 1.67 ± 0.42 | 1.33 ± 0.21c) | 2.33 ± 0.21 |
| 3 | 1.5 ± 0.34b) | 2.83 ± 0.31 | 1.5 ± 0.34a) | 3.17 ± 0.31 | 0.67 ± 0.49a) | 3 ± 0.26 | 1.5 ± 0.22a) | 3.17 ± 0.17 |
| 5 | 1.67 ± 0.22 | 2.67 ± 0.22 | 1.33 ± 0.21b) | 2.83 ± 0.17 | 0.67 ± 0.42 | 1.67 ± 0.56 | 1.67 ± 0.21a) | 3 ± 0.26 |
| 9 | 1.17 ± 0.31c) | 2.33 ± 0.21 | 1.17 ± 0.31c) | 2.5 ± 0.43 | 0.33 ± 0.21 | 1.17 ± 0.54 | 1.17 ± 0.17 | 2 ± 0.26 |
| 14 | 0.83 ± 0.17 | 1.83 ± 0.40 | 0.17 ± 0.17c) | 1.67 ± 0.49 | 0.17 ± 0.17 | 0.5 ± 0.34 | 0.5 ± 0.34 | 1.33 ± 0.42 |
| 28 | 0.83 ± 0.17 | 1 ± 0.37 | 0 ± 0 | 0.33 ± 0.21 | 0 ± 0 | 0 ± 0 | 0.17 ± 0.17 | 0.33 ± 0.21 |
Each value represents mean ± SEM (n=6). a) Indicates significant difference P<0.001, b) P<0.01, c) P<0.05, between groups in the same row in two way ANOVA, Bonnferoni post hoc test.
Vaccine reduced virus shedding and replication
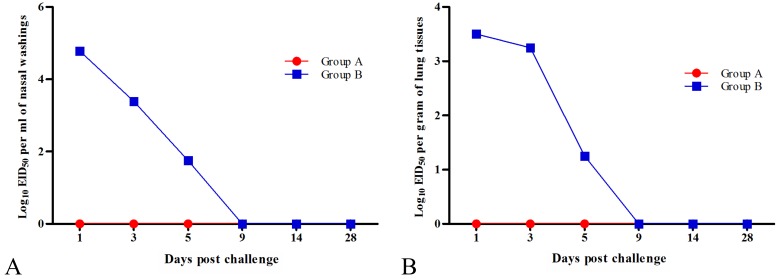
Group B mice showed the highest virus shedding from tracheal washings as well as residual virus load on 1 dpc with a titre of 104.78EID50/ml in nasal washings (Fig. 9A) and 103.50EID50/25 mg from lung tissue (Fig. 9B). The virus titer was observed until 5 dpc (101.75EID50/ml for nasal washings and 101.25 EID50/25 mg for lung tissue) with decreasing trends. No virus shedding was detected in group A or C at any of the time points.
Fig. 9.
Equine influenza virus (EIV) titers (Log10 Mean EID50) in nasal washing and lungs after EIV challenge. A: Residual EIV titer in nasal washings at various intervals after challenge. B: Residual EIV titer lungs at various intervals after challenge.
The virus titration studies were validated by quantification of viral RNA copy numbers. Mice from group B showed mean copy numbers at 1, 3 and 5 dpc in both nasal washings 11,580.6 ± 2,564.7; 9,896.5 ± 2,376.8 and 1,787.3 ± 102.2, respectively and lung tissues 14,196 ± 3,452.8; 10,452 ± 2,134.8 and 6,865 ± 765.2, respectively, which were significantly higher (P<0.001) than group A (Table 3). Amongst group A animals, higher numbers were observed at 3 dpc (1,054.8 ± 87.8) as compared to 1 dpc (514.5 ± 43.8) in the nasal washings while the copy numbers in the lungs followed the declining pattern from 1 dpc (5,212 ± 567.8) to 3 dpc (653 ± 156.7) (Table 3).
Table 3. Equine influenza virus (EIV) shedding in nasal washings/lungs of group A and group B mice after challenge.
| Days post challenge | Nasal washings | Lung tissues | ||||||
|---|---|---|---|---|---|---|---|---|
| EIV viral RNA copy numbers | Ct values | EIV viral RNA copy numbers | Ct values | |||||
| Group A | Group B | Group A | Group B | Group A | Group B | Group A | Group B | |
| 1 | 514.5 ± 43.8a) | 11,580.6 ± 2,564.7 | 33.0 ± 0.94a) | 23.76 ± 0.58 | 5,212 ± 567.8a) | 14,196 ± 3,452.8 | 30.4 ± 0.43a) | 22.5 ± 0.34 |
| 3 | 1,054.8 ± 87.8a) | 9,896.5 ± 2,376.8 | 32.9 ± 1.1a) | 25 ± 0.34 | 653 ± 156.7a) | 10,452 ± 2,134.8 | 34.7 ± 0.98a) | 25.7 ± 0.73 |
| 5 | 6.1 ± 0.3 | 1,787.3 ± 102.2 | 36. 43 ± 0.76a) | 32 ± 1.04 | – | 6,865 ± 765.2 | – | 29 ± 0.16 |
| 9 | – | 7.9 ± 0.3 | – | 36.21 ± 1.2 | – | 963 ± 45.5 | – | 33.5 ± 0.45 |
| 14 | – | 3.3 ± 0.2 | – | 38.54 ± 0.86 | – | – | – | – |
| 28 | – | – | – | – | – | – | – | – |
Each value represents mean ± SEM (n=6). Significant difference indicated as a) P<0.001 when groups are compared with group C in the same row using two way ANOVA, Bonferroni post hoc test. (−) indicates not detected.
DISCUSSION
The use of vaccines against Influenza is always a challenge as continuous antigenic drift and shift requires regular harmonization of virus strain. The present study aimed to investigate the immunogenicity and protective efficacy of an inactivated recombinant EIV (H3N8) seed strain generated by reverse genetics for quick vaccine harmonization. The vaccine candidate was adjuvanted with MPG to improve immune responses. The HA and NA segments in the constructed virus belonged to Clade 2 of EIV which is one of the OIE recommended EIV strains for vaccination. The rgEIV vaccine candidate stimulated a strong antibody response in group A mice with an HAI titers of 192 ± 28.62, at 42 dpi which is 3 times the recommended seroprotective HAI titres established by the OIE [18]. Therefore, we have shown that rgEIV with backbone of WSN/33 (H1N1) provides adequate stimulation of immune responses indicated through HAI antibody titers as has also been documented by Bhatia et al. [3] in chicken immunized with rgH5N2 and challenge with HPAI (H5N1). The rgEIV vaccine candidate also induced higher antibody response as compared to the aluminum hydroxide (Alum) adjuvanted inactivated whole EIV (H3N8) vaccine which generated an HAI titer of 138.67 ± 22.69 in mice at 42 dpi [21]. The antibody response in infection control mice (group B) was lower with an HAI titer of 18.67 ± 4.46 at 5 dpc which increased to 69.33 ± 12.84 at 14 dpc. Almost similar serological response was also found in previous studies [21]. The MPG adjuvant has been shown to influence the increase in antibody response of inactivated Rhodococcus equi vaccine in horses without any adverse effect [7]. Recent studies investigating a vaccine against Sporothrix schenckii observed significantly higher antibody production in mice immunized with MPG adjuvanted cell wall protein or recombinant enolase protein [22, 29]. Cytokine profiling showed a surge in IFN-G , IL-2, IL-4, IL-6, IL-10 and IL-12 levels in the mice immunized with the vaccine candidate indicating stimulation of mixed Th1 and Th2 responses. Immunoglobulin isotyping revealed a prevalence of IgG1 and IgG2a antibodies. The murine IgG1 and IgG2a subtypes have been shown to be major antibody subtype responsible for upregulating the antibody response via-Fc receptors [11, 25] and protection against various viruses [1]. The stimulation of Th1-like cytokines by Montanide has been shown to increase the production of IgG2a which is mainly associated with Th1-like immune response [10, 15]. Moreover, IL-6 plays an important role in antibody production by B cells through induction of IL-21 production from CD4+ T cells [8] and in antigen-specific IgG subclass switching [27].
Increased expression of IFN-G was observed in splenocytes throughout the immunization period which is indicative of priming of the cellular immune system. MPG has been documented to stimulate production of IFN-G and IL-12 in mice [22]. The upregulation of expression of IFN-G, IL-12 and IL-2 (only in mice post challenge) suggests the effective induction of the Th1 type immune response, which is primarily essential for activation of macrophages, natural killer cells and cytotoxic cells for virus clearance [24, 30]. Moreover, IL-12 has also been shown to play an important role in the proliferation of CD8 cells and cytolytic response against influenza [2]. The current vaccine candidate stimulated production of cytokines which lead to cellular immune response-however aluminum hydroxide adjuvanted vaccines are unable to induce such immune response [19]. The appropriate stimulation of immunity was reflected through challenge studies where immunized mice (group A) showed lower virus titers/copy number which also correlated well with protection from loss in body weight, no clinical symptoms and less gross and histopathological changes in target organs. This coincides with other vaccine studies that showed good protective efficacy [5]. Group B had very high copy numbers in the nasal washings on 1 and 3 dpc which correlated with lesions in trachea and turbinates (deciliation, desquamation of epithelium and presence of inflammatory cells in the lumen) that reached their maximum upto 3 dpc, while viral residual titer numbers which were detectable upto 5 dpc in the lungs relate with lesions (necrotizing erosive bronchiolitis and alveolitis) that were seen in maximum intensity upto 5 dpc in the lungs. Pavulraj et al. [21] also had analogous EID50 values in nasal washings in the unimmunized group while a very low titer shedding of virus was observed on 1 dpc with in mice challenged with the H3N8 virus subsequent to immunization with inactivated virus adjuvanted with alum. Svitek et al. [26] showed reduced viral load in nasal washes from 1 dpc onward before disappearing altogether on 6 dpc in ferrets challenged with H1N1 and H3N2 virus. The group A mice had significantly lower virus quantity as estimated through EIV RNA copy numbers in both lungs and nasal washings at 1 dpc in comparison to 3 dpc with no detection of virus in titration studies which indicates higher shedding of residual viral RNA than group B. Earlier studies on various Influenza A viruses viz. H3N8 in BALB/c mice [20, 21], H3N2 virus in ferrets [12] and H9N2 in broiler chickens [28] had similar findings.
Thus, it can be concluded from the present study that our recombinant equine influenza virus vaccine candidate adjuvanted with MonatanideTM Pet Gel stimulated both Th1 and Th2 mediated immune responses and conferred good protection against equine influenza virus as determined through a lack of visible clinical signs of disease, prevention of body weight loss, reduced pathology in lungs and markedly reduced virus shedding from respiratory tract. This can aid in quick harmonization of the vaccines through replacement of HA and NA genes and help as an exigency measure for control of EIV outbreaks.
CONFLICT OF INTEREST
The authors declare that there is no competing conflict of interests.
Acknowledgments
We thank SEPPIC (Paris, France) for providing the MontanideTM Pet Gel and St. Jude Children’s Research Hospital, U.S.A. for providing cloned plasmid backbone of A/WSN/33 (H1N1) used for generating recombinant EIV included in the present study. This work was supported by the ICAR-National Research Centre on Equines from institute budget. We would like to thank Mukesh Chand and Subhash Chander for their technical support and for their help with the animal experiments.
References
- 1.Benne C. A., Harmsen M., van der Graaff W., Verheul A. F., Snippe H., Kraaijeveld C. A.1997. Influenza virus neutralizing antibodies and IgG isotype profiles after immunization of mice with influenza A subunit vaccine using various adjuvants. Vaccine 15: 1039–1044. doi: 10.1016/S0264-410X(96)00287-3 [DOI] [PubMed] [Google Scholar]
- 2.Bhardwaj N., Seder R. A., Reddy A., Feldman M. V.1996. IL-12 in conjunction with dendritic cells enhances antiviral CD8+ CTL responses in vitro. J. Clin. Invest. 98: 715–722. doi: 10.1172/JCI118843 [DOI] [PMC free article] [PubMed] [Google Scholar]
- 3.Bhatia S., Khandia R., Sood R., Bhat S., Siddiqui A., Jahagirdhar G., Mishra S., Mishra A., Pateriya A. K., Kulkarni D. D.2016. Reverse genetics based rgH5N2 vaccine provides protection against high dose challenge of H5N1 avian influenza virus in chicken. Microb. Pathog. 97: 172–177. doi: 10.1016/j.micpath.2016.06.011 [DOI] [PubMed] [Google Scholar]
- 4.Cauchard S., Bertrand F., Barrier-Battut I., Jacquet S., Laurentie M., Barbey C., Laugier C., Deville S., Cauchard J.2014. Assessment of the safety and immunogenicity of Rhodococcus equi-secreted proteins combined with either a liquid nanoparticle (IMS 3012) or a polymeric (PET GEL A) water-based adjuvant in adult horses and foals—identification of promising new candidate antigens. Vet. Immunol. Immunopathol. 157: 164–174. doi: 10.1016/j.vetimm.2013.12.003 [DOI] [PubMed] [Google Scholar]
- 5.de Wit E., Munster V. J., Spronken M. I., Bestebroer T. M., Baas C., Beyer W. E., Rimmelzwaan G. F., Osterhaus A. D., Fouchier R. A.2005. Protection of mice against lethal infection with highly pathogenic H7N7 influenza A virus by using a recombinant low-pathogenicity vaccine strain. J. Virol. 79: 12401–12407. doi: 10.1128/JVI.79.19.12401-12407.2005 [DOI] [PMC free article] [PubMed] [Google Scholar]
- 6.Deville S., Parker R., Laval A.2008. Adjuvant formulation for Influenza H1N1and H3N2 pig vaccines: Montanide Gel safety and efficacy study. Proceedings of the Conference of Research of Workers in Animal Diseases, Chicago.
- 7.Deville S., Carneaux E., Bertrand F., Cauchard S., Cauchard J., Dupuis L.2011. Adjuvant formulation for companion animals vaccines. Procedia Vaccinol. 4: 104–112. doi: 10.1016/j.provac.2011.07.015 [DOI] [Google Scholar]
- 8.Dienz O., Eaton S. M., Bond J. P., Neveu W., Moquin D., Noubade R., Briso E. M., Charland C., Leonard W. J., Ciliberto G., Teuscher C., Haynes L., Rincon M.2009. The induction of antibody production by IL-6 is indirectly mediated by IL-21 produced by CD4+ T cells. J. Exp. Med. 206: 69–78. doi: 10.1084/jem.20081571 [DOI] [PMC free article] [PubMed] [Google Scholar]
- 9.Elton D., Cullinane A.2013. Equine influenza: antigenic drift and implications for vaccines. Equine Vet. J. 45: 768–769. doi: 10.1111/evj.12148 [DOI] [PubMed] [Google Scholar]
- 10.Germann T., Bongartz M., Dlugonska H., Hess H., Schmitt E., Kolbe L., Kölsch E., Podlaski F. J., Gately M. K., Rüde E.1995. Interleukin-12 profoundly up-regulates the synthesis of antigen-specific complement-fixing IgG2a, IgG2b and IgG3 antibody subclasses in vivo. Eur. J. Immunol. 25: 823–829. doi: 10.1002/eji.1830250329 [DOI] [PubMed] [Google Scholar]
- 11.Getahun A., Dahlström J., Wernersson S., Heyman B.2004. IgG2a-mediated enhancement of antibody and T cell responses and its relation to inhibitory and activating Fc γ receptors. J. Immunol. 172: 5269–5276. doi: 10.4049/jimmunol.172.9.5269 [DOI] [PubMed] [Google Scholar]
- 12.Gustin K. M., Belser J. A., Wadford D. A., Pearce M. B., Katz J. M., Tumpey T. M., Maines T. R.2011. Influenza virus aerosol exposure and analytical system for ferrets. Proc. Natl. Acad. Sci. U.S.A. 108: 8432–8437. doi: 10.1073/pnas.1100768108 [DOI] [PMC free article] [PubMed] [Google Scholar]
- 13.Hoffmann E., Neumann G., Kawaoka Y., Hobom G., Webster R. G.2000. A DNA transfection system for generation of influenza A virus from eight plasmids. Proc. Natl. Acad. Sci. U.S.A. 97: 6108–6113. doi: 10.1073/pnas.100133697 [DOI] [PMC free article] [PubMed] [Google Scholar]
- 14.Lai A. C., Chambers T. M., Holland R. E., Jr, Morley P. S., Haines D. M., Townsend H. G., Barrandeguy M.2001. Diverged evolution of recent equine-2 influenza (H3N8) viruses in the Western Hemisphere. Arch. Virol. 146: 1063–1074. doi: 10.1007/s007050170106 [DOI] [PubMed] [Google Scholar]
- 15.Lefeber D. J., Benaissa-Trouw B., Vliegenthart J. F., Kamerling J. P., Jansen W. T., Kraaijeveld K., Snippe H.2003. Th1-directing adjuvants increase the immunogenicity of oligosaccharide-protein conjugate vaccines related to Streptococcus pneumoniae type 3. Infect. Immun. 71: 6915–6920. doi: 10.1128/IAI.71.12.6915-6920.2003 [DOI] [PMC free article] [PubMed] [Google Scholar]
- 16.National Research Central on Equines (NRCE) Annual Report 2015–2016. India. http://nrce.gov.in/downloads/NRCE%20Annual%20Report%202015–2016.pdf [accessed on May 27, 2019].
- 17.Neumann G., Fujii K., Kino Y., Kawaoka Y.2005. An improved reverse genetics system for influenza A virus generation and its implications for vaccine production. Proc. Natl. Acad. Sci. U.S.A. 102: 16825–16829. doi: 10.1073/pnas.0505587102 [DOI] [PMC free article] [PubMed] [Google Scholar]
- 18.OIE Terrestrial manual, 2016. Equine Influenza, Chapter 2.5.7., Paris: OIE. http://www.oie.int/fileadmin/Home/eng/Health_standards/tahm/2.05.07_EQ_INF.pdf. [accessed on April 25, 2019].
- 19.Paillot R., Hannant D., Kydd J. H., Daly J. M.2006. Vaccination against equine influenza: quid novi? Vaccine 24: 4047–4061. doi: 10.1016/j.vaccine.2006.02.030 [DOI] [PubMed] [Google Scholar]
- 20.Pavulraj S., Bera B. C., Joshi A., Anand T., Virmani M., Vaid R. K., Shanmugasundaram K., Gulati B. R., Rajukumar K., Singh R., Misri J., Singh R. K., Tripathi B. N., Virmani N.2015. Pathology of Equine Influenza virus (H3N8) in Murine Model. PLoS One 10: e0143094. doi: 10.1371/journal.pone.0143094 [DOI] [PMC free article] [PubMed] [Google Scholar]
- 21.Pavulraj S., Virmani N., Bera B. C., Joshi A., Anand T., Virmani M., Singh R., Singh R. K., Tripathi B. N.2017. Immunogenicity and protective efficacy of inactivated equine influenza (H3N8) virus vaccine in murine model. Vet. Microbiol. 210: 188–196. doi: 10.1016/j.vetmic.2017.08.013 [DOI] [PubMed] [Google Scholar]
- 22.Portuondo D. L., Batista-Duharte A., Ferreira L. S., de Andrade C. R., Quinello C., Téllez-Martínez D., de Aguiar Loesch M. L., Carlos I. Z.2017. Comparative efficacy and toxicity of two vaccine candidates against Sporothrix schenckii using either MontanideTM Pet Gel A or aluminum hydroxide adjuvants in mice. Vaccine 35: 4430–4436. doi: 10.1016/j.vaccine.2017.05.046 [DOI] [PubMed] [Google Scholar]
- 23.Reed L. J., Muench H. A.1938. Simple method of estimating fifty per cent endpoints. Am. J. Epidemiol. 27: 493–497. doi: 10.1093/oxfordjournals.aje.a118408 [DOI] [Google Scholar]
- 24.Schreiber G. H., Schreiber R. D.2003. Interferon-gamma. pp. 567–602. In: The Cytokine Handbook (Thomson, A. W. and Lotze, M. T. eds.), Academic Press, San Diego. [Google Scholar]
- 25.Sörman A., Zhang L., Ding Z., Heyman B.2014. How antibodies use complement to regulate antibody responses. Mol. Immunol. 61: 79–88. doi: 10.1016/j.molimm.2014.06.010 [DOI] [PubMed] [Google Scholar]
- 26.Svitek N., Rudd P. A., Obojes K., Pillet S., von Messling V.2008. Severe seasonal influenza in ferrets correlates with reduced interferon and increased IL-6 induction. Virology 376: 53–59. doi: 10.1016/j.virol.2008.02.035 [DOI] [PubMed] [Google Scholar]
- 27.Szyszko E., Brokstad K., Cox R. J., Hovden A. O., Madhun A., Haaheim L. R.2006. Impact of influenza vaccine formulation with a detailed analysis of the cytokine response. Scand. J. Immunol. 64: 467–475. doi: 10.1111/j.1365-3083.2006.01805.x [DOI] [PubMed] [Google Scholar]
- 28.Tavakkoli H., Asasi K., Mohammadi A.2011. Effectiveness of two H9N2 low pathogenic avian influenza conventional inactivated oil emulsion vaccines on H9N2 viral replication and shedding in broiler chickens. Majallah-i Tahqiqat-i Dampizishki-i Iran 12: 214–221. [Google Scholar]
- 29.Téllez-Martínez D., Leandro Portuondo D., Loesch M. L., Batista-Duharte A., Zeppone Carlos I.2019. A Recombinant Enolase-Montanide™ PetGel A Vaccine Promotes a Protective Th1 Immune Response against a Highly Virulent Sporothrix schenckii by Toluene Exposure. Pharmaceutics 11: 144. doi: 10.3390/pharmaceutics11030144 [DOI] [PMC free article] [PubMed] [Google Scholar]
- 30.Topham D. J., Tripp R. A., Doherty P. C.1997. CD8+ T cells clear influenza virus by perforin or Fas-dependent processes. J. Immunol. 159: 5197–5200. [PubMed] [Google Scholar]
- 31.Virmani N., Bera B. C., Singh B. K., Shanmugasundaram K., Gulati B. R., Barua S., Vaid R. K., Gupta A. K., Singh R. K.2010. Equine influenza outbreak in India (2008–09): virus isolation, sero-epidemiology and phylogenetic analysis of HA gene. Vet. Microbiol. 143: 224–237. doi: 10.1016/j.vetmic.2009.12.007 [DOI] [PubMed] [Google Scholar]
- 32.Webster R. G.1993. Are equine 1 influenza viruses still present in horses? Equine Vet. J. 25: 537–538. doi: 10.1111/j.2042-3306.1993.tb03009.x [DOI] [PubMed] [Google Scholar]


