Abstract
Objective
To investigate molecular changes in multiple sclerosis (MS) normal-appearing cortical gray matter (NAGM).
Methods
We performed a whole-genome gene expression microarray analysis of human brain autopsy tissues from 64 MS NAGM samples and 42 control gray matter samples. We further examined our cases by HLA genotyping and performed immunohistochemical and immunofluorescent analysis of all human brain tissues.
Results
HLA-DRB1 is the transcript with highest expression in MS NAGM with a bimodal distribution among the examined cases. Genotyping revealed that every case with the MS-associated HLA-DR15 haplotype also shows high HLA-DRB1 expression and also of the tightly linked HLA-DRB5 allele. Quantitative immunohistochemical analysis confirmed the higher expression of HLA-DRB1 in HLA-DRB1*15:01 cases at the protein level. Analysis of gray matter lesion size revealed a significant increase of cortical lesion size in cases with high HLA-DRB1 expression.
Conclusions
Our data indicate that increased HLA-DRB1 and -DRB5 expression in the brain of patients with MS may be an important factor in how the HLA-DR15 haplotype contributes to MS pathomechanisms in the target organ.
Multiple sclerosis (MS), the most common inflammatory neurologic disease affecting young adults, is a chronic autoimmune demyelinating disease of the CNS. If untreated, MS leads to disability in a substantial proportion of patients. The etiology of MS includes a complex genetic trait and several environmental risk factors, which act in concert and contribute to the main pathomechanisms including autoimmune inflammation, de- and remyelination, axonal and neuronal loss, astroglia activation, and metabolic changes.1 The relative severity of these factors leads to the enormous heterogeneity of MS with respect to clinical signs, course, and response to treatment, but also pathologic composition of demyelinated lesions. The pathologic hallmark of MS is the formation of focal areas of myelin loss in the CNS. Besides the most commonly described white matter lesions, extensive gray matter lesions can be found in the MS cerebral cortex.2 In addition to the well-described demyelinated gray matter lesions also diffuse gray matter abnormalities in nonlesional normally myelinated areas have been described.3–5 At the molecular level, little is known about changes in normal-appearing cortical gray matter (NAGM) and gray matter lesions in MS. In the last years, several transcriptome studies of MS brain tissues have been performed, and a number of possible pathomechanisms could be identified such as mitochondrial dysfunction, metabolic changes in astrocytes, inflammation, and oxidative stress.3,6–8 A limitation of all these studies is the low number of tissue samples and cases and consequently the limited statistical power. The problem is further accentuated by the heterogeneity of MS, reflected by the variable clinical course, different clinical symptoms and imaging findings, and variability in pathology. As part of our published studies,8–10 we collected a large number of well-characterized human brain tissue samples from control and MS cases.
Here, we compared the expression pattern of MS NAGM with control gray matter (GM) to understand if there are alterations that may underlie or contribute to the formation of the widespread cortical lesions as an important aspect of MS pathology.
Methods
Tissue selection and characterization
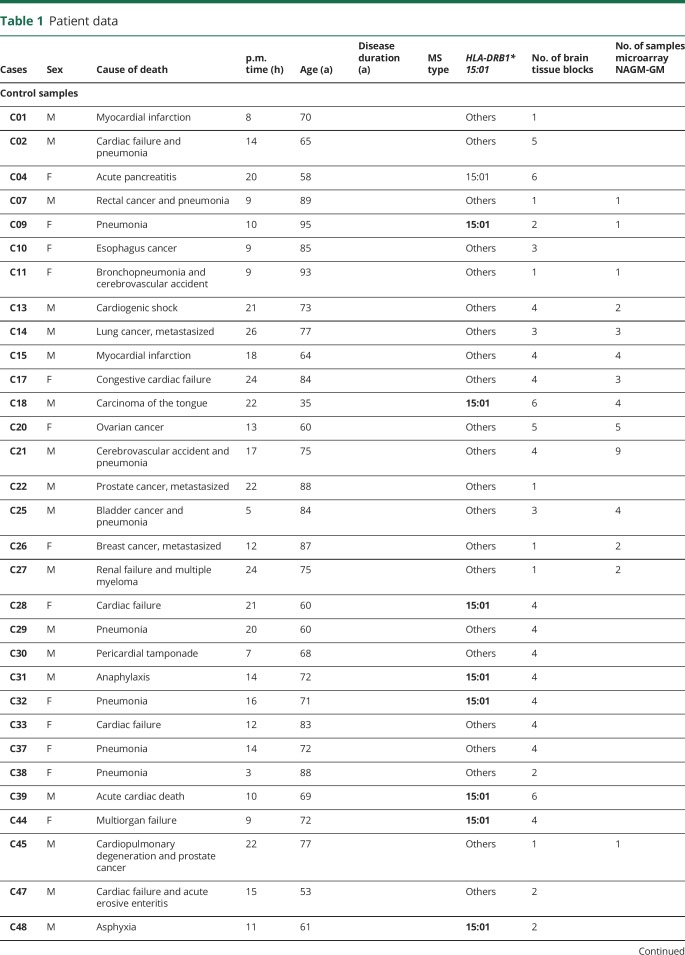
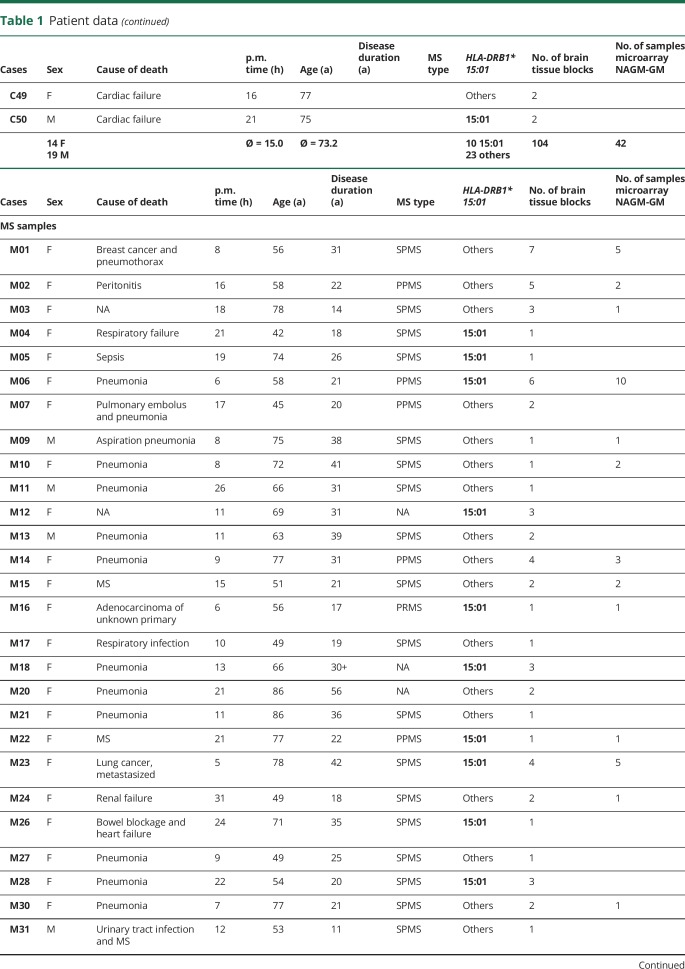
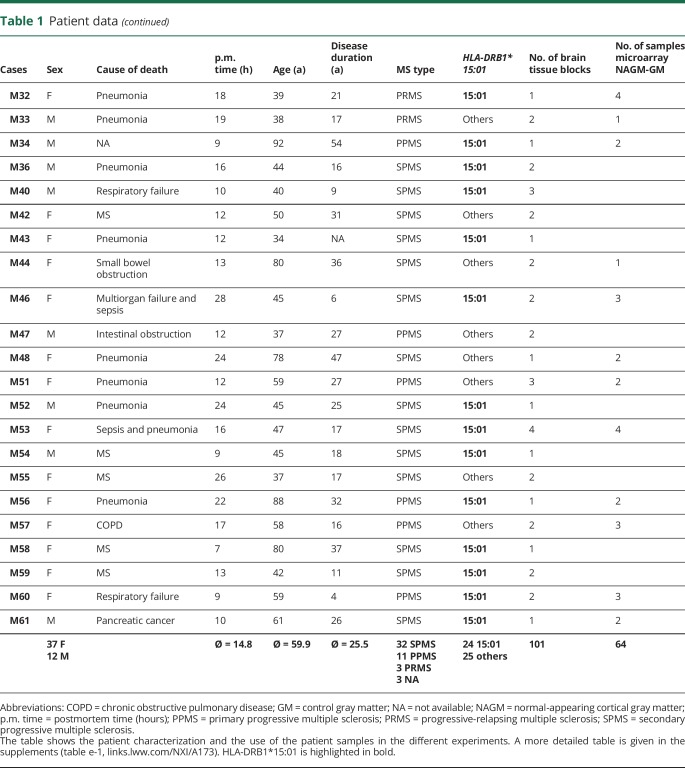
MS and control tissue samples were provided by the UK MS Tissue Bank (UK Multicentre Research Ethics Committee, MREC/02/2/39), funded by the MS Society of Great Britain and Northern Ireland registered charity 207495, or obtained from the archives of the Institute of Neuropathology at the University Medical Centre Göttingen. Additional control samples were provided by the Pathology Department of the University Hospital Basel. All cases were routinely screened by a neuropathologist to confirm diagnosis of MS and to exclude other confounding pathologies.11 In total, 104 gray matter tissue blocks from 34 control cases and 101 NAGM tissue blocks from 51 MS cases were used for this study (table 1, further details in table e-1, links.lww.com/NXI/A173). Criteria of in- and exclusion are described in figure 1A. Tissues were characterized further by staining for neuronal nuclei (NeuN) (neurons), oligodendrocyte transcription factor 2 (oligodendrocytes), myelin oligodendrocyte glycoprotein (MOG) (myelin), and CD68 (microglia) (figure 1B). Cryostat sections (12 μm) from fresh-frozen tissue blocks were stained as described before.8,10 Antibodies and detailed protocols are described in table e-2, A and B (links.lww.com/NXI/A173).
Table 1.
Patient data
Figure 1. Tissue processing for microarray and tissue characterization.
(A) Flowchart to illustrate the process from the patient's death to statistical analysis of the gene expression microarray. After dissection of the brain and exclusion of confounding pathologies, the tissue blocks were sent to Basel, Switzerland. There, an immunohistochemical characterization was performed, any tissue with bad preservation was excluded, and regions of interest were selected. After RNA isolation, the RIN was measured, and samples with RIN smaller than 6 were excluded. Sample mix up was checked by wrong sex and by principal component analysis. (B) Representative images of control cortical gray matter (case C30) and MS NAGM (case MS08, asterisk delineates the meninges, I–VI indicate the 6 neuronal layers). NAGM was defined as no loss of MOG, NeuN, or OLIG2 (inset, arrows) staining compared with control cases and no increase in CD68 compared with controls; i.e., occasional CD68+ staining intra- or perivascular (inset, arrowheads) and nearly no CD68+ staining in the tissue. Scale bars: 250 μm; inset Olig2: 20 μm, inset CD68: 10 μm. IHC = immunohistochemistry; MOG = myelin oligodendrocyte glycoprotein; NAGM = normal-appearing cortical gray matter; NeuN = neuronal nuclei; OLIG2 = oligodendrocyte transcription factor 2; PCA = principal component analysis; RIN = RNA integrity index.
Ethical approvals
Ethical approvals for all human tissues used were given by the UK Multicentre Research Ethics Committee, MREC/02/2/39 for the cases from London, by the Ethics Committee of the University Hospital Basel for all cases from Basel, and by the ethical review committee of the University Medical Center Göttingen (#19/09/10) for all cases from Göttingen.
RNA isolation and quality assessment
Total RNA from gray matter tissue was isolated using the Zymo ZR RNA Microprep Kit (Zymo Research, Irvine, CA) as described before.8 Degraded (RNA integrity index < 6) and/or contaminated (260/280 nm ratio < 1.8; 230/280 nm ratio < 1.8) samples were excluded from the study.
Microarray analysis and statistical analysis
From initially 151 NAGM and control gray matter samples, 35 were excluded due to the RNA integrity index being below the threshold of 6, 8 samples were excluded due to incongruence between the sex stated in the case reports and Y-chromosome linked gene expression, and 2 samples were excluded for being clear outliers in the principal component analysis. In total, 42 tissue samples from 14 control and 64 tissue samples from 25 MS cases were used for the gene expression analysis between NAGM and control GM (table 1 and table e-1, links.lww.com/NXI/A173). To minimize experimental bias, microarray experiments were performed together. All samples used for the gene expression study originated from the UK MS Tissue Bank. Gene expression profiling was performed using the Illumina complementary DNA–mediated annealing, selection, extension, and ligation assay according to the manufacturer's protocol12 (Part No. 15018210, Revision history D, April 2012, Illumina, San Diego, CA). BeadChips were scanned by the iScan Array scanner (Illumina). All subsequent data analyses were performed using the statistical software R (R core development Team 2008; R version 3.5.0). Specifically, the Bioconductor packages beadarray (version 2.30.0) and illuminaHumanWGDASLv4.db (version 1.26.0) were used for reading-in data files and for probe annotation (probes n = 48,107). Between-array normalization was performed by variance stabilizing transformation followed by a quantile normalization using functions from the Bioconductor package lumi (version 2.32.0). Only probes mapping to an ENTREZ gene ID were retained. Probes with quality status “bad” were removed. “Bad quality probes” are probe matches repeat sequences, intergenic or intronic regions, or is unlikely to provide specific signal for any transcript (according to illuminaHumanWGDASLv4 annotation). Because the resulting probes (n = 25,081) were still not unique, we selected the probe with the highest variance across all samples, neglecting sample values, which fall into the expression range of negative control probes. This way, each gene is represented by the probe, which contains most information on potential expression differences, but ignores probes, which appear artificially regulated due to false-negative regulation introduced by single nucleotide polymorphisms (SNPs). This strategy gave rise to 17,908 unique gene-level probes.
HLA genotyping
Human leukocyte antigen (HLA) genotyping was performed by Histogenetics (NY). Allelic variants were typed by sequencing at high resolution (3-field). Alleles bearing suffix “G” in the A locus have identical sequences in exon 2 and exon 3 antigen recognition sites. Alleles bearing suffix “G” in the DRB locus have identical sequences in exon 2 antigen recognition sites. Genotypes are shown in table e-3 (links.lww.com/NXI/A173).
Immunofluorescence colocalization
Immunofluorescent colocalization was performed as described before (table e-2A, links.lww.com/NXI/A173).8,10 As tissue preservation is not optimal in fresh-frozen tissues, further paraffin-embedded tissue blocks were stained for colocalization. Paraffin-embedded tissue sections (2–3 μm) were deparaffinized in xylene, rehydrated, and transferred to 3% H2O2 in phosphate buffered saline (PBS) for 20 minutes at 4°C to block the endogenous peroxidase. After 3 washing steps with PBS, the sections were incubated with blocking buffer (10% fetal calf serum in PBS) for at least 20 minutes to reduce unspecific antibody binding. Primary antibodies (table e-2A) were diluted in blocking buffer and incubated overnight at 4°C and then washed 3 times with PBS. Secondary antibodies were incubated for 1–2 hours (table e-2A).
Histologic quantification
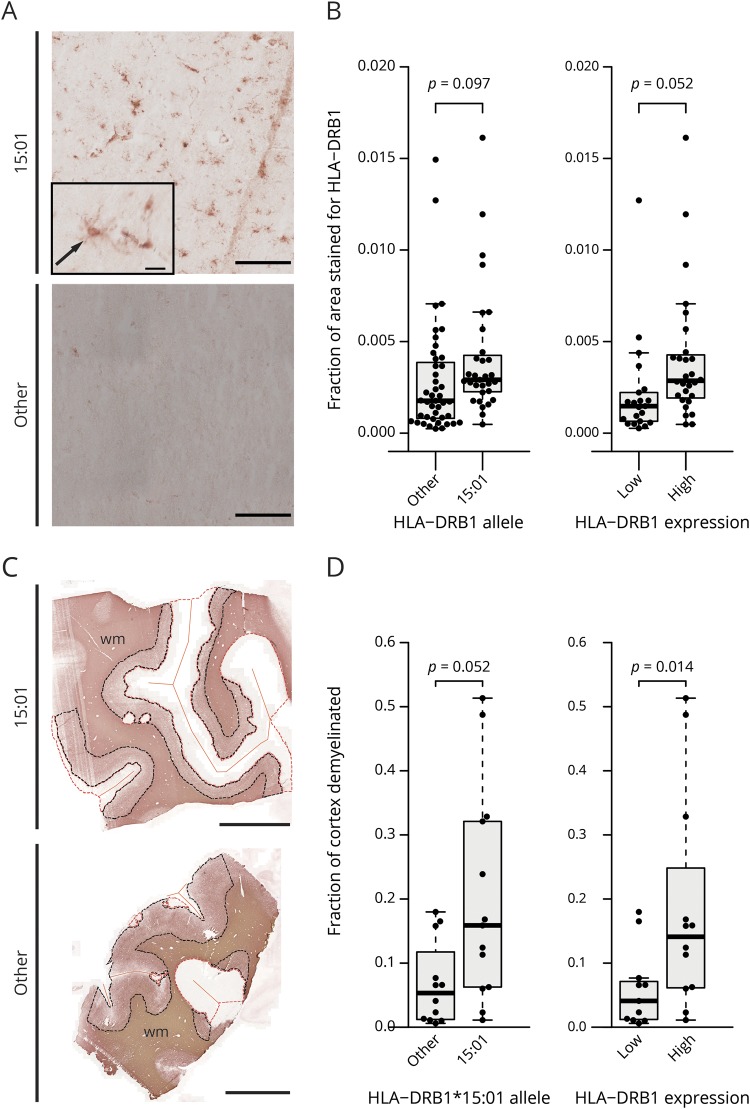
HLA-DRB1 protein expression was measured with Fiji (image processing package including ImageJ)13 using the count objects algorithm with the following parameters: lower threshold 0, upper threshold 120 in green channel of red-green-blue color space, size of objects 10 μm2–100 μm2, and circularity 0.25–1.00. Cortical lesions were defined as areas with complete loss of anti-MOG staining or areas with reduced myelin density clearly demarcated from surrounding normal-appearing tissue. Only cortical gray matter ranging from the white matter to the meninges and with all 6 neuronal layers visible in the adjacent NeuN staining was used. NAGM and gray matter lesion areas were outlined in Adobe Photoshop CS6 (version 13.0 x64; Adobe Systems, CA), exported, and evaluated for area (in squared millimeters) in ImageJ software (references 13 and 14, version 1.51s, Fiji distribution, NIH, Maryland). A schematic drawing is shown in figure 4C.
Figure 4. HLA-DRB1 protein expression in MS and control cases and cortical gray matter lesion size in MS cases associate with HLA-DRB1*15:01 allele.
Representative image of immunohistochemical stainings for HLA-DRB1 protein in a HLA-DRB1*15:01 positive (M6) and negative (M11) MS case (A). Most HLA-DRB1*15:01 positive cases show an evenly distributed staining of cells with microglia-like morphology (arrow) throughout the cerebral cortex (top panel), whereas cases with other alleles may show similar staining or no staining at all (bottom panel, extreme case with no staining). Scale bars: 500 μm, inset: 25 μm. Boxplots of the quantification of the HLA-DRB1 immunohistochemical staining (B) show MS and control cases carrying the HLA-DRB1*15:01 allele (left plot) or with a high HLA-DRB1 gene expression (right plot). Higher overall HLA-DRB1 protein expression was detected in HLA-DRB1*15:01 positive cases and high expressers compared with carriers of other alleles and low expressers, respectively. Detection of gray matter lesions in MS cases was performed by immunohistochemical staining for MOG (C shows representative images of a 15:01 positive [M28] and a negative [M3] MS case). NAGM is demarcated by a black dotted line and gray matter lesions by a red dotted line; orange straight lines demarcate the meninges. Scale bar: 1,000 μm. Quantification of cortical gray matter lesion size as fraction of demyelinated vs total cortical gray matter is shown (D). Both HLA-DRB1*15:01 carriers (left plot) and HLA-DRB1 high gene expressers (right plot) show a larger mean lesion size compared with carriers of other alleles or low expressers, respectively. (B and D) p Values are derived from a 2-sided Welch t test. MOG = myelin oligodendrocyte glycoprotein.
Statistical analysis
All statistical analyses were performed using R.15 A p value or false detection rate-adjusted p value smaller than 0.05 was considered statistically significant. Expression data were analyzed using R and the Bioconductor package limma (version 3.36.5). Statistical analysis was performed using a linear model with disease group and sex as factors. Because some patients contributed multiple tissue samples (tissue blocks), we additionally distinguished these “technical” replicates from true biological replicates (patients) in the model to avoid a potential inflation of significance by pseudoreplication. Specifically, the duplicateCorrelation function of the limma package was used to estimate a consensus correlation between technical replicates and this value together with patient ID as a block factor entered into the model fit function. To test the correlation between HLA-DRB1 and HLA-DRA gene expression, a linear model was used (figure 2J). To test the influence of the HLA-DRB1*15:01 genotype and the HLA-DRB1 gene expression on the demyelinated gray matter lesion area per total gray matter area, p values were derived from a linear model weighted by number of tissue blocks per patient (figure 4D). For all other statistical tests, a 2-sided Welch t test was used.
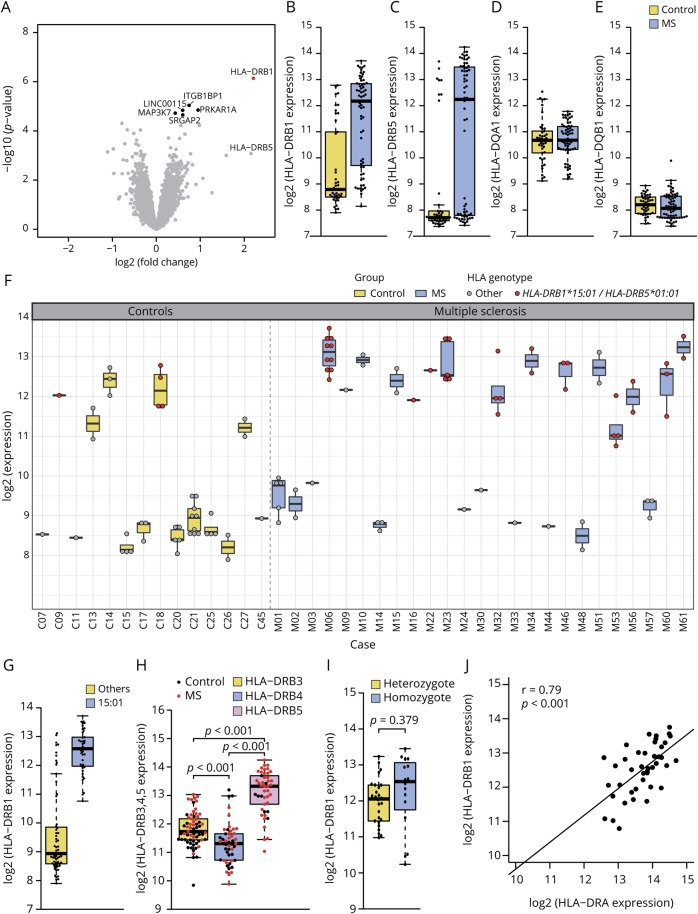
Figure 2. Differential gene expression in MS NAGM vs control case cortical gray matter.
(A) Volcano plot of the differential gene expression analysis between MS NAGM and control gray matter (GM) revealed HLA-DRB1 as the most significant differentially regulated gene (FC = 4.62, adj. p value = 0.013, marked in red). Differentially expressed genes with an adjusted p value between 0.05 and 0.1 are marked in black. This was the case for ITGB1BP1 (FC = 1.67, adj. p value = 0.065), PRKAR1A (FC = 1.93, adj. p value = 0.065), LINC00115 (FC = 1.5, adj. p value = 0.065), MAP3K7 (FC = 1.34, adj. p value = 0.067), and SRGAP2 (FC = 1.5, adj. p value = 0.067). Boxplots show the log2 gene expression of HLA-DRB1 (B), HLA-DRB5 (C), and HLA-DQA1 (D) and HLA-DQB1 (E) between MS NAGM and GM. HLA-DRB1 is significantly differentially expressed between MS NAGM and GM (B). Both, HLA-DRB1 (B) and HLA-DRB5 (C) show a bimodal expression pattern in MS and control tissue, whereas the expression of HLA-DQA1 (D) was normally distributed within the sample groups, and HLA-DQB1 (E) was at the lower detection limit. (F) Boxplots show log2 of the HLA-DRB1 gene expression in all tissue samples and in all cases used for the microarray analysis. All cases with the HLA-DRB1*15:01 genotype show a high HLA-DRB1 expression (red dots). (G) HLA-DRB1 expression between samples from cases carrying the HLA-DRB1*15:01 or other HLA-DRB1 alleles. Boxplot shows that all HLA-DRB1*15:01 tissue samples belong to the HLA-DRB1 high expresser group. (H) HLA-DRB3, 4, and 5 expression of all samples. (I) Comparison of hetero- and homozygote carriers of the HLA-DRB1*15:01 allele. (J) Correlation of HLA-DRB1 with HLA-DRA within the HLA-DRB1*15:01 positive samples. (H and I) p Values are derived from a 2-sided Welch t test. (J) p Value is derived from a linear model.
Data availability
The gene expression data discussed in this publication have been deposited in NCBI's Gene Expression Omnibus,16 accession number GSE131282, ncbi.nlm.nih.gov/geo/query/acc.cgi?acc=GSE131282.
Results
HLA-DRB1 is significantly upregulated in MS NAGM compared with control GM
We investigated the gene expression in MS NAGM and control cases. All tissues were characterized histopathologically, and tissues with signs of possible confounding pathologies were excluded (figure 1A). As a result, only tissues without signs of demyelination, neuronal degeneration, oligodendrocyte loss, and without signs of inflammation such as microglia activation and macrophage infiltration were included in the microarray study (figure 1B). Differential gene expression analysis between MS NAGM and control GM revealed HLA-DRB1 as the most significant differentially regulated gene (figure 2A) (fold-change [FC] = 4.62, adj. p value = 0.013). Besides HLA-DRB1, we detected a trend toward upregulation for the integrin subunit beta-1-binding protein 1 (ITGB1BP1), protein kinase cAMP-dependent type 1 regulatory subunit alpha (PRKAR1A), long intergenic nonprotein coding RNA 115 (LINC00115), mitogen-activated protein kinase kinase kinase 7, also known as TGF1 (MAP3K7), and SLIT-ROBO Rho GTPase activating protein 2 (SRGAP2) (figure 2A).
Further analysis of HLA-DRB1 expression showed that the distribution of HLA-DRB1 expression was bimodal within both the MS and the control group (figure 2B). Of special interest is that the majority of individuals with high HLA-DRB1 expression were in the MS group. As HLA genes often show tight linkage disequilibrium patterns,17 we further investigated the expression of DRB5, DQA1, and DQB1, as certain alleles of these genes were reported to form a tight linkage group within the DR15 haplotype.18 The MS-associated DR15 haplotype consists of 5 alleles, namely DRA*01, DRB1*15:01, DRB5*01:01, DQA1*01:02, and DQB1*06:02. Although not significantly differentially expressed between MS and control cases (FC = 4.45, adj. p value = 0.529), we also identified a bimodal distribution for HLA-DRB5 (figure 2C). HLA-DQA1 and HLA-DQB1 expression levels were normally distributed (figure 2, D and E), with HLA-DQB1 expression at the lower detection limit.
High cortical HLA-DRB1 expression is associated with the HLA-DRB1*15:01 haplotype
The bimodal HLA-DRB1 expression pattern prompted us to investigate whether HLA-DRB1 expression in all tissue samples from 1 individual shows this mode of expression. This analysis revealed that single cases either expressed HLA-DRB1 at high or low levels in both MS and control cases (figure 2F). As HLA-DRB1*15:01 is strongest associated with MS risk19,20 and HLA-DRB5 showed a similar expression distribution, we genotyped all cases for HLA-DRB1, 3, 4, and 5 at a 3-field resolution (table e-3, links.lww.com/NXI/A173). As expected, we detected a trend toward higher frequency of the HLA-DRB1*15:01 allele among the MS cases compared with control cases (Fisher exact test, p = 0.083, OR = 4.5, 95% CI = [0.8–50.2]).21 Gene expression analysis based on the HLA-DRB1 genotype revealed that the bimodal distribution was linked to the HLA-DRB1 genotype with individuals with the HLA-DRB1*15:01 allele always showing high transcriptional expression of HLA-DRB1 (n = 106 samples, figure 2, F and G). In contrast to HLA-DRB1, which is expressed in every case, only 11 MS and 1 control case turned out to carry the HLA-DRB5 gene (table e-3). As expected, all individuals genotyped positively for HLA-DRB5*01:01 allele were also positive for HLA-DRB1*15:01 (table e-3). Compared with HLA-DRB3 and -DRB4 alleles in other DR haplotypes, HLA-DRB5*01:01 always showed a higher expression (p < 0.001, df = 79.33, for DRB3, figure 2H; p < 0.001, df = 89.58 for DRB4, figure 2H). Notably, there were no significant differences in HLA-DRB1 gene expression levels between hetero- and homozygotic carriers of the HLA-DRB1*15:01 allele (p = 0.379, df = 22.01, figure 2I). Beside the cases carrying the HLA-DRB1*15:01 allele, 5 MS and 3 control cases also showed high HLA-DRB1 expression (figure 2F). Of these cases, one MS case was heterozygote for the HLA-DRB1*04:01 allele, and another case was heterozygote for the HLA-DRB1*08:01:01G allele. Of interest, both alleles have been associated with risk of MS.19,20 All 3 control cases were heterozygote for the HLA-DRB1*03:01 allele, also previously shown to be associated with MS19 (table e-3, risk genes marked in bold). Of the other 3 MS cases with high HLA-DRB1 expression, 2 did not carry a MS-associated allele (HLA-DRB1*01:01:01, *01:01:01G, *01:03, and *07:01:01G), and in 1 case, genotyping failed.
We did not detect any systematic differences between the HLA-DRB1*15:01 cases compared with the other cases concerning age at death, age at disease onset, and disease duration (figure e-1, A–C, links.lww.com/NXI/A173). Also, we did not detect any differences between the HLA-DRB1 high expressing cases compared with the low expressing cases concerning age at death, age at disease onset, and disease duration (figure e-1, D–F).
High HLA-DRB1 expression correlates with high expression of HLA-DRA
Functional HLA-DR molecules are heterodimers of a DRA-encoded alpha chain and a beta chain encoded by DRB1 or DRB3,4,5, respectively. Therefore, we investigated whether high HLA-DRB1 expression correlates with high HLA-DRA gene expression in HLA-DRB1*15:01 carriers. Indeed, high HLA-DRB1 gene expression correlated with high HLA-DRA (r = 0.79, p < 0.001) gene expression in HLA-DRB1*15:01 cases, supporting the idea of a biologically functional upregulation of MHCII in MS NAGM of HLA-DRB1*15:01 cases (figure 2J).
HLA-DRB1 is expressed by microglia in human cortical gray matter
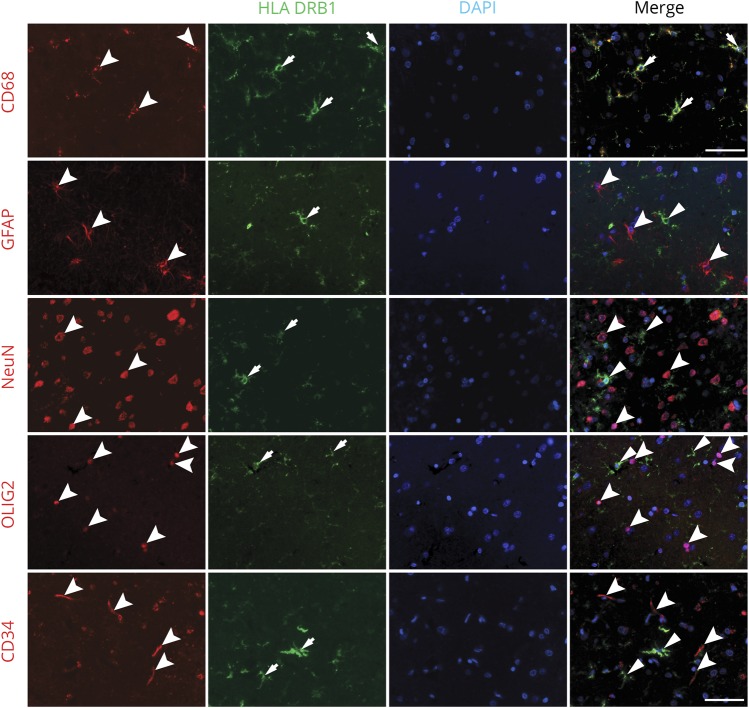
To determine which cell types are expressing HLA-DRB1 in NAGM, a confocal immunofluorescence colocalization analysis of fresh-frozen and paraffin-embedded human brain tissues was performed (figure 3). We detected that HLA-DRB1 colocalized with microglia in MS NAGM and control GM (figure 3A). No colocalization could be detected in astrocytes (figure 3B), neurons (figure 3C), oligodendrocytes (figure 3D), or blood vessels (figure 3E).
Figure 3. HLA-DRB1 colocalization in MS cortical gray matter.
Immunofluorescent colocalization of HLA-DRB1 with cellular markers for resident cells of the cortical gray matter. HLA-DRB1 colocalized with CD68, a marker for microglia (A, arrows). No colocalization with astrocytes (B, GFAP, arrowhead), neurons (C, NeuN, arrowhead), oligodendrocytes (D, OLIG2, arrowhead), and blood vessels (E, CD34, arrowhead) could be found. Scale bar: 50 μm. GFAP = glial-fibrillary acidic protein; NeuN = neuronal nuclei; OLIG2 = oligodendrocyte transcription factor 2.
HLA-DRB1 protein expression is elevated in HLA-DRB1*15:01-positive cases
Quantitative immunohistochemical analysis was performed to determine whether HLA-DRB1 gene and protein expression are associated with each other (figure 4A). We detected a higher protein expression in high vs low HLA-DRB1 gene expressers (p = 0.052, df = 46.9, n = 49) (figure 4B) and a trend toward higher expression in MS and control cases carrying the HLA-DRB1*15:01 allele compared with noncarriers (p = 0.097, df = 60.5, n = 74). HLA-DRB1 protein expression varied considerably from case to case (figure 4B).
HLA-DRB1*15:01 genotype and increased expression of HLA-DRB1 is associated with increased cortical demyelination
We hypothesized that the HLA-DRB1*15:01 genotype and the increased HLA-DRB1 gene- and protein expression might be related to meningeal inflammation and cortical microglia activation, previously described in MS,22 and hence might also correlate with increased levels of cortical demyelination.
We thus investigated all available tissue blocks from MS cases with cortical lesions (table e-1, links.lww.com/NXI/A173) and stained for MOG, delineated cerebral cortical area containing all 6 layers (identified by NeuN) (figure 4C), and quantified the fraction of demyelinated vs whole cortical area (figure 4D). Areas of demyelination in MS cases carrying the HLA-DRB1*15:01 allele, and respectively cases with a high HLA-DRB1 gene expression, were significantly larger than in HLA-DRB1*15:01-negative cases (p = 0.052, df = 23, n = 25) and, respectively, cases with low HLA-DRB1 gene expression (p = 0.014, df = 21, n = 23) (figure 4D).
HLA-DRB1*15:01 carrier status associates with higher expression of 9 genes in cortical NAGM in both MS and controls
We investigated the effect of the HLA-DRB1*15:01 allele by analyzing the differential gene expression data after grouping the cases into DRB1*15:01 positive or negative. We detected 9 genes to be differentially regulated. Most interestingly, our data show an upregulation of interleukin 18 receptor 1 (IL18R1; FC = 1.73, adj. p value = 0.004) and leukocyte immunoglobulin like receptor B1 (LILRB1; FC = 1.54, adj. p value = 0.032). The highest fold change was detected for long intergenic nonprotein coding RNA 01119 (LINC01119, FC = 4.35, adj. p value < 0.0001). We further detected differentially expressed transcripts of protein O-fucosyltransferase 2 (POFUT2; FC = 1.86, adj. p value < 0.001), G protein subunit beta 5 (GNB5; FC = −2.20, adj. p value = 0.003), epithelial stromal interaction 1 (EPSTI1; FC = 1.50, adj. p value = 0.005), DExD/H-box helicase 60 (DDX60; FC = 1.25, adj. p value = 0.010), N-acetylneuraminic acid phosphatase (NANP; FC = 1.47, adj. p value = 0.012), and kinesin family member 25 (KIF25; FC = −1.37, adj. p value = 0.049).
Discussion
Our results demonstrate that HLA-DRB1 is significantly higher expressed in MS NAGM and shows a bimodal distribution with more MS cases showing a high expression compared with control cases. Genotyping of the HLA locus revealed an almost exclusive high expression of all HLA-DRB1*15:01 allele carriers and of a few other MS-associated risk alleles. Consistent with the gene expression analysis, HLA-DRB1 protein expression is increased in HLA-DRB1*15:01-positive cases in gray matter on microglia based on immunofluorescence colocalization. The HLA-DRB1*15:01 genotype and high HLA-DRB1 gene expression are associated with larger gray matter lesions in MS. Furthermore, it is important to note that the second DR allele, DRB5*01:01, which is tightly linked with DRB1*15:01 in the MS-associated DR haplotype is also expressed at higher levels.
These findings hint at a link between the strongest genetic risk factor for MS and an important pathologic hallmark, namely demyelinated lesions in the cerebral cortex. We hypothesize that the HLA-DRB1*15:01 genotype and the increased HLA-DRB1 and-DRB5 gene expression together with meningeal and parenchymal inflammation may lead to larger demyelinated lesions. The correlation between inflammation, cortical demyelination, and the HLA-DRB1*15 allele has already been described in autopsy tissue by Yates et al.,23 who have detected more parenchymal, perivascular, and meningeal T-cell inflammation and larger motor cortical lesions in HLA-DRB1*15 carriers compared with carriers of other alleles. Although MRI detection of cortical gray matter lesion is improving, widespread subpial demyelination is still difficult to detect.24 A recent MRI study of 85 patients with MS did not reveal a statistically significant difference between HLA-DRB1*15:01 carriers and noncarriers; however, the authors point out the limited power due to the small number of cases.25 Furthermore, meningeal inflammation and follicle-like structures in the meninges have been linked to microglia activity22 and larger subpial cortical gray matter lesions.26 Regarding expression of the 2 DR15 alleles, higher messenger RNA expression of DRB5*01:01 compared with DRB1*15:01 in MS lesions and normal-appearing white matter have already been observed previously supporting our findings; however, much fewer cases and neither gray matter nor the extent of demyelination had been studied.27
HLA class II molecules present processed peptides to CD4+ T lymphocytes. In MS, the strongest genetic association maps to the HLA-DRB1 gene, whereas the association with DRB5*01:01 has so far largely been ignored because the SNPs, which have been used for determining DR types from SNP typing, are not sufficiently tightly spaced in the HLA region on chromosome 6 to allow assignment of the specific HLA-DR3*, -4*, and -5* alleles.20 The HLA-DRB1*15:01 allele was reported to increase the risk for developing MS about threefold.28 The higher HLA-DRB1 expression in the cortical gray matter in HLA-DRB1*15:01 cases may therefore be involved in local activation of autoreactive CD4+ T cells. For CD4+ T-cell activation to occur, an interaction between the T-cell receptor and major histocompatibility complex (MHC) class II/peptide (pMHC) complexes is required.29 The amount of antigen loaded on MHC class II molecules of antigen-presenting cells and the level of MHC class II expression determine the activation of CD4+ T-cell activation, and higher pMHC ligand densities enhance this process.30 Similar to the ectopic expression of HLA class II in autoimmune thyroid disease,31 higher HLA-DRB1 expression by microglia in the brain may therefore affect the pMHC concentration and consequently lead to an increased probability of T-cell activation and brain inflammation. This hypothesis is further supported by the finding that the level of HLA-DR expression in transgenic mice is an important prerequisite for developing spontaneous experimental autoimmune encephalomyelitis.32
Besides their expression levels, the nature of the peptide repertoire that is presented by the 2 HLA-DR alleles in the MS-associated DR15 haplotype, i.e., DRB1*15:01 and DRB5*01:01,27 probably also plays an important role for the activation of autoreactive T cells.33,34 Finally, autoreactive- and virus-specific, brain-infiltrating CD4+ T cells may recognize peptides in the context of both DR alleles of the DR15 haplotype, indicating that the expression of the 2 DR molecules may increase the likelihood of T-cell activation further.35,36
A bimodal expression pattern of HLA-DRB1 and -DRB5 has been described in lymphoblastoid cell lines.37 The authors analyzed expression quantitative trait loci in the tag of the HLA-DRB1*15:01 allele associating with high HLA-DRB1, DRB5, and DQB1 gene expression. They concluded that a higher gene expression alone does not sufficiently explain the MS-associated risk of the HLA-DRB1*15:01 allele. At present, it is not clear which molecular pathomechanisms are responsible for the high vs lower expression in some individuals, but differences in gene regulation, for instance by different activation of the class II transactivator, is one possibility.38
Regarding the potential functional involvement of the DRB1*15:01 haplotype, the higher DRB1- and DRB5 expression in MS brains raises questions beyond peptide presentation to autoreactive T cells. The brain is considered an immune privileged site, and besides shielding of the CNS from the peripheral immune system via specialized barriers, low MHC expression is considered an important aspect of this CNS immune privilege.39 Aberrant and increased expression of HLA-DRB1 and -DRB5 may contribute to breaking immune tolerance in this tissue that is exquisitely vulnerable to damage and endowed with cells that are terminally differentiated and not replaceable. The interpretation of recent genome-wide association studies in MS, which found almost exclusively immune system-related genes, has been that MS develops from outside, i.e., the peripheral immune system, in as opposed to starting by damage within the CNS and then involving peripheral immune cells, i.e., inside-out hypothesis.40 Our data, although preliminary and not addressing functional aspects in human brain tissue, might indicate that increased HLA-DR expression in the brain, if it preceded peripheral immune T-cell activation, could play a role both within and later also outside the brain.
Regarding gene expression in cortical gray matter, several studies have been performed with a relative small set of NAGM tissue samples3,6,7 including ours.8 The present study with a much larger number of cases and tissues did not show the same gene expression alterations as the previous studies. Possible reasons are the different gene expression platforms, tissue preparation (fresh frozen vs paraffin embedded), the statistical methods, and, most relevant, differences in the patient samples, which is a critical aspect in a heterogeneous disease like MS.
The gene expression analysis further revealed 9 genes to be differentially expressed in HLA-DRB1*15:01-positive vs -negative samples. Among the detected genes, IL18R1 gene and protein expression have previously been shown to be elevated in MS in CSF and peripheral blood mononuclear cells compared with controls.41 The highest fold change was detected for LINC01119, a long intergenic non–protein-coding RNA. Research on noncoding RNAs is rapidly evolving, and some members have already been shown to play a role in immune system regulation.42 We further detected LILRB1, a receptor for class I MHC antigens expressed by different leukocyte lineages that may downregulate monocyte activation signals. EPSTI143 and DDX6044 have previously been shown to be differentially regulated on interferon signaling in HLA-B27-transgenic rats, an animal model developing spontaneous autoimmune-mediated multisystem inflammatory disease.45 The other genes we detected were POFUT2,46 GNB5,47 NANP,48 and KIF25.49 To the best of our knowledge, these genes have not been described to date in the context of MS or HLA-DRB as possibly linked to the HLA-DRB1*15:01 allele. The power of this particular analysis is however limited by the sample heterogeneity and needs further experimental investigation to evaluate the possible impact of the detected differential expression.
In conclusion, our results demonstrate elevated DR expression in the cortical gray matter of a subset of patients with MS positive for the HLA-DR15 haplotype and rarely also other DR types. HLA-DRB1 expression by microglia in the brain might play a role as vulnerability factor to develop or sustain MS. Further studies on DR expression in the brain, its causes, and consequences would therefore be of great interest for a better understanding of MS pathogenesis.
Acknowledgment
The authors thank Prof. Dr. Richard Reynolds (UK Multiple Sclerosis Tissue Bank, Charing Cross Hospital London, UK) and Prof. Dr. Markus Tolnay (Pathology, University Hospital Basel, Switzerland) for providing human brain tissues. They also thank Sigrid Müller, Heidi Brodmerkel, and Katja Schulz for technical assistance. Calculations were performed at sciCORE (scicore.unibas.ch/) Scientific Computing Center at University of Basel. The authors declare no conflict of interest.
Glossary
- GM
control gray matter
- HLA
human leukocyte antigen
- MOG
myelin oligodendrocyte glycoprotein
- MS
multiple sclerosis
- NAGM
normal-appearing cortical grey matter
- NeuN
neuronal nuclei
- OLIG2
oligodendrocyte transcription factor 2
- SNP
single nucleotide polymorphism
Appendix. Authors
Study funding
This study was supported by the Roche Translational Medicine Hub, by the Swiss National Science Foundation (31003A_159528/1), by the Swiss Multiple Sclerosis Society, and by the French MS Society (ARSEP) all to N.S.-W., by the Swiss National Science Foundation (323530_171139) to L.S.E., and by the European Research Council grant ERC-2013-ADG 340733 to R.M., and the Clinical Research Priority Program MS (CRPPMS) of the University of Zurich (UZH).
Disclosure
L.S. Enz, T. Zeis, D. Schmid, F. Geier, F. van der Meer, G. Steiner, U. Certa, and T.M.C. Binder report no disclosures. C. Stadelmann received personal compensation for advisory board functions from Novartis and Roche and honoraries for speaking and travel support from Bayer, Novartis, and Roche, all not related to the work presented here. R. Martin received unrestricted grants from Biogen and Novartis and personal compensation for lecture or advisory board functions from Biogen, Merck, Novartis, Roche, Sanofi-Aventis, Teva, Cell-Protect, and Neuway. He is a cofounder and co-owner of Cellerys, a startup company of the University of Zurich. He is coinventor and patent holder on patents related to antigen-specific tolerization, treatment/vaccination of PML and the use of daclizumab as a treatment of multiple sclerosis. N. Schaeren-Wiemers reports no disclosures. Go to Neurology.org/NN for full disclosure.
References
- 1.Olsson T, Barcellos LF, Alfredsson L. Interactions between genetic, lifestyle and environmental risk factors for multiple sclerosis. Nat Rev Neurol 2017;13:25–36. [DOI] [PubMed] [Google Scholar]
- 2.Calabrese M, Magliozzi R, Ciccarelli O, Geurts JJ, Reynolds R, Martin R. Exploring the origins of grey matter damage in multiple sclerosis. Nat Rev Neurosci 2015;16:147–158. [DOI] [PubMed] [Google Scholar]
- 3.Dutta R, McDonough J, Yin X, et al. Mitochondrial dysfunction as a cause of axonal degeneration in multiple sclerosis patients. Ann Neurol 2006;59:478–489. [DOI] [PubMed] [Google Scholar]
- 4.Kutzelnigg A, Faber-Rod JC, Bauer J, et al. Widespread demyelination in the cerebellar cortex in multiple sclerosis. Brain Pathol 2007;17:38–44. [DOI] [PMC free article] [PubMed] [Google Scholar]
- 5.Stadelmann C, Albert M, Wegner C, Brück W. Cortical pathology in multiple sclerosis. Curr Opin Neurol 2008;21:229–234. [DOI] [PubMed] [Google Scholar]
- 6.Fischer MT, Wimmer I, Höftberger R, et al. Disease-specific molecular events in cortical multiple sclerosis lesions. Brain 2013;136:1799–1815. [DOI] [PMC free article] [PubMed] [Google Scholar]
- 7.Torkildsen Ø, Stansberg C, Angelskår SM, et al. Upregulation of immunoglobulin-related genes in cortical sections from multiple sclerosis patients. Brain Pathol 2010;20:720–729. [DOI] [PMC free article] [PubMed] [Google Scholar]
- 8.Zeis T, Allaman I, Gentner M, et al. Metabolic gene expression changes in astrocytes in multiple sclerosis cerebral cortex are indicative of immune-mediated signaling. Brain Behav Immun 2015;48:313–325. [DOI] [PubMed] [Google Scholar]
- 9.Zeis T, Howell OW, Reynolds R, Schaeren-Wiemers N. Molecular pathology of multiple sclerosis lesions reveals a heterogeneous expression pattern of genes involved in oligodendrogliogenesis. Exp Neurol 2018;305:76–88. [DOI] [PubMed] [Google Scholar]
- 10.Zeis T, Graumann U, Reynolds R, Schaeren-Wiemers N. Normal-appearing white matter in multiple sclerosis is in a subtle balance between inflammation and neuroprotection. Brain 2008;131:288–303. [DOI] [PubMed] [Google Scholar]
- 11.Reynolds R, Roncaroli F, Nicholas R, Radotra B, Gveric D, Howell O. The neuropathological basis of clinical progression in multiple sclerosis. Acta Neuropathol 2011;122:155–170. [DOI] [PubMed] [Google Scholar]
- 12.Fan JB, Yeakley JM, Bibikova M, et al. A versatile assay for high-throughput gene expression profiling on universal array matrices. Genome Res 2004;14:878–885. [DOI] [PMC free article] [PubMed] [Google Scholar]
- 13.Schindelin J, Arganda-Carreras I, Frise E, et al. Fiji: an open-source platform for biological-image analysis. Nat Methods 2012;9:676–682. [DOI] [PMC free article] [PubMed] [Google Scholar]
- 14.Rueden CT, Schindelin J, Hiner MC, et al. ImageJ2: ImageJ for the next generation of scientific image data. BMC Bioinformatics 2017;18:529. [DOI] [PMC free article] [PubMed] [Google Scholar]
- 15.R Development Core Team. R: A Language and Environment for Statistical Computing. Vienna, Austria: R Foundation for Statistical Computing; 2010. [Google Scholar]
- 16.Edgar R, Domrachev M, Lash AE. Gene Expression Omnibus: NCBI gene expression and hybridization array data repository. Nucleic Acids Res 2002;30:207–210. [DOI] [PMC free article] [PubMed] [Google Scholar]
- 17.Kennedy AE, Ozbek U, Dorak MT. What has GWAS done for HLA and disease associations? Int J Immunogenet 2017;44:195–211. [DOI] [PubMed] [Google Scholar]
- 18.Yaouanq J, Semana G, Eichenbaum S, et al. Evidence for linkage disequilibrium between HLA-DRB1 gene and multiple sclerosis: The French Research Group on Genetic Susceptibility to MS. Science 1997;276:664–665. [DOI] [PubMed] [Google Scholar]
- 19.Patsopoulos NA, Barcellos LF, Hintzen RQ, et al. Fine-mapping the genetic association of the major histocompatibility complex in multiple sclerosis: HLA and non-HLA effects. PLoS Genet 2013;9:e1003926. [DOI] [PMC free article] [PubMed] [Google Scholar]
- 20.Moutsianas L, Jostins L, Beecham AH, et al. Class II HLA interactions modulate genetic risk for multiple sclerosis. Nat Genet 2015;47:1107–1113. [DOI] [PMC free article] [PubMed] [Google Scholar]
- 21.Hollenbach JA, Oksenberg JR. The immunogenetics of multiple sclerosis: a comprehensive review. J Autoimmun 2015;64:13–25. [DOI] [PMC free article] [PubMed] [Google Scholar]
- 22.Howell OW, Reeves CA, Nicholas R, et al. Meningeal inflammation is widespread and linked to cortical pathology in multiple sclerosis. Brain 2011;134:2755–2771. [DOI] [PubMed] [Google Scholar]
- 23.Yates RL, Esiri MM, Palace J, Mittal A, DeLuca GC. The influence of HLA-DRB1*15 on motor cortical pathology in multiple sclerosis. Neuropathol Appl Neurobiol 2015;41:371–384. [DOI] [PubMed] [Google Scholar]
- 24.Kilsdonk ID, Jonkman LE, Klaver R, et al. Increased cortical grey matter lesion detection in multiple sclerosis with 7 T MRI: a post-mortem verification study. Brain 2016;139:1472–1481. [DOI] [PubMed] [Google Scholar]
- 25.Yaldizli O, Sethi V, Pardini M, et al. HLA-DRB*1501 associations with magnetic resonance imaging measures of grey matter pathology in multiple sclerosis. Mult Scler Relat Disord 2016;7:47–52. [DOI] [PubMed] [Google Scholar]
- 26.Magliozzi R, Howell OW, Reeves C, et al. A gradient of neuronal loss and meningeal inflammation in multiple sclerosis. Ann Neurol 2010;68:477–493. [DOI] [PubMed] [Google Scholar]
- 27.Prat E, Tomaru U, Sabater L, et al. HLA-DRB5*0101 and -DRB1*1501 expression in the multiple sclerosis-associated HLA-DR15 haplotype. J Neuroimmunol 2005;167:108–119. [DOI] [PubMed] [Google Scholar]
- 28.International Multiple Sclerosis Genetics Consortium, Wellcome Trust Case Control Consortium, Sawcer S, et al. Genetic risk and a primary role for cell-mediated immune mechanisms in multiple sclerosis. Nature 2011;476:214–219. [DOI] [PMC free article] [PubMed] [Google Scholar]
- 29.Dustin ML. T-cell activation through immunological synapses and kinapses. Immunol Rev 2008;221:77–89. [DOI] [PubMed] [Google Scholar]
- 30.Corse E, Gottschalk RA, Allison JP. Strength of TCR-peptide/MHC interactions and in vivo T cell responses. J Immunol 2011;186:5039–5045. [DOI] [PubMed] [Google Scholar]
- 31.Bottazzo GF, Pujol-Borrell R, Hanafusa T, Feldmann M. Role of aberrant HLA-DR expression and antigen presentation in induction of endocrine autoimmunity. Lancet 1983;2:1115–1119. [DOI] [PubMed] [Google Scholar]
- 32.Quandt JA, Huh J, Baig M, et al. Myelin basic protein-specific TCR/HLA-DRB5*01:01 transgenic mice support the etiologic role of DRB5*01:01 in multiple sclerosis. J Immunol 2012;189:2897–2908. [DOI] [PMC free article] [PubMed] [Google Scholar]
- 33.Kondo T, Cortese I, Markovic-Plese S, et al. Dendritic cells signal T cells in the absence of exogenous antigen. Nat Immunol 2001;2:932–938. [DOI] [PubMed] [Google Scholar]
- 34.Mohme M, Hotz C, Stevanovic S, et al. HLA-DR15-derived self-peptides are involved in increased autologous T cell proliferation in multiple sclerosis. Brain 2013;136:1783–1798. [DOI] [PubMed] [Google Scholar]
- 35.Lang HL, Jacobsen H, Ikemizu S, et al. A functional and structural basis for TCR cross-reactivity in multiple sclerosis. Nat Immunol 2002;3:940–943. [DOI] [PubMed] [Google Scholar]
- 36.Sospedra M, Muraro PA, Stefanova I, et al. Redundancy in antigen-presenting function of the HLA-DR and -DQ molecules in the multiple sclerosis-associated HLA-DR2 haplotype. J Immunol 2006;176:1951–1961. [DOI] [PMC free article] [PubMed] [Google Scholar]
- 37.Alcina A, Abad-Grau Mdel M, Fedetz M, et al. Multiple sclerosis risk variant HLA-DRB1*1501 associates with high expression of DRB1 gene in different human populations. PLoS One 2012;7:e29819. [DOI] [PMC free article] [PubMed] [Google Scholar]
- 38.Reith W, LeibundGut-Landmann S, Waldburger JM. Regulation of MHC class II gene expression by the class II transactivator. Nat Rev Immunol 2005;5:793–806. [DOI] [PubMed] [Google Scholar]
- 39.Engelhardt B, Vajkoczy P, Weller RO. The movers and shapers in immune privilege of the CNS. Nat Immunol 2017;18:123–131. [DOI] [PubMed] [Google Scholar]
- 40.Barnett MH, Prineas JW. Relapsing and remitting multiple sclerosis: pathology of the newly forming lesion. Ann Neurol 2004;55:458–468. [DOI] [PubMed] [Google Scholar]
- 41.Gillett A, Thessen Hedreul M, Khademi M, et al. Interleukin 18 receptor 1 expression distinguishes patients with multiple sclerosis. Mult Scler 2010;16:1056–1065. [DOI] [PubMed] [Google Scholar]
- 42.Wu GC, Pan HF, Leng RX, et al. Emerging role of long noncoding RNAs in autoimmune diseases. Autoimmun Rev 2015;14:798–805. [DOI] [PubMed] [Google Scholar]
- 43.Nielsen HL, Rønnov-Jessen L, Villadsen R, Petersen OW. Identification of EPSTI1, a novel gene induced by epithelial-stromal interaction in human breast cancer. Genomics 2002;79:703–710. [DOI] [PubMed] [Google Scholar]
- 44.Schoggins JW, Wilson SJ, Panis M, et al. A diverse range of gene products are effectors of the type I interferon antiviral response. Nature 2011;472:481–485. [DOI] [PMC free article] [PubMed] [Google Scholar]
- 45.Fert I, Cagnard N, Glatigny S, et al. Reverse interferon signature is characteristic of antigen-presenting cells in human and rat spondyloarthritis. Arthritis Rheumatol 2014;66:841–851. [DOI] [PMC free article] [PubMed] [Google Scholar]
- 46.Luo Y, Nita-Lazar A, Haltiwanger RS. Two distinct pathways for O-fucosylation of epidermal growth factor-like or thrombospondin type 1 repeats. J Biol Chem 2006;281:9385–9392. [DOI] [PubMed] [Google Scholar]
- 47.Shamseldin HE, Masuho I, Alenizi A, et al. GNB5 mutation causes a novel neuropsychiatric disorder featuring attention deficit hyperactivity disorder, severely impaired language development and normal cognition. Genome Biol 2016;17:195. [DOI] [PMC free article] [PubMed] [Google Scholar]
- 48.Maliekal P, Vertommen D, Delpierre G, Van Schaftingen E. Identification of the sequence encoding N-acetylneuraminate-9-phosphate phosphatase. Glycobiology 2006;16:165–172. [DOI] [PubMed] [Google Scholar]
- 49.Decarreau J, Wagenbach M, Lynch E, et al. The tetrameric kinesin Kif25 suppresses pre-mitotic centrosome separation to establish proper spindle orientation. Nat Cel Biol 2017;19:384–390. [DOI] [PMC free article] [PubMed] [Google Scholar]
Associated Data
This section collects any data citations, data availability statements, or supplementary materials included in this article.
Data Availability Statement
The gene expression data discussed in this publication have been deposited in NCBI's Gene Expression Omnibus,16 accession number GSE131282, ncbi.nlm.nih.gov/geo/query/acc.cgi?acc=GSE131282.


