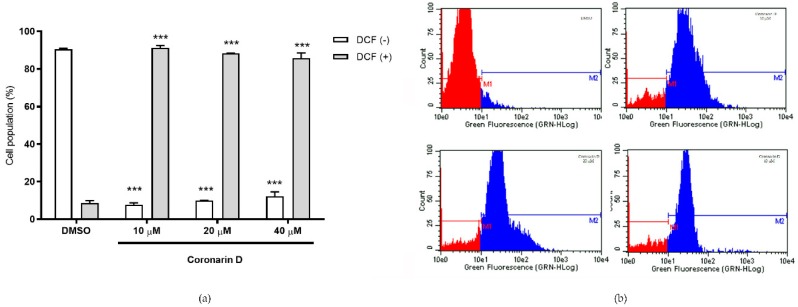
Figure 7.
(a) Percentage of cells with high (DCF +) and low (DCF –) 2,7–dichlorofluorescein intracellular fluorescence intensity after 90 min of treatment with vehicle (DMSO) and Coronarin D at 10, 20, and 40 μM. Histograms are presented at (b). The values are expressed as mean ± standard deviation of two replicates of the same experiment. *** p < 0.001. (ANOVA Two–way: Bonferroni).

