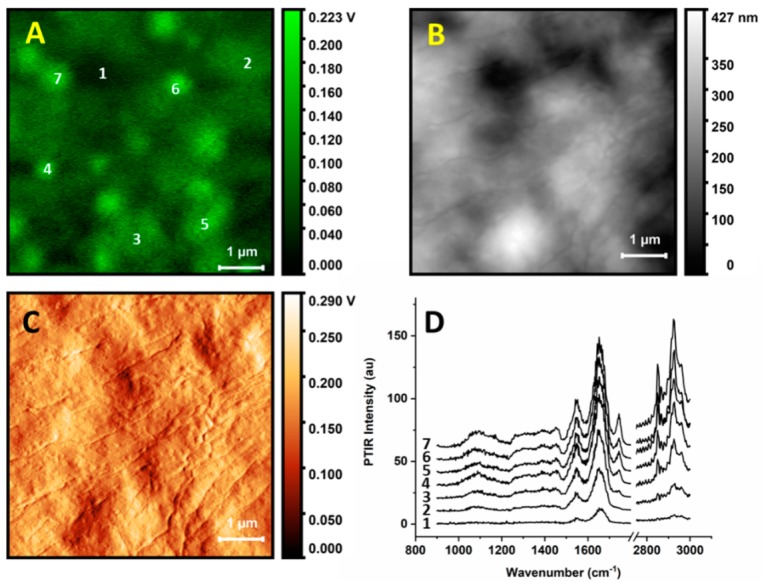
Figure 2.

AFM maps, PTIR maps, and single spectra of subcellular locations. (A) PTIR image of portion of a buccal cell collected with 1670 cm−1 excitation. (B) AFM height image of the same cellular portion as in (A). (C) Deflection image of the same cellular portion as in (A). (D) PTIR spectra recorded in different locations of the sample region, numbered according to panel (A). Power was set at 20% of the maximum.
