

Summary
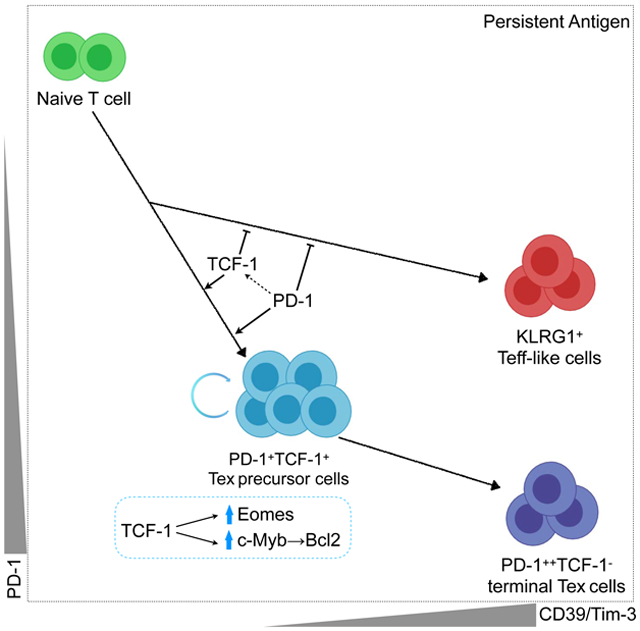
TCF-1 is a key transcription factor in progenitor exhausted CD8 T cells (Tex). Moreover, this Tex cell subset mediates responses to PD-1 checkpoint pathway blockade. However, the role of the transcription factor TCF-1 in early fate decisions and initial generation of Tex cells is unclear. Single cell RNA-sequencing (scRNA-seq) and lineage tracing identified a TCF-1+Ly108+PD-1+ CD8 T cell population early during chronic infection that seeds development of mature Tex cells. TCF-1 mediated the bifurcation between divergent fates, repressing development of terminal KLRG1Hi effectors while fostering KLRG1Lo Tex precursor cells, and PD-1 stabilized this TCF-1+ Tex precursor cell pool. TCF-1 mediated a T-bet to Eomes transcription factor transition in Tex precursors by promoting Eomes expression and drove c-Myb expression that controlled Bcl-2 and survival. These data define a role for TCF-1 in early fate bifurcation driving Tex precursor cells, and also identify PD-1 as a protector of this early TCF-1 subset.
Graphical Abstract
eTOC
The initiation of T cell exhaustion program remains poorly understood. In this study, Chen and colleagues define an effector (Teff) versus exhausted CD8 T (Tex) cell binary fate decision during chronic infection, and find that TCF-1 supports the Tex precursor development by antagonizing Teff-like cell differentiation through multiple transcription factors.
Introduction
During acute infections or vaccinations, naïve CD8 T cells become activated and differentiate into a pool of effector T cells containing KLRG1Hi terminal effector (Teff) cells and KLRG1LoCD127Hi memory precursors (Tmp) cells (Kaech and Cui, 2012). The KLRG1Hi Teff cell population is often 5-20 times more numerous than the Tmp cell subset and has robust effector functions. However, the KLRG1Hi population is terminal, largely disappearing over the ensuing weeks whereas the Tmp cell population matures into long-term memory CD8 T cells (Kaech et al., 2003). During chronic infections or in tumors, the KLRG1Hi population of Teff (or the related Temra or CD57+ populations in humans) cells is less prominent (Angelosanto et al., 2012; Joshi et al., 2007; Omilusik et al., 2018) and exhausted CD8 T cells (Tex) that are often found in these settings are KLRG1Lo (Doering et al., 2012; Wherry et al., 2007). Moreover, lineage tracing studies demonstrated that the KLRG1Hi Teff cells subset survives poorly during chronic infection and cannot give rise to Tex cells (Angelosanto et al., 2012). In contrast, a CD127HiKLRG1Lo population in the effector phase has the potential to give rise to either functional memory CD8 T cells or Tex cells during acutely resolved or chronic viral infection, respectively (Angelosanto et al., 2012). Nevertheless, the developmental paths that seed the formation of Tex cells in chronic infections and cancer remain poorly understood. Dissecting these developmental relationships and the underlying transcriptional circuits could provide opportunities to avoid or reverse T cell exhaustion therapeutically.
Transcriptional control mechanisms have begun to be dissected for developing Teff and Tmp cells following acute infections. The KLRG1Hi Teff cell subset uses the TFs T-bet (Joshi et al., 2007), Blimp-1 (Kallies et al., 2009; Rutishauser et al., 2009), Id2 (Yang et al., 2011), and Zeb2 (Dominguez et al., 2015; Guan et al., 2018) that foster effector molecule expression (Kaech and Cui, 2012). Conversely, the KLRG1−D127+ Tmp cell fate employs a distinct transcriptional control circuits including Eomes (Intlekofer et al., 2005), Bcl-6 (Ichii et al., 2002), Id3 (Yang et al., 2011), TCF-1 (Jeannet et al., 2010) and c-Myb (Z. Chen et al., 2017). This Tmp cell population eventually gives rise to memory CD8 T cells (Tmem) that have the ability to self-renew, persist long-term and provide protection upon subsequent infection (Zhou et al., 2010).
In contrast to acute infections, the early fate commitment steps and regulation of population heterogeneity in initial establishment of CD8 T cell exhaustion remain poorly understood. During chronic infection or cancer, the Tex cells that develop, unlike Tmem cells, have decreased function and high expression of inhibitory receptors such as PD-1, LAG-3, TIGIT, but relatively low KLRG1 (Wherry et al., 2007). It is now clear that Tex cells are a distinct “lineage” of mature CD8 T cells differing from Teff and Tmem cells by ~6000 open chromatin regions (Mognol et al., 2017; Pauken et al., 2016; Philip et al., 2017; Sen et al., 2016). This epigenetic divergence begins early, but becomes progressively more widespread and permanent (Pauken et al., 2016; Philip et al., 2017; Sen et al., 2016; Wherry et al., 2007). However, the early transcriptional events that regulate formation of the Tex cell fate compared to Teff or Tmem cell fates remain undefined.
Several transcriptional control mechanisms have been identified in Tex cells. Most notably, T-bet, Eomes and TCF-1 have been implicated in the biology of Tex cell subsets (He et al., 2016; Im et al., 2016; Paley et al., 2012; Utzschneider et al., 2016; Wu et al., 2016). A Tex cell precursor pool has been originally described as a PD-1Int population of Tex cells capable of responding to PD-1 blockade whereas a more numerous, terminal PD-1Hi subset failed respond (Blackburn et al., 2008). Subsequent work has identified key roles for T-bet, Eomes and TCF-1 (He et al., 2016; Im et al., 2016; Paley et al., 2012; Utzschneider et al., 2016; Wu et al., 2016). Nr4a (J. Chen et al., 2019; Liu et al., 2019), IRF4 (Man et al., 2017) and NFAT (Martinez et al., 2015) have also been implicated in promoting T cell exhaustion whereas Fosl2 (Stelekati et al., 2018) can partially antagonize exhaustion by promoting memory-like features. Recent work has also shown that the high mobility group (HMG) protein Tox coordinates the epigenetic imprinting of T cell exhaustion during chronic infections and cancer (Alfei et al., 2019; Khan et al., 2019; Scott et al., 2019; Seo et al., 2019; Yao et al., 2019). Despite these previous studies, the precise sequence of events that leads to the developmental ontogeny of Tex versus Teff and Tmp cells and subsequent memory remains poorly understood. Furthermore, the mechanism about how TCF-1 shapes Tex cell development remains unclear.
Here we address these questions about the ontogeny of Tex cells using a combination of single cell RNA-sequencing (scRNA-seq), computational modeling, lineage tracing and genetic perturbation to define the early developmental relationships that initiate the Tex cell lineage. ScRNA-seq revealed a molecular circuitry in which TCF-1 governed this early Tex cell fate decision during chronic infection at least in part by repressing an opposing cell fate of terminal Teff cells. TCF-1 antagonized the Teff cell-driving TFs, but positively regulated Eomes, and c-Myb. In the latter case, c-Myb then controlled a Bcl-2 dependent survival axis in Tex cells. Moreover, PD-1 expression protected this TCF-1+ precursor pool allowing subsequent formation of mature Tex cells. These analyses revealed molecular circuitry downstream of TCF-1 that functioned at a key fate decision point between the Tex precursor cells and terminal Teff cell branches of CD8 T cell differentiation. These data fill an important gap between the Tox-initiated epigenetic changes needed for exhaustion and establishment of fully differentiated Tex cells several weeks later. Moreover, these data suggest that a key mechanism by which TCF-1 promotes the Tex cell developmental program is by antagonizing robust activation involved in the terminal Teff cell differentiation program.
Results
Single cell RNA sequencing (scRNA-seq) reveals distinct subpopulations and transcriptional signatures of CD8 T cells early during chronic viral infection.
To interrogate the early population dynamics during chronic viral infection, we performed single cell RNA-sequencing (scRNA-seq) on LCMV DbGR33-41 specific P14 CD8 T cells isolated from naïve mice, or from mice on Day 8 (D8) after infection with acutely resolving LCMV Armstrong (Arm), the chronic LCMV clone 13 (Cl13) strain or from mice infected with Cl13 and depleted of CD4 T cells (Cl13△CD4) (Figure 1A). We identified 5 major clusters of responding LCMV-specific CD8 T cells (Figure 1B). Cluster 1 contained the majority of cells from D8 Arm, whereas cluster 5 contained almost exclusively naïve P14 cells (Figure 1C). D8 Cl13 and Cl13△CD4 P14 cells were distributed in clusters 2, 3 and 4 (Figure 1C).
Figure 1. scRNA-seq identifies distinct subpopulations of virus specific CD8 T cells during the early stages of chronic infection.

(A) Experimental design. CD45.2+ P14 cells were adoptively transferred into naïve CD45.1+ recipient mice (5 mice/group) followed by infection with LCMV-Arm, Cl13, or Cl13△CD4. On D8 p.i., P14 cells were sorted and indexed for scRNA-seq.
(B) tSNE clusters of cells from the scRNA-seq.
(C) Cell count of treatment groups across 5 clusters from 1B.
(D) Expression of representative genes in tSNE space.
(E) Gene ontology (GO) enrichment analysis across clusters 1-5. Bonferroni correction test performed and enrichment cutoff p<0.05.
(F) Pseudotime analysis using Monocle 2 across naïve, Cl13, and Cl13△CD4 P14 populations from D8 p.i. using a 513 exhaustion specific gene list (ESGs) from (Bengsch, et al. 2018). Predicted “Teff-like cells” and “Tex precursor cells” branches of the pseudotime trajectory. Distribution of clusters 2,3,4,5 from Figure 1B is shown.
(G) Expression of Tcf7, Gzmb, Havcr2 projected onto the pseudotime trajectory.
(H) Expression of Klrg1 and a Klrg1+ DiffGene signature (from Herndler-Brandstetter et al., 2018) projected onto the pseudotime trajectory or the scRNA-seq tSNE space from Figure 1 and onto the pseudotime trajectory.
(I) Expression of Entpd1 and Entpd1+Havcr2+ DiffGene and Tcf7+Pdcd1+ DiffGene signatures (from Sade-Feldman et al., 2018) projected onto the pseudotime trajectory.
Also see Figure S1.
We next examined the top 20 differentially expressed genes across the 5 clusters (Figure 1D and S1A). Cluster 5 expressed naïve markers such as Lef1, Il7r, Sell, Ccr7, Tcf7 and Bcl2 (Figure 1D and S1A) consistent with naïve CD8 T cells (Tn). Cluster 1 had high expression of Klrg1, Klrd1, Gzma, Gzmb, Id2 and Ccr2 (Figure 1D and S1A) in agreement with the preponderance of Arm-derived Teff cells in this cluster. This cluster also expressed Ifng and Tbx21, but to a similar extent as Clusters 3 and 4 (Figure 1D). Clusters 2, 3 and 4 all expressed Pdcd1 (encoding PD-1) consistent with enrichment of the D8 Cl13 and Cl13△CD4 P14 cells in these clusters. However, whereas clusters 3 and 4 displayed high Gzmb, cluster 2 was relatively depleted of this gene. Cluster 4 was enriched for cell cycle genes such as Ccnb2, Cks1b, Cenpa, Cdk2 and Mki67 (Figure 1D and S1A). Cluster 3 contained genes encoding chemokines (Ccl3, Ccl4, Ccl5), Gzmb and other activation genes (e.g. S100a4, S100a6, Lgals1, Nkg7) and the inhibitory receptor Lag3 (Figure 1D and S1A). Cluster 2 was enriched for cells expressing Cxcr5, Tcf7 (encoding TCF-1) and Slamf6 (encoding Ly108) and relatively depleted of cells expressing Havcr2 (encoding Tim3). In addition, cluster 2 displayed expression of a subset of interferon-stimulated genes (ISGs) and transcriptional coordinators such as Batf, Id3, Tox, and Nr4a1 (Figure 1D and S1A). Cluster 1 and, to a lesser extent, cluster 3 enriched in gene ontology (GO) terms reflecting cell trafficking and effector functions, whereas cluster 2 showed preferential enrichment of “response to virus” likely reflecting ISGs (Figure 1E). Cluster 4 had strong enrichment for cell cycle related GO terms consistent with individual gene expression data and also with the notion of ongoing proliferation during the development of exhaustion (Doering et al., 2012; Wherry et al., 2007). Cluster 2 was of particular interest given the high co-expression of Pdcd1, Tcf7, Slamf6, Bcl2 and relative lack of Gzmb, Havcr2 and markers of cell cycle. This cluster is reminiscent of recently described TCF-1+ Tex progenitor cells in established exhaustion (Im et al., 2016; Utzschneider et al., 2016; Wu et al., 2016).
Developmental bifurcation of Tex precursor cells and Teff-like cells at the early stage of chronic infection
We next used these scRNA-seq data to infer predicted developmental relationships during chronic infection. We applied a list of exhaustion specific genes (ESGs; n=513 genes; (Bengsch et al., 2018)) and used Monocle-2 (Qiu et al., 2017) to perform pseudotime analysis on P14 cells from naïve mice, as well as D8 Cl13 and Cl13△CD4 infection. These analyses revealed a trajectory originating at Tn cells, but then bifurcating into two branches containing cells from early chronic infection (Figure 1F). We tentatively labeled the upper branch “Tex precursor cells” because this branch enriched for cells from cluster 2 above (Figure 1F) and displayed high Tcf7 expression (Figure 1G). The lower branch we termed “Teff-like cells” because cells in this branch enriched for cells from cluster 3 and 4 (Figure 1F) and had high expression of Gzmb and Havcr2 (encoding Tim3; Figure 1G). This branch also lacked Tcf7 (Figure 1G).
Although across the entire data set, Klrg1 expression was most prominent in cluster 1 containing the cells from Arm D8 (Figure S1A), the pseudotime branch with high Gzmb and Havcr2 expression had higher Klrg1 expression and enrichment of a KLRG1+ cell geneset (Klrg1+DiffGene generated from (Herndler-Brandstetter et al., 2018)) than the Tex cells precursor branch (Figure 1H and S1B). Detection among the Cl13 clusters (2, 3 and 4) was generally low (Figure S1B). However, projecting the Klrg1+DiffGene signature on the pseudotime trajectories, revealed higher representation of this transcriptional program in the Gzmb and Havcr2 branch and low expression in the Tcf7+ branch (Figure 1H).
Recent studies have defined CD39 or CD39 with Tim-3 as potential markers of terminal differentiation of T cells during chronic infection and cancer (Gupta et al., 2015; Sade-Feldman et al., 2018). Thus, we next examined Tim-3 (encoded by Havcr2) and CD39 (encoded by Entpd1) expression. The lower Teff-like cell branch in the pseudotime analysis from early chronic infection displayed high expression of Havcr2 (Figure 1G) and Entpd1 (Figure 1I). Furthermore, we generated a Havcr2+Entpd1+ DiffGene signature (Sade-Feldman et al., 2018). This Havcr2+Entpd1+ DiffGene signature was also more strongly enriched in clusters 3 and 4 compared to cluster 2 (Figure S1C) and in the lower Teff-like cell branch in the pseudotime analysis (Figure 1I). we also generated a Tcf7+Pdcd1+ DiffGene signature (Sade-Feldman et al., 2018) and found that this signature was strongly enriched in the “Tex precursor cell” branch (Figure 1I). Together, these data suggested a binary developmental bifurcation early in the formation of Tex precursor cells consisting of a divergence of a “Teff-like cell” branch and a distinct Tcf7+Pdcd1+ “Tex precursor cell” branch.
KLRG1+ Teff-like cells from chronic infection display a distinct molecular signature compared to PD-1+ Tex cells.
We next examined the relationship between Teff cells and developing Tex cells using flow cytometric analysis. Thus, we examined protein expression of KLRG1 (Joshi et al., 2007) and PD-1. At D8 p.i. of Arm, a robust population of KLRG1+ Teff cells was readily apparent as described (Joshi et al., 2007) (Figure 2A-2B). This KLRG1+ population was substantially reduced at D8 p.i. of Cl13 and Cl13△CD4 infections (Figure 2A-2B and S2A-S2B). Over the ensuing weeks, the KLRG1+ population gradually declined following Arm infection. In contrast, this population decreased precipitously during chronic infection with <5% of the P14 population expressing KLRG1 by D16 p.i. (Figure 2B and S2A-S2B). During developing chronic infection a clear population of PD-1+ cells was present at D8 p.i. and these cells were KLRG1− (Figure 2B and S2A-S2B) suggesting at least partially mutually exclusive expression of KLRG1 and PD-1 in this setting. Compared to Arm infection, the KLRG1+ cells from Cl13 infection at D8 p.i. had substantially higher expression of CD39 and Tim-3 in spleen (Figure 2C) and other organs (Figure S2C-S2D), consistent with the Teff-like cell branch in the pseudotime above. A KLRG1+CD39+ population was also detectable in TIL from CT26 tumors (Figure S2E-S2F).
Figure 2. Distinct cellular and molecular profiles of Teff-like and Tex precursor cells during chronic infection.

(A) Experimental design. 2.5 × 10³ CD45.2+ P14 cells were adoptively transferred into naïve CD45.1+ mice followed by infection with LCMV Arm, Cl13 or Cl13△CD4. Spleens analyzed at the indicated time points.
(B) KLRG1 and PD-1 expression at the indicated time points of Arm, Cl13 and Cl13△CD4 infections. Gated on donor P14 cells.
(C) Flow cytometry plots for CD39 and Tim-3 by KLRG1+ P14 cells from Arm versus Cl13 at D8 p.i.
(D) TCF-1 expression on D8 p.i. with Cl13 in P14 cells gated on KLRG1+CD39+ or KLRG1−PD-1+ subsets. Naïve CD8 T cells (endogenous CD62L+CD44−) displayed as a control.
(E) T-bet and Eomes expression assessed at D8 p.i. with Cl13 in P14 cells gated on KLRG1+CD39+, KLRG1−PD-1+TCF-1− or KLRG1−PD-1+ TCF-1+ subsets. Naïve CD8 T cells displayed as a control. The T-bet/Eomes ratio was calculated based on geometric MFI.
(F) IFNγ, TNF, CD107a and Granzyme B (Gzmb) expression assessed at D8 p.i. with Cl13 by P14 cells gated on the indicated subsets.
(G) The percentage of Ki-67+ cells in the in the indicated subsets of P14 cells was assessed at D8 and D12 p.i. with Cl13.
(H) Bcl-2 and Bim expression were assessed at D8 p.i. with Arm in the KLRG1+ P14 subset. Naïve CD8 T cells are displayed as a control. The ratio of Bcl-2/Bim was calculated based on geometric MFI.
(I) Bcl-2 and Bim expression were assessed at D8 p.i. with Cl13 p.i. in the indicated subsets of P14 cells. Naïve CD8 T cells are displayed as a control. The ratio of Bcl-2/Bim was calculated based on geometric MFI.
*P<0.05, **P<0.01, ***P<0.001, ****P<0.0001 versus control (two-tailed Student’s t-test or One-Way ANOVA). Data are representative of 2-6 independent experiments with at least 3 mice/group (mean±s.e.m.). Also see Figure S2-S3.
At D8 p.i. the KLRG1+CD39+ cells lacked TCF-1 and TCF-1 expression was exclusively found in the KLRG1−PD-1+ population (Figure 2D). We next divided the PD-1+ P14 cells into TCF-1+ and TCF-1− subpopulations and interrogated these subpopulations in more detail (Figure S2G). For example, whereas the KLRG1+CD39+ Teff-like cell population from chronic infection expressed the highest T-bet, expression of this TF was higher in PD-1+TCF-1− compared to PD-1+TCF-1+ cells (Figure 2E). In contrast, Eomes was the highest in the PD-1+TCF-1+ D8 P14 population, but lower in both the PD-1+TCF-1− and KLRG1+CD39+ populations. Furthermore, the T-bet/Eomes ratio was lowest in the PD-1+TCF-1+ population (Figure 2E). As expected, the KLRG1+CD39+ P14 cells displayed robust effector functions (Figure 2F). Between the two PD-1+ subpopulations, the PD-1+TCF1+ cells were the least efficient at elaborating cytokines, expressing granzyme B or degranulating (Figure 2F). A similar hierarchy was observed when in vivo proliferation was examined at D8 or D12 p.i. with the PD-1+TCF-1+ cells displaying the lowest Ki67 expression (Figure 2G).
KLRG1+ P14 cells generated early during chronic infection fail to persist long-term (Angelosanto et al., 2012). Thus, we examined expression of the anti- and pro-apoptotic molecules Bcl-2 and Bim. The KLRG1+ P14 population at D8 p.i with Cl13 infection had higher expression of both Bcl-2 and Bim compared to the KLRG1+ TEFF cells from Arm infection (Figure 2H). However, the KLRG1+ population from Arm infection had a substantially higher Bcl-2:Bim ratio (Figure 2H). Moreover, the KLRG1−PD-1+ subsets from D8 p.i. Cl13 had a considerably higher Bcl2:Bim ratio compared to the KLRG1+CD39+ cells (Figure 2I). Among the KLRG1−PD-1+ cells from Cl13 infection, the subpopulation that expressed TCF-1+ (using Ly108 as a surrogate (Figure S2H)) had the highest Bcl-2:Bim ratio among the subsets at D8 of Cl13 infection (Figure 2I). These patterns of transcription factor expression, effector function, proliferation and pro- and anti-apoptotic molecule expression were also observed in the Cl13△CD4 setting (Figure S3).
The low Bcl-2:Bim ratio in the KLRG1+ CD8 T cells from Cl13 infection suggested these cells may be more prone to cell death. Thus, we examined genome integrity using DAPI and gH2AX staining to identify cells with stable chromatin and nuclear structure, nuclear envelope blebbing and nuclear lamina de-association indicating pre-apoptosis, or apoptotic cells with complete co-staining of DAPI and nuclear lamina γH2AX (Figure S2I). At D8 p.i. of Cl13, KLRG1+CD39+ virus specific CD8 T cells had the highest proportion of apoptotic and pre-apoptotic cells followed by the KLRG1−PD-1+Ly108− (i.e. TCF-1−) cells. In contrast, the KLRG1−PD-1+Ly108+ (i.e. TCF-1+) subset had the highest proportion of non-apoptotic nuclei (Figure S2I). Together, these data suggest that KLRG1+ Teff-like cells found at the early stage of chronic infection are highly susceptible to cell death, consistent with the inability of these cells to persist long-term in vivo.
KLRG1+ Teff-like cells persist poorly during chronic viral infection compared to PD-1+ Tex cells.
To define the developmental relationship between the subsets described above, we conducted lineage-tracing experiments. We sorted KLRG1+CD39+, KLRG1−PD-1+Ly108− and KLRG1−PD-1+Ly108+ cells at D7 or D8 p.i. and adoptively transferred equal numbers of each subset into congenically distinct, infection-matched recipient mice (Figure 3A and S4D). At D8 post transfer (p.t.), progeny of KLRG1−PD-1+Ly108+ Tex precursor cells were considerably more numerous than cells derived from KLRG1+CD39+ or KLRG1−PD-1+Ly108− donor populations (Figure 3B), consistent with TCF-1 expression by this PD-1+Ly108+ subset (Utzschneider et al., 2016). However, when comparing the two D8 subsets that lacked TCF-1 expression, the KLRG1−PD-1+Ly108− population persisted significantly better than the KLRG1+CD39+ Teff-like cell population (Figure 3B). We also analyzed changes in differentiation state. Although both KLRG1− donor populations maintained high PD-1 expression (Figure S4A-S4B), neither of these subsets gave rise to appreciable numbers of KLRG1+ cells in this setting (Figure 3C and S4C). These data suggest that divergent fate commitment to Tex precursor cells versus KLRG1+ Teff cells had occurred prior to formation of the KLRG1−PD-1+Ly108− and KLRG1−PD-1+Ly108+ populations or that development of KLRG1+ cells was antagonized by D8 of chronic infection. Moreover, PD-1+Ly108+ cells were able generate PD-1+Ly108− cells, whereas the opposite was inefficient (Figure 3C and S4C). These developmental relationships were also observed for non-P14 DbGP33 tetramer+ CD8 T cells (Figure S4D-S4F). Thus, these lineage tracing experiments highlighted a major difference in durability of the three D8 virus-specific CD8 T cell populations generated during Cl13 infection and suggested that Tex precursor cells are distinct from KLRG1+ Teff-like cells.
Figure 3. Lineage tracing of subpopulations of Teff-like and Tex precursor cells in early chronic viral infection.

(A) Experimental design. 5 × 10³ CD45.2+ P14 cells were adoptively transferred into naïve CD45.1+ C57BL/6 recipient mice followed One day later by Cl13 infection. On D7 p.i. KLRG1+CD39+, KLRG1−PD-1+Ly108− or KLRG1−PD-1+Ly108+ P14 CD8 T cells were isolated and 3 × 10⁵ of each was adoptively transferred into infection-matched CD45.1+ recipient mice. Donor P14 cells were analyzed on D8 post transfer (p.t.).
(B) Flow cytometry plots and quantification of donor CD45.2+ DbGP33 tetramer+ P14 cells derived from the indicated subsets. Endogenous CD45.2− DbGP33 tetramer+ CD8 T cells shown as controls.
(C) Flow cytometry plots and quantification of splenic CD45.2+ donor P14 cells and host DbGP33 tetramer+ cells that are KLRG1+, Ly108−CD39+, or Ly108+CD39−. Note, there were too few KLRG1+CD39+ P14 cells for analysis on D8 p.i. (see part B).
*P<0.05, **P<0.01, ***P<0.001, ****P<0.0001 versus control (two-tailed Student’s t-test or One-Way ANOVA). Data representative of at least 3 mice/group (mean±s.e.m.). Also see Figure S4.
TCF-1 represses the Teff-like cell fate in early chronic infection and fosters establishment of a Tex cell population.
Recent studies have identified a key role for TCF-1 in established exhaustion and genetic deletion of TCF-1 resulted in loss of Tex cells, specifically during the post effector phase (Im et al., 2016; Utzschneider et al., 2016; Wu et al., 2016), suggesting a role for TCF-1 in the transition from the effector phase to exhaustion. However, how and when this TCF-1 dependent activity occurs is unclear. To investigate this question, we co-transferred equal numbers of congenically distinct WT (Tcf7flox/floxxCd4WT) and Tcf7flox/floxxCd4CRE P14 cells to recipient mice of a third congenic background followed by Cl13 infection (Figure 4A). Tcf7flox/floxxCd4CRE P14 mounted an initial response, but failed to seed a durable Tex cell pool (Figure 4B) as expected (Im et al., 2016; Utzschneider et al., 2016; Wu et al., 2016). Based on the scRNA-seq above, we next examined if the distribution of cells corresponding to the Teff-like versus Tex precursor cell branches identified in the pseudotime analysis was altered in the absence of TCF-1. Indeed, staining for markers of these two pseudotime-defined branches revealed a substantial shift in the absence of TCF-1, with fewer KLRG1−PD-1+ P14 cells and a substantially higher proportion of KLRG1+CD39+ or Tim-3+CD39+ P14 than observed for WT P14 cells in Cl13 infection (Figure 4C and 4D).
Figure 4. TCF-1 regulates the early fate bifurcation between Teff-like and Tex precursor cells.

(A) Experimental design. 1 × 10³ CD45.2+ Tcf7flox/flox×Cd4WT (WT) littermate control P14 and 1 × 10³ CD45.1+CD45.2+ Tcf7flox/flox×Cd4CRE(TCF-1cKO) P14 CD8 T cells were co-transferred into CD45.1+ naïve recipient mice followed by Cl13 infection. Splenocytes were isolated on the indicated days p.i. for analysis.
(B) Flow cytometry plots quantifying WT and TCF-1cKO P14 cells. The ratio of cells is plotted over time p.i.
(C) Flow cytometry plots and quantification of KLRG1+CD39+ and Tim-3+CD39+ subsets of responding P14 cells of each genotype on D8 p.i. with Cl13.
(D) Flow cytometry plots and quantification of the KLRG1−PD-1+ subset of responding P14 cells of each genotype on D8 p.i. with Cl13. Endogenous naïve CD8 T cells are used for controls.
(E) Experimental design. WT P14 CD8 T cells transduced with the indicated RVs were adoptively transferred to mice infected one day previously with Cl13. Donor RV reporter P14 cells were analyzed at the indicated time points.
(F) Flow cytometry plots and quantification of the indicated P14 cell subsets for the indicated RV groups on D8 p.i. with Cl13 p.i. Plots are gated on RV reporter+ (VEX+) P14 cells. VEX+ cell numbers were normalized to 1 × 10⁴ VEX+P14 cell engraftment according to the transduction efficiency on D2 p.i.
(G) Quantification of CD127 and PD-1 expression by P14 cells transduced with the indicated RVs at the indicated time points of Cl13 infection.
*P<0.05, **P<0.01, ***P<0.001, ****P<0.0001 versus control (two-tailed Student’s t-test). Data are representative of 3-4 independent experiments (mean±s.e.m.) with at least 4 mice/group. Also see Figure S5.
We next investigated how enforced TCF-1 expression impacted early population dynamics. The p45 isoform has a β-catenin binding domain (Ioannidis et al., 2001) that could influence function (Anastas and Moon, 2013), whereas the p33 isoform lacks this domain. Thus, we expressed TCF-1 p33 or TCF-1 p45 in P14 cells in vivo using retroviral (RV) expression (Figure 4E and S5A) as described (Kurachi et al., 2017). RV expression of either TCF-1 isoform repressed the formation of KLRG1+CD39+ or Tim-3+CD39+ P14 cells at D8 p.i. with Cl13. Moreover, enforced expression of either TCF-1 p33 or TCF-1 p45 increased the proportion of Ly108+CD39− P14 cells upon (Figure 4F). As chronic infection progressed, the p33 isoform displayed stronger repression of KLRG1 or CD39 expression (Figure S5B) whereas the p45 isoform more efficiently promoted CD127 and CXCR5 expression (Figure 4G and S5B). Both TCF-1 isoforms also promoted PD-1 expression (Figure 4G) at D15, a time point corresponding to the developmental transition between the effector phase and early establishment of exhaustion (Angelosanto et al., 2012; Crawford et al., 2014; Doering et al., 2012; Schietinger et al., 2016). Moreover, the p45 isoform appeared to more efficiently foster durability of the Tex cell population in established chronic infection (Figure S5C-S5F). A similar effect of TCF-1 expression was observed in the ΔCD4 setting (Figure S5G-S5H). Together these data underscore the importance of TCF-1 in T cell exhaustion. However, these experiments also further reveal a major role for TCF-1 in repressing the more terminal Teff-like cell branch early during the development of exhaustion.
PD-1 supports development of the TCF-1+ Tex precursor cell population early during chronic infection
High expression of PD-1 is emblematic of terminal Tex cells, whereas intermediate PD-1 is expressed by the progenitor Tex cell population (Blackburn et al., 2008). In the established Tex cell pool, the expression of PD-1 is negatively correlated with TCF-1 (Im et al., 2016) in contrast to the high Pdcd1 expression in the Tcf7 cluster revealed by the sc-RNA-seq above (Figure 1D and S1A). Indeed, in established chronic infection the TCF-1+ Tex cell population had lower PD-1 expression than the TCF-1− subset (Figure 5A) though this amount of PD-1 was still higher than that expressed by Tmem cells (data not shown). In contrast, in early chronic infection (D8 p.i.), TCF-1+ P14 cells expressed high PD-1 (Figure 5A). This contrasts D8 Arm where PD-1 expression is already low (Barber et al., 2006; Wherry et al., 2007). Thus, we next tested whether PD-1 had a role in these CD8 T cell subsets in early chronic infection. Congenically distinct Pdcd1−/− and WT P14 cells were co-adoptively transferred followed by Cl13 infection (Figure 5B) as described (Odorizzi et al., 2015). This approach revealed a substantial increase in KLRG1+CD39+ or Tim-3+CD39+ cells (Figure 5C) and reduction in the TCF-1+ subset at D8 p.i. in the absence of PD-1 (Figure 5D and Figure S6A-S6B). These data are consistent with the observation that absence of PD-1 results in the erosion of the Tex cell population over time (Odorizzi et al., 2015). Thus, PD-1 is important to preserve the TCF-1+ Tex precursor cell population and repress the formation of the terminal Teff-like cell subset in early chronic infection.
Figure 5. PD-1 maintains the TCF-1+ Tex precursor cell population at the early stage of chronic infection.

(A) Flow cytometry plots of TCF-1 and PD-1 expression by responding P14 cells at the indicated days of Cl13 infection. PD-1 MFI of TCF-1− (black) and TCF-1+(red) subsets of P14 cells is shown in the flow cytometry plots and summary data below.
(B) Experimental design. 5 × 10² CD45.2+ WT P14 and 5 × 10² CD45.1+CD45.2+ Pdcd1−/− P14 cells were co-adoptively transferred into CD45.1+ naïve recipient mice followed by Cl13 infection. Responding P14 cells from the spleen analyzed on D8 p.i. with Cl13.
(C) Flow cytometry plots and quantification of KLRG1+CD39+ or Tim-3+CD39+ subsets of responding WT or Pdcd1−/− P14 cells on D8 p.i.
(D) Flow cytometry plots and quantification of TCF-1+CD39− subsets of responding WT or Pdcd1−/− P14 cells on D8 p.i.
*P<0.05, **P<0.01 versus control (two-tailed Student’s t-test). Data are representative of 2-4 independent experiments (mean±s.e.m.) with at least 3 mice/group. Also see Figure S6.
State Transition Inference Prediction (STIP) identifies transcriptional circuits downstream of TCF-1 in Tex cells.
To begin to understand how TCF-1 might be involved in early events in the establishment of CD8 T cell exhaustion, we developed a computational approach for inferring transcriptional circuits. This approach uses a selected pseudotime trajectory, anchors on a TF of interest, in this case Tcf7 and then correlates expression of other transcriptional regulators with Tcf7 across the pseudotime trajectory. Thus, sets of TFs are identified that are correlated and anti-correlated with Tcf7 as well as those key TFs that change dynamically specifically at the major inflection point of change in Tcf7 expression. Using scRNA-seq data, this latter feature may reveal transcriptional circuits working coordinately or in opposition specifically at transitions between cell states. One advantage of this approach, termed, State Transition Inference Predictor (STIP) is that it overcomes some limitations of lowly expressed genes by using correlation coefficients rather than absolute gene expression (see Methods). Thus, applying STIP to the data above, Tcf7 expression underwent a monotone increase allowing anchoring on this gene for analysis (Figure 6A). Several TF genes including Tox, Id3, Eomes, Myb and Nr4a1 were positively correlated with Tcf7 (Figure 6B). In contrast, Id2 was strongly anti-correlated with Tcf7. We then examined an extended list of TFs (Figure 6C). Two major clusters of TFs emerged including one containing Id3, Eomes, Myb, Batf, Irf4, Tox Nr4a1 and Hif1α that was positively correlated with Tcf7 over the pseudotime trajectory and a second cluster containing Id2, Runx1, Prdm1, Tbx21, Irf1 and Irf8 that was negatively correlated with Tcf7. In addition to these two major clusters, several TF genes including Smad7, Gata3, Runx2 and Zeb2 occupied an intermediate location in the pseudotime trajectory around the point of greatest change for Tcf7 and Id2 perhaps reflecting a metastable state or additional (perhaps transient) population heterogeneity (Figure 6C).
Figure 6. State Transition Inference Prediction (STIP) identifies transcriptional circuits downstream of TCF-1.

(A) Pseudotime trajectory across naïve P14 cells and P14 cells from D8 of Cl13 and Cl13△CD4 infections. PCA space created using the ESGs from Figure 1. The line represents the longest lineage trajectory predicted by TSCAN (Z. Ji and H. Ji, 2016).
(B) Expression of Tcf7 and other indicated TFs is plotted over pseudotime.
(C) A heatmap is shown displaying TF expression across the pseudotime trajectory.
(D) A Tcf7 centered network was generated (see Methods). Border color for each gene represents the mRNA-expression relationship with Tcf7 (e.g. positively (orange) or negatively (blue) correlated with Tcf7 or neither (purple)). Fill color indicates the presence of Tcf7 binding motif(s) in the open chromatin of the indicated TFs in naïve only (cyan), naïve and Cl13 (dark blue) or Cl13 only (red).
To further interrogate how TCF-1 might regulate the TFs identified by STIPs in Tex cells, we constructed a transcriptional network (Figure 6D). We used existing Assay for Transposase Accessible Chromatin using sequencing (ATAC-seq) data (Sen et al., 2016) and identified TF encoding genes containing a predicted TCF-1 motif in open chromatin regions. We identified TFs predicted to be regulated by TCF-1 in Tn cells only (e.g. Ikzf1, Gata3), in Tn cells and early Tex precursor cell populations (e.g. Myb, Hif1a, Eomes, Id3, Prdm1) or only in early Tex precursor cell populations (e.g.Id2, Tox, Zeb2, Smad7, Batf, Nfatc1) (Figure 6D). Notably, TCF-1 was predicted to repress genes including Id2, Prdm1, and Runx1 that are involved in Teff cell differentiation and to promote expression of genes such as Eomes, Batf, and Nfatc1 that have been implicated in fostering exhaustion (Figure 6D). TCF-1 may also have more complex regulatory connection to Smad7 and Zeb2, because the greatest change in expression of these genes occurred at the transition of greatest change in Tcf7 (Figure 6C-6D). Thus, these data suggested a key role for TCF-1 in coordinating transcriptional circuitry at time points corresponding to the formation of precursors of Tex cells.
TCF-1 mediates a T-bet and Eomes transition during chronic infection.
Previous studies identified roles for T-bet and Eomes in progenitor and terminal Tex cell subsets (Paley et al., 2012), and genetic deletion of T-bet, Eomes or TCF-1 results in a collapse of the mature Tex cell population (Im et al., 2016; Paley et al., 2012; Utzschneider et al., 2016). However, the relationship between these three TFs remains to be defined. Based on the data above and a known connection between TCF-1 and Eomes in Tmem cells (Zhou et al., 2010), we hypothesize that TCF-1 might regulate T-bet and/or Eomes in developing Tex precursor cells. At D8 of chronic infection, a subpopulation of TCF-1+ virus-specific CD8 T cells was identifiable that expressed Eomes (Figure 7A). Moreover, these TCF-1+ Tex precursor cells expressed slightly lower T-bet than the TCF-1− population (Figure 7A and 2E). Similar patterns were observed for tumor infiltrating CD8 T cells at D8 in mouse CT26 tumors (Figure 7B). Genetic deletion of TCF-1 reduced Eomes expression at D8 of Cl13 infection (Figure 7C). In contrast, although the percentage of T-bet+ cells decreased, the amount of T-bet per cell (MFI) was moderately increased in the absence of TCF-1 (Figure 7C). These data suggested that TCF-1 was upstream of Eomes, but had only minimal effect on T-bet at this time point. Indeed, enforced TCF-1 expression, and in particular TCF-1 p45, promoted increasing EomesGFP expression and also fostered increased Eomes mRNA expression (Figure 7D-7F and S7A).
Figure 7. TCF-1 regulates distinct molecular modules during Tex cell development.

(A) Flow cytometry plots of TCF-1 and Eomes or TCF-1 and T-bet co-expression in P14 CD8 T cells on the indicated days of Cl13 infection. Quadrant gates were set using CD44− naïve T cells (T-bet−Eomes−TCF-1+) for each time point.
(B) Flow cytometry plots of TCF-1 and Eomes or TCF-1 and T-bet co-expression in tumor infiltrating CD44+CD8 T cells (TILs) at D8 post CT26 tumor inoculation. Quadrant gates were set based on CD62L+CD44− naïve T cells (T-bet−Eomes−TCF-1+) from spleen. Quantification of T-bet and Eomes MFI of TCF-1+ or TCF-1− TILs show on the right.
(C) Flow cytometry plots and quantification of Eomes and T-bet expression in WT or TCF-1cKO P14 cells at D8 p.i. with Cl13.
(D) Flow cytometry plots of GFP expression from EomesGFP reporter P14 cells transduced with in empty, TCF-1-p33 or TCF-1-p45 RVs on D8 p.i. with Cl13. Plots gated on VEX+ P14 cells (see Figure S7A for gating).
(E) Quantification of Eomes-GFP+ cells in the RV transduced (VEX+) P14 donor population for the indicated RV constructs on the indicated days p.i. Both percent and numbers are shown. Cell numbers are normalized to 1 × 10⁴ VEX+ P14 cell engraftment according to VEX+ transduction efficiency on D2 p.i. (Figure S7A).
(F) Eomes mRNA expression is shown for P14 cells transduced with empty, TCF-1-p33 or TCF-1-p45 RVs. VEX+ (i.e. transduced) P14 cells were sorted by flow cytometry on D8 Cl13 p.i. and Eomes mRNA measured by qRT-PCR.
(G) Myb mRNA and c-Myb protein expression were examined by qRT-PCR and Western blot in purified WT and TCF-1 cKO P14 cells isolated from spleens of co-transferred mice on D8 p.i. with Cl13.
(H) Flow cytometry plots and quantification of Bcl-2 expression in WT versus TCF-1 cKO P14 cells on D8 p.i. with Cl13. Gated on donor P14 cells of each genotype. Naïve control is gated on endogenous CD44−CD8 T cells.
(I) Myb mRNA expression in sorted WT P14 cells transduced with empty, TCF-1-p33 or TCF-1-p45 RVs D8 p.i. with Cl13. Transduced cells were sorted based on VEX expression.
(J) Flow cytometry plots and quantification of Ly108+CD39− and Tim-3+CD39+ subsets of responding P14 cells transduced with empty versus c-Myb RVs. Plots are gated on transduced (VEX+) donor P14 cells on D8 p.i. with Cl13. VEX+ cell numbers were normalized to 1 × 10⁴ VEX+P14 cell engraftment according to the transduction efficiency on D2 p.i.
*P<0.05, **P<0.01, ***P<0.001, ****P<0.001 versus control (two-tailed Student’s t-test and One-Way Anova analysis). Data are representative of 2 independent experiments (mean±s.e.m.) with at least 3 mice/group. Also see Figure S7.
To further interrogate the role of Eomes in Tex cells, we crossed EomesWT or Eomesflox/flox mice to CREERT2 P14 mice on a Rosa26LSL-YFP reporter background. We used EomesWT×CREERT2×Rosa26LSL-YFP (Eomes WT) and Eomesflox/flox×CREERT2×Rosa26LSL-YFP inducible conditional deletion of Eomes on different congenic backgrounds in a co-adoptive transfer experimental design. We then induced Eomes deletion using tamoxifen treatment between D9-D13 p.i. (Figure S7B). Prior to tamoxifen treatment, EomesWT×CREERT2×Rosa26LSL-YFP or Eomesflox/flox×CREERT2×Rosa26LSL-YFP P14 cells were present at a 1:1 ratio (Figure S7C). After tamoxifen delivery there was efficient CRE activity as indicated by the Rosa locus YFP reporter (Figure S7D). However, 98%+ of the YFP+ cells were from the WT donor cells with almost no Eomes inducibly deleted P14 cells surviving after tamoxifen treatment (Figure S7E). These data are consistent with our previous studies demonstrating that constitutive deletion of Eomes compromises the development of Tex cells (Paley et al., 2012), but extend this earlier work to indicate that even after establishment of Tex precursor cells, Eomes has a critical role in the durability of this cell type. Moreover, these data indicate that a likely essential function of TCF-1 in Tex precursor cells is to mediate Eomes expression.
We next examined the role of T-bet. RV-mediated T-bet expression fostered development of KLRG1+CD39+ Teff-like cells at D8 of Cl13 infection, though the Ly108+CD39− Tex precursor cell population was unchanged (Figure S7F). RV enforced expression of T-bet decreased expression of PD-1, Lag-3, and CD127 at this time point, but promoted expression of Tim-3 (Figure S7G), consistent with previous studies (Kao et al., 2011). Thus, during the early phases of establishing Tex cells, T-bet may promote Teff cell differentiation consistent with the role of this TF in acute infection (Joshi et al., 2007).
TCF-1 enhances Bcl-2 expression via c-Myb in Tex cells during chronic infection
In Tmem cells c-Myb regulates Bcl-2 expression and promotes Tmem cell survival (Z. Chen et al., 2017). To test whether c-Myb might also have a role in Tex cells and and test a role for TCF-1, we used the Tcf7flox/floxxCd4CRE versus Tcf7flox/floxxCd4WT P14 co-transfer model. In this setting c-Myb mRNA and protein was reduced in the absence of TCF-1 at D8 of Cl13 infection (Figure 7G). This reduced c-Myb expression corresponded to decreased Bcl-2 expression in the absence of Tcf7 (Figure 7H). Conversely Myb mRNA expression was induced by the p45, but not the p33 isoform of TCF-1 (Figure 7I). Furthermore, RV expressed c-Myb significantly increased the proportion of the Tex precursor cells (Ly108+CD39−) and reduced expression of CD39 and Tim-3 (Figure 7J), suggesting that c-Myb antagonized the Teff-like cell-branch of differentiation and fostered the establishment of Tex precursor cell population. Although overall cell numbers were not changed with enforced c-Myb expression (Figure S7H-S7I), there was a bias to fostering the Ly108+CD39− subset at the expense of the Tim-3+CD39+ subset (Figure S7I). Thus, these data identify an early fate bifurcation in the establishment of the Tex precursor cell population and point to a TCF-1-related transcriptional network and TCF-1 as a key regulator necessary to antagonize an early Teff-like cell population during chronic infection and support the Tex cell developmental path.
Discussion
In established Tex cells, the population dynamics and roles of specific transcription factors are beginning to be defined. However, the early events that form precursors of Tex cells and the relationship of these Tex precursor cells to other effector phase populations have remained poorly understood. We addressed this question and identified a fate bifurcation that distinguished early Tex precursor cells from Teff-like cells that are generated during chronic infection. Moreover, we demonstrated that the Teff-like cell population in early chronic infection was more activated than the corresponding Teff-like cell population during acute infection and survived poorly. These studies also defined transcriptional circuits centered on TCF-1 that repressed the Teff-like cell developmental path and fostered the formation of Tex precursor cells. These data are analogous to roles of TCF-1 in repressing terminally differentiated cells in other settings (Lin et al., 2015; 2016). However, our current data extend this role for TCF-1 to the setting of early chronic infection and initiation of T cell exhaustion. PD-1 plays a critical role at this stage of Tex cell development by protecting the TCF-1+ Tex precursor cells and ensuring these cells can seed the long-term Tex cell pool. Moreover, we identified downstream transcription factors, including Eomes and c-Myb through which TCF-1 acted in this early development of Tex precursor cells.
The strong co-expression of TCF-1 and PD-1 at D8 of chronic infection contrasts the relationship between PD-1 and TCF-1 in established Tex cells. Our studies indicate that PD-1 is required to preserve the TCF-1+ Tex precursor cell population at this early time point. One possible mechanism for this early connection between PD-1 and TCF-1 is attenuation of TCR and/or CD28 signaling by PD-1 (Adams et al., 2016; Kamphorst et al., 2017; Lin et al., 2015) to prevent loss of TCF-1 expression. Another possibility is that TFs downstream of PD-1 could influence TCF-1 expression. Previous studies have identified BATF downstream of PD-1 (Quigley et al., 2010), and BATF was positively correlated with TCF-1 in the STIP analysis. However, the same analysis predicts BATF may also be downstream of TCF-1 in Tex precursor cells. Thus, it is possible that a PD-1-BATF-TCF-1 feedback circuit exists in the Tex precursor cell pool. How such a circuit would be related to the Teff cell promoting role of BATF at early times after T cell activation (Kurachi et al., 2014) remains unclear.
Recent studies have identified Tox as a factor that progressively programs the epigenetic landscape of Tex cells over the first several weeks of chronic antigen stimulation (Alfei et al., 2019; Khan et al., 2019; Scott et al., 2019; Seo et al., 2019; Yao et al., 2019). In this context, our data suggest the following model. Early, during the first 1-2 weeks of infection or chronic antigen exposure, TF like T-bet, Id2 and others promote terminal Teff cell differentiation by operating in the context of an “effector” or early activation epigenetic landscape. TCF-1 functions to antagonize this terminal Teff cell differentiation, perhaps in part through restraining cell cycle and/or promoting expression of TF like Eomes that may blunt the activity of T-bet. PD-1 may complement this activity by helping to preserve the TCF-1+ subset. This role of TCF-1 and PD-1 early may then allow sufficient time for the Tox-dependent epigenetic remodeling towards mature Tex cells to occur over the first 1-2 weeks of chronic antigen exposure. One could then consider that the previous role of TFs such as T-bet in established exhaustion (Doering et al., 2012; Kao et al., 2011; Paley et al., 2012) may manifest differently than the effector-phase role because at these later time points these TF are operating in an exhaustion epigenetic landscape rather than an effector epigenetic landscape. Such a model would explain the temporally distinct roles of T-bet in promoting expression of genes like Havcr2 (encoding Tim-3) early in infection while repressing expression of Tim-3 in established exhaustion (Kao et al., 2011). Although the studies presented here help clarify these early fate decisions in establishing Tex cells, it will be important in the future to further investigate the developmental relationships and TF cascades in the later stages of exhaustion.
Together these studies identify the early events in initially establishing the Tex branch of CD8 T cell differentiation during chronic infection. Key features of this model were also observed in tumor models. We identified an early role for TCF-1 and defined the transcriptional circuitry linked to TCF-1 at this time point. These data extend our understanding of the role of TCF-1 in established exhaustion to the initial formation of Tex precursor cells. Moreover, our data indicate that Teff and Tex are dichotomous branches of CD8 T cell differentiation in settings of chronic antigen stimulation. The data presented here are consistent with studies demonstrating that Tex cells in humans are the major population in tumor infiltrating lymphocytes (TIL), are the major cell type responding to PD-1 blockade and are distinct from Teff even after PD-1 blockade mediated reinvigoration (Bengsch et al., 2018; Guo et al., 2018; Huang et al., 2019; 2017; Zhang et al., 2018; Zheng et al., 2017). Thus, these findings highlight the distinction between Teff and Tex cells, define underlying molecular mechanisms for this distinction, and may have implications for which types of T cells are optimal targets for immunotherapy for cancer and other chronic diseases.
STAR★Methods
LEAD CONTACT AND MATERIALS AVAILABILITY
Further information and requests for resources should be directed to and will be fulfilled by the Lead Contact, E.John Wherry (wherry@pennmedicine.upenn.edu).
METHOD DETAILS
Mice
Pdcd1−/− (Odorizzi et al., 2015), EomesGFP (Paley et al., 2013), Tcf7flox/flox (Weber et al., 2011) and Eomesflox/flox (Intlekofer et al., 2008) mice have been described. Cd4CRE and Rosa26-CREERT2 mice were purchased from Jackson Laboratory. Tcf7flox/flox mice were bred to Cd4CRE mice and TCR transgenic P14 C57BL/6 mice (TCR specific for LCMV DbGP33–41). Eomesflox/flox mice were bred to Rosa26-CREERT2 mice and TCR transgenic P14 C57BL/6 mice. Pdcd1−/− and EomesGFP mice were bred to TCR transgenic P14 C57BL/6 mice. 6-8 week-old C57BL/6 Ly5.2CR (CD45.1) or C57BL/6 (CD45.2) mice were purchased from NCI. Both male and female mice were used. All mice were used in accordance with Institutional Animal Care and Use Committee guidelines for the University of Pennsylvania.
Virus infection and tumor challenge experiments
Mice were infected intraperitoneally (i.p.) with 2 × 10⁵ plaque-forming units (PFU) LCMV Armstrong or intravenously (i.v.) with 4 × 10⁶ PFU LCMV Cl13. The mice of Cl13△CD4 group received 200μg GK1.5/mouse i.p. treatment on day −1 and day 1 post Cl13 infection. The mice of inducible genetic deletion group received 2mg tamoxifen/mouse i.p. everyday on day9 to day13 post Cl13 infection. For tumor studies, 2 × 10⁵ CT26 cells were subcutaneously injected into BALB/C mice. Established CT26 tumors (D8 post transfer) were excised and processed for flow cytometry as described (Knight et al., 2016). In brief, tumors were digested with 1 mg/ml collagenase D and 0.02 mg/ml DNasel at 37°C.
Cell culture and in vitro stimulation
CD8 T cells were purified from spleens by negative selection using EasySep Mouse CD8+ T Cell Isolation Kit (STEMCELL Technologies) according to manufacturer’s instructions. Cells were stimulated with 100 U/mL recombinant human IL-2, 1 μg/mL anti-mouse CD3ε , and 5 μg/mL anti-mouse CD28 in RPMI-1640 medium with 10% fetal bovine serum (FBS), 10mM HEPES, 100 μM non-essential amino acids (NEAA), 50 U/mL penicillin, 50 μg/mL streptomycin, and 50 μM β-mercaptoethanol.
Retroviral vector (RV) experiments
The TCF-1 p33 (MR226713) cDNA clone was obtained from OriGene and the TCF-1 p45 cDNA clone was extended from the TCF-1 p33 cDNA using PCR. TCF-1 p33 or TCF-1 p45 cDNA were cloned into the MSCV-IRES-VEX plasmid. The c-Myb RV was constructed as described (Z. Chen et al., 2017). The T-bet RV was constructed as described(Kao et al., 2011). RVs were produced in 293T cells with MSCV and pCL-Eco plasmids using Lipofectamine 3000. RV transduction was performed as described (Kurachi et al., 2017). Briefly, CD8 T cells were purified from spleens of P14 mice using EasySep™ Mouse CD8+ T Cell Isolation Kit. After 18-24 hrs of in vitro stimulation, P14 cells were transduced with RV in the presence of polybrene (0.5 μg/ml) during spin infection (2,000 g for 60 min at 32°C) following incubation at 37°C for 6 hrs. RV-transduced P14 cells were adoptively transferred into recipient mice that were infected 24 hrs prior to transfer.
Flow cytometry and sorting
For mouse experiments, tissues were processed, single cell suspensions obtained, and cells were stained as described (Wherry et al., 2003). Mouse cells were stained with LIVE/DEAD cell stain (Invitrogen) and with antibodies targeting surface or intracellular proteins. Intracellular cytokine staining was performed after 5 hrs ex vivo stimulation with GP33-41 peptide in the presence of GolgiPlug, GolgiStop and anti-CD107a. After stimulation, cells were stained with surface antibodies, followed by fixation with Fixation/Permeabilization Buffer and then stained with intracellular antibodies for TNF, IFN-γ and GrzmB using Permeabilization Wash Buffer according to manufacturer’s instructions. Flow cytometry was performed with an LSRII. Cell sorting experiments were performed with a BD-Aria sorter, with 70 micron nozzle and a 4°C circulating cool-down system.
Single cell RNA sequencing
P14 cells from spleens of naïve or infected mice were isolated using EasySep™ Mouse CD8+ T Cell Isolation Kit. Cells were double-sorted for the CD8 CD45.2+(P14+) population into 1.5 ml Lo-Bind Eppendorf tubes with complete RPMI (10% FBS). 2 × 10⁴ P14s were collected and washed with PBS twice before loading to a Chromium single cell sorting system (10× Genomics). Library construction was performed following the protocol of Chromium Single Cell 3’ Library system, with a standard loading targeting 5 × 10³ cells recovered. The final pooled library with 4 samples (Naïve, Arm, Cl13 and Cl13△CD4) was sequenced on a NextSeq 500 using 1 pair-end high throughput FlowCell.
RNA isolation and qPCR
Total RNA was isolated using RNeasy micro kit from QIAGEN. QRT-PCR was performed using iTaqTM Universal SybrGreen Supermix from BioRad on the ViiA™ 7 Real-Time PCR System according to manufacturer’s instructions.
Western blot
Cells were lysed in RIPA buffer and processed as described (Z. Chen et al., 2017). Blots were stained for c-Myb (1:200 for antibody staining for 1 hr at room temperature) and actin (1:5000 for secondary staining for 1hr at room temperature). Western blots were quantified by ImageJ.
Immunofluorescence
Cells were fixed in 4% paraformaldehyde in PBS for 30min at room temperature. After two PBS washes, cells were permeabilized with 0.5% Triton X-100 in PBS for 10min, followed by two additional PBS washes. Cells were then blocked in 10% BSA in PBS for 1h at room temperature, and were incubated with γH2AX antibodies (Abcam, ab2893, 1:200 or Millipore, 05-636, 1:100) in 5% BSA in PBS supplemented with 0.1% Tween 20 (PBST) overnight at 4°C. The next day, cells were washed 4× 10min with PBST, and then incubated with Alexa Fluor 647-conjugated secondary antibody in 5% BSA/PBST for 1h at room temperature, followed by 4× 10min washes with PBST. Cell were then stained with 1μg/ml DAPI for 5min and washed twice with PBS. The coverslip were mounted with ProLong Gold, and imaged with Leica TCS SP8 fluorescent confocal microscope (63X).
Computational analysis of single cell RNA sequencing data
Data processing:
Raw sequencing files were aligned to the mouse mm10 genome using Cell Ranger software (10x Genomics). Mitochondrial genes were removed and cells that had positive read counts of at least 1000 genes were retained. Scran (Lun et al., 2016) was used to normalize the raw gene expression counts and normalized expression values were used throughout the analysis.
ScRNA-Seq analysis:
MAST (Finak et al., 2015) was used to perform differential analysis comparing gene expression of two cell clusters. GAM (in R package VGAM (Yee, 2015)) was used to fit the gene expression along a pseudotime trajectory. A Tobit family (lower threshold=0.1) was used to account for potential dropout events. To determine whether expression of a gene changed significantly along the pseudotime trajectory, a likelihood ratio test was performed comparing the full model with an intersect-only null model. FDRs were calculated for p-values of the likelihood ratio tests. A gene with FDR < 0.05 was determined to have differential expression along the pseudotime axis. Packages for pseudotime analysis include Monocle-2 (Qiu et al., 2017), TSCAN (Z. Ji and H. Ji, 2016) and STIP (http://github.com/zji90/STIP). Briefly STIP functions as follows: Given a pseudotime trajectory and gene expression profiles, STIP first extracts the TFs for which expression changes significantly along the pseudotime trajectory. Expression of each gene is then standardized to have a mean of zero and variance of one across all cells. For each gene STIP then calculates the pseudotime point at which the standardized expression is zero (zero point). Only genes that have 1 or 2 zero points are retained. Finally it reorders genes based on expression patterns (monotone increasing, single peak, monotone decreasing) and the occurrence of the zero point within each pattern. One can then compare the correlations between different genes with a selected anchor gene (Tcf7 in this study).
ATAC-Seq and Network Analysis:
Open chromatin regions for each sample (Naïve and D8 Cl13 samples as described (Sen et al., 2016)) were determined by peak calling using macs2v2.1.1 “callpeak” function at a q value of 0.01. For each peak identified, TF binding sites were scanned using the FIMO algorithm in the 100 bp centered around the summit of the peak, the TF motifs were obtained for MOUSE transcription factors (core) from HOCOMOCO V11 mouse. TF binding sites in these enhancers were linked to corresponding promoters/genes that were defined in a manner similar to the GREAT software, where each gene is assigned a basal regulatory domain that is defined as the promoter region and extended in both directions to the nearest gene basal domain but no more than 1000kb each direction. Network analysis was visualized using Cytoscape software(3.7.1).
Gene Ontology Analysis:
For each cluster, a GO analysis was conducted comparing the top 100 genes that were highly differentially expressed and all the other genes in the dataset. GO analysis was performed using DAVID with default parameters.
Gene index generation:
The Kirg1+DiffGene index was generated using bulk RNA-seq data (Herndler-Brandstetter et al., 2018). The comparison was between KLRG1+exKLRG1+ versus KLRG1−exKLRG1− groups. We selected the entire set of differentially expressed coding genes with the FDR<0.05. The Havcr2+Entpd1+ DiffGene index was generated using scRNA-seq (Sade-Feldman et al., 2018). The comparison was between the Havcr2+Entpd1+ and the Havcr2−Entpd1− groups. We selected the top 100 differentially expressed coding genes that were higher in the Havcr2+Entpd1+ group with an FDR<0.05. The Tcf7+Pdcd1+DiffGene index was generated using scRNA-seq (Sade-Feldman et al., 2018). The comparison was between the Tcf7+Pdcd1+ and the Tcf7−Pdcd1− groups. We selected the top 100 differentially expressed coding genes that were higher in the Tcf7+Pdcd1+ group with an FDR<0.05.
Statistical analysis
Statistical significance was calculated with unpaired two-tailed student’s t-test or one-way ANOVA with Tukey’s multiple comparisons test by Prism 7 (GraphPad Software). P values are reported in the figure legends.
Supplementary Material
KEY RESOURCES TABLE
| REAGENT or RESOURCE | SOURCE | IDENTIFIER |
|---|---|---|
| Mouse strains | ||
| C57BL/6 | Charles River | N/A |
| CD45.1+ C57BL/6 | Charles River | N/A |
| BALB/C | Charles River | N/A |
| TCRα−; P14 TCRVα2Vβ8 | The Jackson Lab | Stock No. 37394-JAX |
| Pdcd1−/− | (Odorizzi et al., 2015) | N/A |
| EomesGFP | (Paley et al., 2013) | N/A |
| Tcf7flox/flox | (Weber et al., 2011) | N/A |
| Eomesflox/flox | (Intlekofer et al., 2008) | N/A |
| Cd4CRE | The Jackson Lab | Stock No. 022071 |
| Rosa26-CREERT2 | The Jackson Lab | Stock No: 008463 |
| Flow cytometry reagents | ||
| Live/Dead Aqua Dye | Thermofisher | Cat#L34957 |
| Live/Dead Zombie NIR Dye | BioLegend | Cat#423106 |
| Anti-Mouse KLRG1(2F1) | BD Biosciences | Cat# 561619, RRID:AB_10898017 |
| Anti-Mouse CD127(A7R34) | BioLegend | Cat# 135016, RRID:AB_1937261 |
| Anti-Mouse CD8(53-6.7) | BioLegend | Cat# 100742, RRID:AB_2563056 |
| Anti-Mouse CD44(IM7) | BioLegend | Cat# 103059, RRID:AB_2571953 |
| Anti-Mouse CD45.1(A20) | BioLegend | Cat# 110724, RRID:AB_493733; Cat# 110716, RRID:AB_313505 |
| Anti-Mouse CD45.2(104) | BioLegend | Cat# 109828, RRID:AB_893350; Cat# 109823, RRID:AB_830788 |
| Anti-Mouse CD122(TM-b1) | Thermofisher | Cat# 48-1222-80, RRID:AB_2016628 |
| Anti-Mouse Ly108(330-AJ) | BioLegend | Cat# 134608, RRID:AB_2188093; Cat# 134605, RRID:AB_1659258 |
| Anti-Mouse Tim-3(RMT3-23) | BioLegend | Cat# 119721, RRID:AB_2616907 |
| Anti-Mouse CD39(24DMS1) | Thermofisher | Cat# 46-0391-80, RRID:AB_10717513 |
| Anti-Mouse PD-1(RMP1-30) | BioLegend | Cat# 109109, RRID:AB_572016 |
| Anti-Mouse TCF-1(S33-966) | BD Biosciences | Cat# 564217, RRID:AB_2687845 |
| Anti-Mouse TCF-1(C63D9) | Cell Signaling Technology | Cat# 14456, RRID:AB_2199302 |
| Anti-Mouse T-bet(4B10) | BioLegend | Cat# 644808, RRID:AB_1595479 |
| Anti-Mouse Eomes(Dan11mag) | Thermofisher | Cat# 50-4875-80, RRID:AB_2574226 |
| Anti-Mouse Ki67(16A8) | BioLegend | Cat# 652420, RRID:AB_2564285 |
| Anti-Mouse Bcl-2(A19-3) | BD Biosciences | Cat# 556537, RRID:AB_396457 |
| Anti-Mouse Bim(C34C5) | Cell Signaling Technology | Cat# 2933, RRID:AB_1030947 |
| Anti-Mouse CD107a(1D4B) | BioLegend | Cat# 121606, RRID:AB_572007 |
| Anti-Mouse TNFα(MP6-XT22) | BioLegend | Cat# 506328, RRID:AB_2562902 |
| Anti-Mouse IFNγ(XMG1.2) | BD Biosciences | Cat# 560661, RRID:AB_1727534 |
| Anti-Mouse Gzmb(GB11) | Thermofisher | Cat# GRB17, RRID:AB_2536540 |
| LCMV DbGP33 tetramer | NIH | Conjugated in house |
| LCMV DbGP276 tetramer | NIH | Conjugated in house |
| BD GolgiStop | Thermofisher | Cat# 554724 |
| BD GolgiPlug | Thermofisher | Cat#555029 |
| Foxp3 Transcription Factor Staining Buffer Kit | Thermofisher | Cat# A25866A |
| Experimental Models: LCMV | ||
| LCMV Clone13 (Cl13) | Rafi Ahmed | Grew up in house |
| LCMV Armstrong (Arm) | Rafi Ahmed | Grew up in house |
| Experimental Models: Tumor Cell Lines | ||
| CT26 | ATCC | Cat# CRL-2638, RRID:CVCL_7256 |
| Mouse treatment reagents | ||
| Anti-mouse CD4 Mab (GK1.5) | Bioxcell | Cat# BE0003-1 |
| Tamoxifen | Sigma-aldrich | Cat# T5648-1G |
| In vitro culture and retroviral transduction reagents | ||
| Recombinant human IL-2 | NIH | N/A |
| Anti-Mouse CD3(145-2C11) | BioLegend | Cat# 100302, RRID:AB_312667 |
| Anti-Mouse CD28(37.51) | Thermofisher | Cat# 16-0281-82, RRID:AB_468921 |
| LCMV peptide GP33-41 | NIH | N/A |
| EasySep™ Mouse CD8+ T Cell Isolation Kit | STEMCELL Technologies | Cat# 19853 |
| RPMI-1640 medium | Corning/Mediatech | Cat# 10-040-CV |
| HI Fetal Bovine Serum | Thermofisher | Cat# 26170-043 |
| HEPES | Thermofisher | Cat# 15630080 |
| Non-Essential Amino Acids | Thermofisher | Cat# 11140050 |
| Penicillin-Streptomycin | Thermofisher | Cat# 15140122 |
| β-mercaptoethanol | Sigma-Aldrich | Cat# M6250-500ML |
| Opti-MEM | Thermofisher | Cat# 31985088 |
| Polybrene | Sigma-Aldrich | Cat# TR-1003-G |
| Lipofectamine™ 3000 Transfection Reagent | Thermofisher | Cat# L3000001 |
| cDNA constructs | ||
| TCF-1 p33 cDNA | OriGene | MR226713 |
| TCF-1 p33 overexpression vector | In this paper | N/A |
| TCF-1 p45 overexpression vector | In this paper | N/A |
| c-Myb overexpression vector | Chen et al. 2017 | N/A |
| T-bet overexpression vector | In this paper | N/A |
| Empty-VEX retroviral vector | Kurachi et al. 2017 | N/A |
| Single cell RNA Sequencing | ||
| Chromium Single Cell 3’ Library & Gel Bead Kit v2 | 10× Genomics | Cat# PN-120267 |
| Chromium Single Cell A Chip Kit | 10× Genomics | Cat# PN-1000009 |
| Chromium i7 Multiplex Kit | 10× Genomics | Cat# PN-120262 |
| Dynabeads™ MyOne™ Silane | Thermofisher | Cat# 37002D |
| SPRIselect Reagent Kit | Beckman Coulter | Cat#B23318 |
| 10% Tween 20 | Bio-Rad | Cat#1610781 |
| Glycerin (glycerol), 50% (v/v) Aqueous Solution | Ricca Chemical Company | Cat# 3290-32 |
| KAPA NGS quantification kit | KAPABiosystems | Cat# KK4824 |
| NextSeq 500/550 High Output Kit v2.5 (150 Cycles) | Illumina | Cat# 20024907 |
| RT-QPCR | ||
| iTaq™ Universal SYBR® Green Supermix | Bio-Rad | Cat# 1725121 |
| Eomes Forward Primer GCGCATGTTTCCTTTCTTGAG |
In this paper | N/A |
| Eomes Reverse Primer GGTCGGCCAGAACCACTTC |
In this paper | N/A |
| c-Myb Forward Primer AGACCCCGACACAGCATCTA |
Chen et al. 2017 | N/A |
| c-Myb Reverse Primer CAGCAGCCCATCGTAGTCAT |
Chen et al. 2017 | N/A |
| GAPDH Forward Primer AGGTCGGTGTGAACGGATTTG |
Chen et al. 2017 | N/A |
| GAPDH Reverse Primer TGTAGACCATGTAGTTGAGGTCA |
Chen et al. 2017 | N/A |
| Western Blot | ||
| Anti-c-Myb (C19) | Santa Cruz, | Cat# sc-517, RRID:AB_2148017 |
| Anti-Actin | Sigma-Aldrich | Cat# A5316, RRID:AB_476743 |
| Immunofluorescence | ||
| Anti-γH2AX | Abcam | Cat# ab2893, RRID:AB_303388 |
| Anti-γH2AX | Millipore | Cat# 05-636, RRID:AB_309864 |
| Goat anti-Rabbit IgG (H+L) Highly Cross-Adsorbed Secondary Antibody, Alexa Fluor Plus 647 | Thermofisher | Cat# A32733, RRID:AB_2633282 |
| Goat anti-Mouse IgG (H+L) Highly Cross-Adsorbed Secondary Antibody, Alexa Fluor Plus 647 | Thermofisher | Cat# A32728, RRID:AB_2633277 |
| ProLong™ Gold Antifade Mountant | Thermofisher | Cat# P10144 |
| Computational analysis | ||
| Cell Ranger | 10× Genomics | https://support.10xgenomics.com/single-cell-gene-expression/software/pipelines/latest/installation |
| Scran | (Lun et al., 2016) | https://bioconductor.org/packages/release/bioc/html/scran.html |
| MAST | (Finak et al., 2015) | https://www.bioconductor.org/packages/release/bioc/html/MAST.html |
| VGAM | (Yee, 2015) | https://cran.r-project.org/web/packages/VGAM/index.html |
| Monocle-2 | (Qiu et al., 2017) | http://cole-trapnell-lab.github.io/monocle-release/docs/ |
| TSCAN | (Z. Ji and H. Ji, 2016) | https://www.bioconductor.org/packages/release/bioc/html/TSCAN.html |
| STIP | In this paper | http://github.com/zji90/STIP |
| The GREAT software | McLean et al. 2010. | http://great.stanford.edu/public/html |
| Cytoscapte(3.7.1) | Cytoscape | https://cytoscape.org |
| DAVID GO analysis (6.8) | LHRI | https://david.ncifcrf.gov/tools.jsp |
| Statistical Analysis | ||
| Prism 7 | GraphPad Software | N/A |
| Datasets | ||
| D8 p.i. single cell RNA Sequencingon P14 cells | In this paper | https://www.ncbi.nlm.nih.gov/geo/query/acc.cgi?acc=GSE131535 |
| D8 p.i. ATAC-Sequencing on P14 cells | Sen et al. 2016. | https://www.ncbi.nlm.nih.gov/geo/query/acc.cgi?acc=GSE87646 |
| Mouse TF motifs | HOCOMOCO V11 mouse | http://hocomoco11.autosome.ru |
| Klrg1+ DiffGene Index | Herndler-Brandstetter et al., 2018 | https://www.ncbi.nlm.nih.gov/geo/query/acc.cgi?acc=GSE110707 |
| Havcr2+Entpd1+ DiffGene index and Tcf7+Pdcd1+ DiffGene index | Sade-Feldman et al., 2018 | https://www.ncbi.nlm.nih.gov/geo/query/acc.cgi?acc=GSE120575 |
Highlights.
scRNA-Seq defines an effector versus exhausted CD8 T (Tex) cell fate decision.
TCF-1 plays a central role in initially establishing Tex precursor cells.
PD-1 supports the TCF-1+ Tex precursor cells at early phase of chronic infection.
Eomes and c-Myb play key roles in Tex cell persistence downstream of TCF-1.
Acknowledgement
We thank the Wherry lab for helpful discussions. This work was supported by NIH grants (AI105343, AI117950, AI082630, AI112521, AI115712, AI108545, CA210944) and Stand Up 2 Cancer to E.J.W.; NIH grant HG009518 to H.J.; NIH grant CA234842 to Z.Chen; NIH grant AI114852 to R.S.H.; NIH grant CA009140 to J.R.G.; E.J.W. is supported by the Parker Institute for Cancer Immunotherapy which supports the cancer immunology program at UPenn; S.F.N. is supported by an Australia NH&MRC C.J. Martin Fellowship (1111469) and the Mark Foundation Momentum Fellowship; J.R.G. is supported by Cancer Research Institute-Mark Foundation Fellowship.
Footnotes
Declaration of Interests
E.J.W. has consulting agreements with and/or is on the scientific advisory board for Merck, Roche, Pieris, Elstar, and Surface Oncology. E.J.W. is a founder of Surface Oncology and Arsenal Biosciences. E.J.W. has a patent licensing agreement on the PD-1 pathway with Roche/Genentech.
Publisher's Disclaimer: This is a PDF file of an unedited manuscript that has been accepted for publication. As a service to our customers we are providing this early version of the manuscript. The manuscript will undergo copyediting, typesetting, and review of the resulting proof before it is published in its final form. Please note that during the production process errors may be discovered which could affect the content, and all legal disclaimers that apply to the journal pertain.
References
- Adams WC, Chen Y-H, Kratchmarov R, Yen B, Nish SA, Lin W-HW, Rothman NJ, Luchsinger LL, Klein U, Busslinger M, Rathmell JC, Snoeck H-W, Reiner SL, 2016. Anabolism-Associated Mitochondrial Stasis Driving Lymphocyte Differentiation over Self-Renewal. Cell Reports 17, 3142–3152. doi: 10.1016/j.celrep.2016.11.065 [DOI] [PMC free article] [PubMed] [Google Scholar]
- Alfei F, Kanev K, Hofmann M, Wu M, Ghoneim HE, Roelli P, Utzschneider DT, Hösslin, von M, Cullen JG, Fan Y, Eisenberg V, Wohlleber D, Steiger K, Merkler D, Delorenzi M, Knolle PA, Cohen CJ, Thimme R, Youngblood B, Zehn D, 2019. TOX reinforces the phenotype and longevity of exhausted T cells in chronic viral infection. Nature 2017 545:7652 1. doi: 10.1038/s41586-019-1326-9 [DOI] [PubMed] [Google Scholar]
- Anastas JN, Moon RT, 2013. WNT signalling pathways as therapeutic targets in cancer. Nature Reviews Cancer 2012 13:1 13, 11–26. doi: 10.1038/nrc3419 [DOI] [PubMed] [Google Scholar]
- Angelosanto JM, Blackburn SD, Crawford A, Wherry EJ, 2012. Progressive loss of memory T cell potential and commitment to exhaustion during chronic viral infection. J. Virol. 86, 8161–8170. doi: 10.1128/JVI.00889-12 [DOI] [PMC free article] [PubMed] [Google Scholar]
- Barber DL, Wherry EJ, Masopust D, Zhu B, Allison JP, Sharpe AH, Freeman GJ, Ahmed R, 2006. Restoring function in exhausted CD8 T cells during chronic viral infection. Nature 2017 545:7652 439, 682–687. doi: 10.1038/nature04444 [DOI] [PubMed] [Google Scholar]
- Bengsch B, Ohtani T, Khan O, Setty M, Manne S, O’Brien S, Gherardini PF, Herati RS, Huang AC, Chang K-M, Newell EW, Bovenschen N, Pe’er D, Albelda SM, Wherry EJ, 2018. Epigenomic-Guided Mass Cytometry Profiling Reveals Disease-Specific Features of Exhausted CD8 T Cells. Immunity 48, 1029–1045.e5. doi: 10.1016/j.immuni.2018.04.026 [DOI] [PMC free article] [PubMed] [Google Scholar]
- Blackburn SD, Shin H, Freeman GJ, Wherry EJ, 2008. Selective expansion of a subset of exhausted CD8 T cells by αPD-L1 blockade. PNAS 105, 15016–15021. doi: 10.1073/pnas.0801497105 [DOI] [PMC free article] [PubMed] [Google Scholar]
- Chen J, López-Moyado IF, Seo H, Lio C-WJ, Hempleman LJ, Sekiya T, Yoshimura A, Scott-Browne JP, Rao A, 2019. NR4A transcription factors limit CAR T cell function in solid tumours. Nature 2017 545:7652 567, 530–534. doi: 10.1038/s41586-019-0985-x [DOI] [PMC free article] [PubMed] [Google Scholar]
- Chen Z, Stelekati E, Kurachi M, Yu S, Cai Z, Manne S, Khan O, Yang X, Wherry EJ, 2017. miR-150 Regulates Memory CD8 T Cell Differentiation via c-Myb. Cell Reports 20, 2584–2597. doi: 10.1016/j.celrep.2017.08.060 [DOI] [PMC free article] [PubMed] [Google Scholar]
- Crawford A, Angelosanto JM, Kao C, Doering TA, Odorizzi PM, Barnett BE, Wherry EJ, 2014. Molecular and Transcriptional Basis of CD4+ T Cell Dysfunction during Chronic Infection. Immunity 40, 289–302. [DOI] [PMC free article] [PubMed] [Google Scholar]
- Doering TA, Crawford A, Angelosanto JM, Paley MA, Ziegler CG, Wherry EJ, 2012. Network Analysis Reveals Centrally Connected Genes and Pathways Involved in CD8+ T Cell Exhaustion versus Memory. Immunity 37, 1130–1144. doi: 10.1016/j.immuni.2012.08.021 [DOI] [PMC free article] [PubMed] [Google Scholar]
- Dominguez CX, Amezquita RA, Guan T, Marshall HD, Joshi NS, Kleinstein SH, Kaech SM, 2015. The transcription factors ZEB2 and T-bet cooperate to program cytotoxic T cell terminal differentiation in response to LCMV viral infection. Journal of Experimental Medicine 212, 2041–2056. doi: 10.1084/jem.20150186 [DOI] [PMC free article] [PubMed] [Google Scholar]
- Finak G, McDavid A, Yajima M, Deng J, Gersuk V, Shalek AK, Slichter CK, Miller HW, McElrath MJ, Prlic M, Linsley PS, Gottardo R, 2015. MAST: a flexible statistical framework for assessing transcriptional changes and characterizing heterogeneity in single-cell RNA sequencing data. Genome Biol. 16, 278. doi: 10.1186/s13059-015-0844-5 [DOI] [PMC free article] [PubMed] [Google Scholar]
- Guan T, Dominguez CX, Amezquita RA, Laidlaw BJ, Cheng J, Henao-Mejia J, Williams A, Flavell RA, Lu J, Kaech SM, 2018. ZEB1, ZEB2, and the miR-200 family form a counterregulatory network to regulate CD8+ T cell fates. Journal of Experimental Medicine 215, 1153–1168. doi: 10.1084/jem.20171352 [DOI] [PMC free article] [PubMed] [Google Scholar]
- Guo X, Zhang Y, Zheng L, Zheng C, Song J, Zhang Q, Kang B, Liu Z, Jin L, Xing R, Gao R, Zhang L, Dong M, Hu X, Ren X, Kirchhoff D, Roider HG, Yan T, Zhang Z, 2018. Global characterization of T cells in non-small-cell lung cancer by single-cell sequencing. Nature Medicine 2018 24, 978–985. doi: 10.1038/s41591-018-0045-3 [DOI] [PubMed] [Google Scholar]
- Gupta PK, Godec J, Wolski D, Adland E, Yates K, Pauken KE, Cosgrove C, Ledderose C, Junger WG, Robson SC, Wherry EJ, Alter G, Goulder PJR, Klenerman P, Sharpe AH, Lauer GM, Haining WN, 2015. CD39 Expression Identifies Terminally Exhausted CD8+ T Cells. PLOS Pathogens 11, e1005177. doi: 10.1371/journal.ppat.1005177 [DOI] [PMC free article] [PubMed] [Google Scholar]
- He R, Hou S, Liu C, Zhang A, Bai Q, Han M, Yang Y, Wei G, Shen T, Yang X, Xu L, Chen X, Hao Y, Wang P, Zhu C, Ou J, Liang H, Ni T, Zhang X, Zhou X, Deng K, Chen Y, Luo Y, Xu J, Qi H, Wu Y, Ye L, 2016. Follicular CXCR5-expressing CD8+ T cells curtail chronic viral infection. Nature 2017 545:7652 537, 412–416. doi: 10.1038/nature19317 [DOI] [PubMed] [Google Scholar]
- Herndler-Brandstetter D, Ishigame H, Shinnakasu R, Plajer V, Stecher C, Zhao J, Lietzenmayer M, Kroehling L, Takumi A, Kometani K, Inoue T, Kluger Y, Kaech SM, Kurosaki T, Okada T, Flavell RA, 2018. KLRG1+ Effector CD8+ T Cells Lose KLRG1, Differentiate into All Memory T Cell Lineages, and Convey Enhanced Protective Immunity. Immunity 48, 716–729.e8. doi: 10.1016/j.immuni.2018.03.015 [DOI] [PMC free article] [PubMed] [Google Scholar]
- Huang AC, Orlowski RJ, Xu X, Mick R, George SM, Yan PK, Manne S, Kraya AA, Wubbenhorst B, Dorfman L, D’Andrea K, Wenz BM, Liu S, Chilukuri L, Kozlov A, Carberry M, Giles L, Kier MW, Quagliarello F, McGettigan S, Kreider K, Annamalai L, Zhao Q, Mogg R, Xu W, Blumenschein WM, Yearley JH, Linette GP, Amaravadi RK, Schuchter LM, Herati RS, Bengsch B, Nathanson KL, Farwell MD, Karakousis GC, Wherry EJ, Mitchell TC, 2019. A single dose of neoadjuvant PD-1 blockade predicts clinical outcomes in resectable melanoma. Nature Medicine 2018 25, 454–461. doi: 10.1038/s41591-019-0357-y [DOI] [PMC free article] [PubMed] [Google Scholar]
- Huang AC, Postow MA, Orlowski RJ, Mick R, Bengsch B, Manne S, Xu W, Harmon S, Giles JR, Wenz B, Adamow M, Kuk D, Panageas KS, Carrera C, Wong P, Quagliarello F, Wubbenhorst B, D’Andrea K, Pauken KE, Herati RS, Staupe RP, Schenkel JM, McGettigan S, Kothari S, George SM, Vonderheide RH, Amaravadi RK, Karakousis GC, Schuchter LM, Xu X, Nathanson KL, Wolchok JD, Gangadhar TC, Wherry EJ, 2017. T-cell invigoration to tumour burden ratio associated with anti-PD-1 response. Nature 2017 545:7652 545, 60–65. doi: 10.1038/nature22079 [DOI] [PMC free article] [PubMed] [Google Scholar]
- Ichii H, Sakamoto A, Hatano M, Okada S, Toyama H, Taki S, Arima M, Kuroda Y, Tokuhisa T, 2002. Role for Bcl-6 in the generation and maintenance of memory CD8+ T cells. Nature Immunology 2006 7:12 3, 558–563. doi: 10.1038/ni802 [DOI] [PubMed] [Google Scholar]
- Im SJ, Hashimoto M, Gerner MY, Lee J, Kissick HT, Burger MC, Shan Q, Hale JS, Lee J, Nasti TH, Sharpe AH, Freeman GJ, Germain RN, Nakaya HI, Xue H-H, Ahmed R, 2016. Defining CD8+ T cells that provide the proliferative burst after PD-1 therapy. Nature 2017 545:7652 537, 417–421. doi: 10.1038/nature19330 [DOI] [PMC free article] [PubMed] [Google Scholar]
- Intlekofer AM, Banerjee A, Takemoto N, Gordon SM, Dejong CS, Shin H, Hunter CA, Wherry EJ, Lindsten T, Reiner SL, 2008. Anomalous type 17 response to viral infection by CD8+ T cells lacking T-bet and eomesodermin. Science 321, 408–411. doi: 10.1126/science.1159806 [DOI] [PMC free article] [PubMed] [Google Scholar]
- Intlekofer AM, Takemoto N, Wherry EJ, Longworth SA, Northrup JT, Palanivel VR, Mullen AC, Gasink CR, Kaech SM, Miller JD, Gapin L, Ryan K, Russ AP, Lindsten T, Orange JS, Goldrath AW, Ahmed R, Reiner SL, 2005. Effector and memory CD8+ T cell fate coupled by T-bet and eomesodermin. Nature Immunology 2006 7:12 6, 1236–1244. doi: 10.1038/ni1268 [DOI] [PubMed] [Google Scholar]
- Ioannidis V, Beermann F, Clevers H, Held W, 2001. The β-catenin–TCF-1 pathway ensures CD4+CD8+ thymocyte survival. Nature Immunology 2006 7:12 2, 691–697. doi: 10.1038/90623 [DOI] [PubMed] [Google Scholar]
- Jeannet G, Boudousquié C, Gardiol N, Kang J, Huelsken J, Held W, 2010. Essential role of the Wnt pathway effector Tcf-1 for the establishment of functional CD8 T cell memory. PNAS 107, 9777–9782. doi: 10.1073/pnas.0914127107 [DOI] [PMC free article] [PubMed] [Google Scholar]
- Ji Z, Ji H, 2016. TSCAN: Pseudo-time reconstruction and evaluation in single-cell RNA-seq analysis. Nucleic Acids Res 44, e117–e117. doi: 10.1093/nar/gkw430 [DOI] [PMC free article] [PubMed] [Google Scholar]
- Joshi NS, Cui W, Chandele A, Lee HK, Urso DR, Hagman J, Gapin L, Kaech SM, 2007. Inflammation Directs Memory Precursor and Short-Lived Effector CD8+ T Cell Fates via the Graded Expression of T-bet Transcription Factor. Immunity 27, 281–295. doi: 10.1016/j.immuni.2007.07.010 [DOI] [PMC free article] [PubMed] [Google Scholar]
- Kaech SM, Cui W, 2012. Transcriptional control of effector and memory CD8+ T cell differentiation. Nature Reviews Immunology 2012 12:11 12, 749–761. doi: 10.1038/nri3307 [DOI] [PMC free article] [PubMed] [Google Scholar]
- Kaech SM, Tan JT, Wherry EJ, Konieczny BT, Surh CD, Ahmed R, 2003. Selective expression of the interleukin 7 receptor identifies effector CD8 T cells that give rise to long-lived memory cells. Nature Immunology 2006 7:12 4, 1191–1198. doi: 10.1038/ni1009 [DOI] [PubMed] [Google Scholar]
- Kallies A, Xin A, Belz GT, Nutt SL, 2009. Blimp-1 Transcription Factor Is Required for the Differentiation of Effector CD8+ T Cells and Memory Responses. Immunity 31, 283–295. doi: 10.1016/j.immuni.2009.06.021 [DOI] [PubMed] [Google Scholar]
- Kamphorst AO, Wieland A, Nasti T, Yang S, Zhang R, Barber DL, Konieczny BT, Daugherty CZ, Koenig L, Yu K, Sica GL, Sharpe AH, Freeman GJ, Blazar BR, Turka LA, Owonikoko TK, Pillai RN, Ramalingam SS, Araki K, Ahmed R, 2017. Rescue of exhausted CD8 T cells by PD-1–targeted therapies is CD28-dependent. Science 355, 1423–1427. doi: 10.1126/science.aaf0683 [DOI] [PMC free article] [PubMed] [Google Scholar]
- Kao C, Oestreich KJ, Paley MA, Crawford A, Angelosanto JM, Ali M-AA, Intlekofer AM, Boss JM, Reiner SL, Weinmann AS, Wherry EJ, 2011. Transcription factor T-bet represses expression of the inhibitory receptor PD-1 and sustains virus-specific CD8+ T cell responses during chronic infection. Nature Immunology 2006 7:12 12, 663–671. doi: 10.1038/ni.2046 [DOI] [PMC free article] [PubMed] [Google Scholar]
- Khan O, Giles JR, McDonald S, Manne S, Ngiow SF, Patel KP, Werner MT, Huang AC, Alexander KA, Wu JE, Attanasio J, Yan P, George SM, Bengsch B, Staupe RP, Donahue G, Xu W, Amaravadi RK, Xu X, Karakousis GC, Mitchell TC, Schuchter LM, Kaye J, Berger SL, Wherry EJ, 2019. TOX transcriptionally and epigenetically programs CD8+ T cell exhaustion. Nature 2017 545:7652 1. doi: 10.1038/s41586-019-1325-x [DOI] [PMC free article] [PubMed] [Google Scholar]
- Knight DA, Ngiow SF, Li M, Parmenter T, Mok S, Cass A, Haynes NM, Kinross K, Yagita H, Koya RC, Graeber TG, Ribas A, McArthur GA, Smyth MJ, 2016. Host immunity contributes to the anti-melanoma activity of BRAF inhibitors. J Clin Invest 126, 402–403. doi: 10.1172/JCI84828 [DOI] [PMC free article] [PubMed] [Google Scholar]
- Kurachi M, Barnitz RA, Yosef N, Odorizzi PM, DiIorio MA, Lemieux ME, Yates K, Godec J, Klatt MG, Regev A, Wherry EJ, Haining WN, 2014. The transcription factor BATF operates as an essential differentiation checkpoint in early effector CD8+ T cells. Nature Immunology 2006 7:12 15, 373–383. doi: 10.1038/ni.2834 [DOI] [PMC free article] [PubMed] [Google Scholar]
- Kurachi M, Kurachi J, Chen Z, Johnson J, Khan O, Bengsch B, Stelekati E, Attanasio J, McLane LM, Tomura M, Ueha S, Wherry EJ, 2017. Optimized retroviral transduction of mouse T cells for in vivo assessment of gene function. Nature Protocols 2017 12:9 12, 1980–1998. doi: 10.1038/nprot.2017.083 [DOI] [PMC free article] [PubMed] [Google Scholar]
- Lin W-HW, Adams WC, Nish SA, Chen Y-H, Yen B, Rothman NJ, Kratchmarov R, Okada T, Klein U, Reiner SL, 2015. Asymmetric PI3K Signaling Driving Developmental and Regenerative Cell Fate Bifurcation. Cell Reports 13, 2203–2218. doi: 10.1016/j.celrep.2015.10.072 [DOI] [PMC free article] [PubMed] [Google Scholar]
- Lin W-HW, Nish SA, Yen B, Chen Y-H, Adams WC, Kratchmarov R, Rothman NJ, Bhandoola A, Xue H-H, Reiner SL, 2016. CD8+ T Lymphocyte Self-Renewal during Effector Cell Determination. Cell Reports 17, 1773–1782. doi: 10.1016/j.celrep.2016.10.032 [DOI] [PMC free article] [PubMed] [Google Scholar]
- Liu X, Wang Y, Lu H, Li J, Yan X, Xiao M, Hao J, Alekseev A, Khong H, Chen T, Huang R, Wu J, Zhao Q, Wu Q, Xu S, Wang X, Jin W, Yu S, Wang Y, Wei L, Wang A, Zhong B, Ni L, Liu X, Nurieva R, Ye L, Tian Q, Bian X-W, Dong C, 2019. Genome-wide analysis identifies NR4A1 as a key mediator of T cell dysfunction. Nature 2017 545:7652 567, 525–529. doi: 10.1038/s41586-019-0979-8 [DOI] [PMC free article] [PubMed] [Google Scholar]
- Lun ATL, Bach K, Marioni JC, 2016. Pooling across cells to normalize single-cell RNA sequencing data with many zero counts. Genome Biol. 17, 75. doi: 10.1186/s13059-016-0947-7 [DOI] [PMC free article] [PubMed] [Google Scholar]
- Man K, Gabriel SS, Liao Y, Gloury R, Preston S, Henstridge DC, Pellegrini M, Zehn D, Berberich-Siebelt F, Febbraio MA, Shi W, Kallies A, 2017. Transcription Factor IRF4 Promotes CD8+ T Cell Exhaustion and Limits the Development of Memory-like T Cells during Chronic Infection. Immunity 47, 1129–1141.e5. doi: 10.1016/j.immuni.2017.11.021 [DOI] [PubMed] [Google Scholar]
- Martinez GJ, Pereira RM, Äijö T, Kim EY, Marangoni F, Pipkin ME, Togher S, Heissmeyer V, Zhang YC, Crotty S, Lamperti ED, Ansel KM, Mempel TR, Lähdesmäki H, Hogan PG, Rao A, 2015. The Transcription Factor NFAT Promotes Exhaustion of Activated CD8+ T Cells. Immunity 42, 265–278. doi: 10.1016/j.immuni.2015.01.006 [DOI] [PMC free article] [PubMed] [Google Scholar]
- Mognol GP, Spreafico R, Wong V, Scott-Browne JP, Togher S, Hoffmann A, Hogan PG, Rao A, Trifari S, 2017. Exhaustion-associated regulatory regions in CD8+ tumor-infiltrating T cells. PNAS 114, E2776–E2785. doi: 10.1073/pnas.1620498114 [DOI] [PMC free article] [PubMed] [Google Scholar]
- Odorizzi PM, Pauken KE, Paley MA, Sharpe A, Wherry EJ, 2015. Genetic absence of PD-1 promotes accumulation of terminally differentiated exhausted CD8 +T cells. Journal of Experimental Medicine 212, 1125–1137. doi: 10.1084/jem.20142237 [DOI] [PMC free article] [PubMed] [Google Scholar]
- Omilusik KD, Nadjsombati MS, Shaw LA, Yu B, Milner JJ, Goldrath AW, 2018. Sustained Id2 regulation of E proteins is required for terminal differentiation of effector CD8+ T cells. Journal of Experimental Medicine 215, 773–783. doi: 10.1084/jem.20171584 [DOI] [PMC free article] [PubMed] [Google Scholar]
- Paley MA, Gordon SM, Bikoff EK, Robertson EJ, Wherry EJ, Reiner SL, 2013. Technical Advance: Fluorescent reporter reveals insights into eomesodermin biology in cytotoxic lymphocytes. Journal of Leukocyte Biology 93, 307–315. doi: 10.1189/jlb.0812400 [DOI] [PMC free article] [PubMed] [Google Scholar]
- Paley MA, Kroy DC, Odorizzi PM, Johnnidis JB, Dolfi DV, Barnett BE, Bikoff EK, Robertson EJ, Lauer GM, Reiner SL, Wherry EJ, 2012. Progenitor and Terminal Subsets of CD8+ T Cells Cooperate to Contain Chronic Viral Infection. Science 338, 1220–1225. doi: 10.1126/science.1229620 [DOI] [PMC free article] [PubMed] [Google Scholar]
- Pauken KE, Sammons MA, Odorizzi PM, Manne S, Godec J, Khan O, Drake AM, Chen Z, Sen DR, Kurachi M, Barnitz RA, Bartman C, Bengsch B, Huang AC, Schenkel JM, Vahedi G, Haining WN, Berger SL, Wherry EJ, 2016. Epigenetic stability of exhausted T cells limits durability of reinvigoration by PD-1 blockade. Science 354, 1160–1165. doi: 10.1126/science.aaf2807 [DOI] [PMC free article] [PubMed] [Google Scholar]
- Philip M, Fairchild L, Sun L, Horste EL, Camara S, Shakiba M, Scott AC, Viale A, Lauer P, Merghoub T, Hellmann MD, Wolchok JD, Leslie CS, Schietinger A, 2017. Chromatin states define tumour-specific T cell dysfunction and reprogramming. Nature 2017 545:7652 545, 452–456. doi: 10.1038/nature22367 [DOI] [PMC free article] [PubMed] [Google Scholar]
- Qiu X, Hill A, Packer J, Lin D, Ma Y-A, Trapnell C, 2017. Single-cell mRNA quantification and differential analysis with Census. Nature Methods 2017 14:3 14, 309–315. doi: 10.1038/nmeth.4150 [DOI] [PMC free article] [PubMed] [Google Scholar]
- Quigley M, Pereyra F, Nilsson B, Porichis F, Fonseca C, Eichbaum Q, Julg B, Jesneck JL, Brosnahan K, Imam S, Russell K, Toth I, Piechocka-Trocha A, Dolfi D, Angelosanto J, Crawford A, Shin H, Kwon DS, Zupkosky J, Francisco L, Freeman GJ, Wherry EJ, Kaufmann DE, Walker BD, Ebert B, Haining WN, 2010. Transcriptional analysis of HIV-specific CD8+ T cells shows that PD-1 inhibits T cell function by upregulating BATF. Nature Medicine 2018 16, 1147–1151. doi: 10.1038/nm.2232 [DOI] [PMC free article] [PubMed] [Google Scholar]
- Rutishauser RL, Martins GA, Kalachikov S, Chandele A, Parish IA, Meffre E, Jacob J, Calame K, Kaech SM, 2009. Transcriptional Repressor Blimp-1 Promotes CD8+ T Cell Terminal Differentiation and Represses the Acquisition of Central Memory T Cell Properties. Immunity 31, 296–308. doi: 10.1016/j.immuni.2009.05.014 [DOI] [PMC free article] [PubMed] [Google Scholar]
- Sade-Feldman M, Yizhak K, Bjorgaard SL, Ray JP, de Boer CG, Jenkins RW, Lieb DJ, Chen JH, Frederick DT, Barzily-Rokni M, Freeman SS, Reuben A, Hoover PJ, Villani A-C, Ivanova E, Portell A, Lizotte PH, Aref AR, Eliane J-P, Hammond MR, Vitzthum H, Blackmon SM, Li B, Gopalakrishnan V, Reddy SM, Cooper ZA, Paweletz CP, Barbie DA, Stemmer-Rachamimov A, Flaherty KT, Wargo JA, Boland GM, Sullivan RJ, Getz G, Hacohen N, 2018. Defining T Cell States Associated with Response to Checkpoint Immunotherapy in Melanoma. Cell 175, 998–1013.e20. doi: 10.1016/j.cell.2018.10.038 [DOI] [PMC free article] [PubMed] [Google Scholar]
- Schietinger A, Philip M, Krisnawan VE, Chiu EY, Delrow JJ, Basom RS, Lauer P, Brockstedt DG, Knoblaugh SE, Hammerling GJ, Schell TD, Garbi N, Greenberg PD, 2016. Tumor-Specific T Cell Dysfunction Is a Dynamic Antigen-Driven Differentiation Program Initiated Early during Tumorigenesis. Immunity 45, 389–401. doi: 10.1016/j.immuni.2016.07.011 [DOI] [PMC free article] [PubMed] [Google Scholar]
- Scott AC, Dundar F, Zumbo P, Chandran SS, Klebanoff CA, Shakiba M, Trivedi P, Menocal L, Appleby H, Camara SJ, Zamarin D, Walther T, Snyder AC, Femia MR, Comen EA, Wen HY, Hellmann MD, Anandasabapathy N, Liu Y, Altorki NK, Lauer P, Levy O, Glickman M, Kaye J, Betel D, Philip M, Schietinger A, 2019. TOX is a critical regulator of tumour-specific T cell differentiation. Nature 2017 545:7652. doi: 10.1038/s41586-019-1324-y [DOI] [PMC free article] [PubMed] [Google Scholar]
- Sen DR, Kaminski J, Barnitz RA, Kurachi M, Gerdemann U, Yates KB, Tsao H-W, Godec J, LaFleur MW, Brown FD, Tonnerre P, Chung RT, Tully DC, Allen TM, Frahm N, Lauer GM, Wherry EJ, Yosef N, Haining WN, 2016. The epigenetic landscape of T cell exhaustion. Science 354, 1165–1169. doi: 10.1126/science.aae0491 [DOI] [PMC free article] [PubMed] [Google Scholar]
- Seo H, Chen J, Gonzälez-Avalos E, Samaniego-Castruita D, Das A, Wang YH, López-Moyado IF, Georges RO, Zhang W, Onodera A, Wu C-J, Lu L-F, Hogan PG, Bhandoola A, Rao A, 2019. TOX and TOX2 transcription factors cooperate with NR4A transcription factors to impose CD8+ T cell exhaustion. Proc. Natl. Acad. Sci. U.S.A. 116, 12410–12415. doi: 10.1073/pnas.1905675116 [DOI] [PMC free article] [PubMed] [Google Scholar]
- Stelekati E, Chen Z, Manne S, Kurachi M, Ali M-A, Lewy K, Cai Z, Nzingha K, McLane LM, Hope JL, Fike AJ, Katsikis PD, Wherry EJ, 2018. Long-Term Persistence of Exhausted CD8 T Cells in Chronic Infection Is Regulated by MicroRNA-155. Cell Reports 23, 2142–2156. [DOI] [PMC free article] [PubMed] [Google Scholar]
- Utzschneider DT, Charmoy M, Chennupati V, Pousse L, Ferreira DP, Calderon-Copete S, Danilo M, Alfei F, Hofmann M, Wieland D, Pradervand S, Thimme R, Zehn D, Held W, 2016. T Cell Factor 1-Expressing Memory-like CD8+ T Cells Sustain the Immune Response to Chronic Viral Infections. Immunity 45, 415–427. doi: 10.1016/j.immuni.2016.07.021 [DOI] [PubMed] [Google Scholar]
- Weber BN, Chi AW-S, Chavez A, Yashiro-Ohtani Y, Yang Q, Shestova O, Bhandoola A, 2011. A critical role for TCF-1 in T-lineage specification and differentiation. Nature 2017 545:7652 476, 63–68. doi: 10.1038/nature10279 [DOI] [PMC free article] [PubMed] [Google Scholar]
- Wherry EJ, Ha S-J, Kaech SM, Haining WN, Sarkar S, Kalia V, Subramaniam S, Blattman JN, Barber DL, Ahmed R, 2007. Molecular Signature of CD8+ T Cell Exhaustion during Chronic Viral Infection. Immunity 27, 670–684. doi: 10.1016/j.immuni.2007.09.006 [DOI] [PubMed] [Google Scholar]
- Wherry EJ, Teichgräber V, Becker TC, Masopust D, Kaech SM, Antia R, Andrian, von UH, Ahmed R, 2003. Lineage relationship and protective immunity of memory CD8 T cell subsets. Nature Immunology 2006 7:12 4, 225–234. doi: 10.1038/ni889 [DOI] [PubMed] [Google Scholar]
- Wu T, Ji Y, Moseman EA, Xu HC, Manglani M, Kirby M, Anderson SM, Handon R, Kenyon E, Elkahloun A, Wu W, Lang PA, Gattinoni L, McGavern DB, Schwartzberg PL, 2016. The TCF1-Bcl6 axis counteracts type I interferon to repress exhaustion and maintain T cell sternness. Science immunology 1, eaai8593–eaai8593. doi: 10.1126/sciimmunol.aai8593 [DOI] [PMC free article] [PubMed] [Google Scholar]
- Yang CY, Best JA, Knell J, Yang E, Sheridan AD, Jesionek AK, Li HS, Rivera RR, Lind KC, D'Cruz LM, Watowich SS, Murre C, Goldrath AW, 2011. The transcriptional regulators Id2 and Id3 control the formation of distinct memory CD8+ T cell subsets. Nature Immunology 2006 7:12 12, 1221–1229. doi: 10.1038/ni.2158 [DOI] [PMC free article] [PubMed] [Google Scholar]
- Yao C, Sun H-W, Lacey NE, Ji Y, Moseman EA, Shih H-Y, Heuston EF, Kirby M, Anderson S, Cheng J, Khan O, Handon R, Reilley J, Fioravanti J, Hu J, Gossa S, Wherry EJ, Gattinoni L, McGavern DB, O'Shea JJ, Schwartzberg PL, Wu T, 2019. Single-cell RNA-seq reveals TOX as a key regulator of CD8+ T cell persistence in chronic infection. Nature Immunology 2006 7:12 20, 890–901. doi: 10.1038/s41590-019-0403-4 [DOI] [PMC free article] [PubMed] [Google Scholar]
- Yee TW, 2015. Vector generalized linear and additive models: with an implementation in R. [Google Scholar]
- Zhang L, Yu X, Zheng L, Zhang Y, Li Y, Fang Q, Gao R, Kang B, Zhang Q, Huang JY, Konno H, Guo X, Ye Y, Gao S, Wang S, Hu X, Ren X, Shen Z, Ouyang W, Zhang Z, 2018. Lineage tracking reveals dynamic relationships of T cells in colorectal cancer. Nature 2017 545:7652 564, 268–272. doi: 10.1038/s41586-018-0694-x [DOI] [PubMed] [Google Scholar]
- Zheng C, Zheng L, Yoo J-K, Guo H, Zhang Y, Guo X, Kang B, Hu R, Huang JY, Zhang Q, Liu Z, Dong M, Hu X, Ouyang W, Peng J, Zhang Z, 2017. Landscape of Infiltrating T Cells in Liver Cancer Revealed by Single-Cell Sequencing. Cell 169, 1342–1356.e16. doi: 10.1016/j.cell.2017.05.035 [DOI] [PubMed] [Google Scholar]
- Zhou X, Yu S, Zhao D-M, Harty JT, Badovinac VP, Xue H-H, 2010. Differentiation and Persistence of Memory CD8+ T Cells Depend on T Cell Factor 1. Immunity 33, 229–240. doi: 10.1016/j.immuni.2010.08.002 [DOI] [PMC free article] [PubMed] [Google Scholar]
Associated Data
This section collects any data citations, data availability statements, or supplementary materials included in this article.