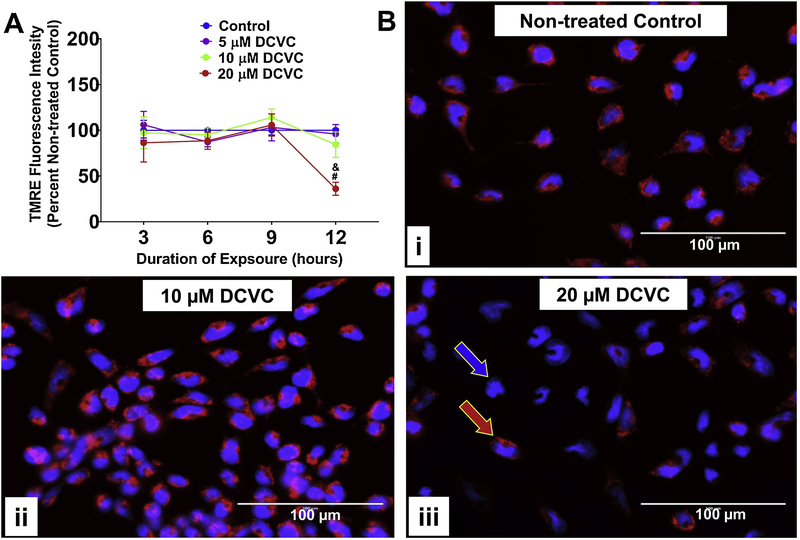
Figure 3. Effects of DCVC mitochondrial membrane potential.
A) Graphical representation of mitochondrial membrane potential expressed as percent non-treated control. Cells were treated for 3, 6, 9 or 12 h with medium alone (control), or with 5, 10, or 20 μM DCVC. Tetramethylrhodamine ethyl ester (TMRE), a cell-permanent fluorochrome, was used to measure relative mitochondrial membrane potential. The fluorescence signal is proportional to mitochondrial membrane polarization. N= 3 independent experiments for each time point, with 4 replicates per treatment in each experiment. Data are graphed as means ± SEM. Data were analyzed by two-way ANOVA (no significant interaction detected between time and treatment, P=0.1533) with posthoc Tukey multiple comparisons. Ampersand sign indicates significant difference compared to control, 5 μM DCVC and 10 μM DCVC within the same time point: &P =0.0013. Pound sign indicates significant difference compared to same treatment at all earlier time points: #P < 0.001. FCCP (10 μM) was included as a positive control and depolarized the mitochondrial membrane potential by 16.45% ± 4.19% at 3 h, 18.9% ± 4.16% at 6 h, 24.13% ± 7.89% at 9 h, and 8.78% ± 8.78% at 12 h. B) Visualization of DCVC-induced depolarization of mitochondrial membrane potential by fluorescence microscopy. Cells were treated for 12 hours with (i) 0 μM DCVC (control), (ii) 10 μM DCVC or (iii) 20 μM DCVC. Red fluorescence (TMRE) represents normal mitochondrial membrane potential (red arrow). Blue fluorescence (Hoechst stain) represents cellular nuclei (blue arrow). All images shown with 100 μm scale bars. Representative images from 3 experiments are shown.

