Abstract
Breast cancer (BC) is a kind of malignant cancer that seriously threatens women’s health. Research scientists have found that BC occurs as the result of multiple effects of the external environment and internal genetic changes. Cell cycle checkpoint kinase 1 (CHEK1) is a crucial speed limit point in the cell cycle. Alterations of CHEK1 have been found in various tumors but are rarely reported or verified in BC. By mining database information, a large amount of mRNA and protein data was collected and meta-analyzed. Also, in-house immunohistochemistry was carried out to validate the results of the CHEK1 expression levels. Relative clinical features of BC patients were calculated with the CHEK1 expression levels to determine their diagnostic value. The mRNA levels of CHEK1 were higher in 1,089 cases of BC tissues than in 291 cases of non-BC tissues. We observed that the mRNA levels of CHEK1 are related to the clinical stages of BC patients (P = 0.008) and are also significant for overall survival (HR = 1.6, P = 0.0081). Using the immunohistochemistry method, we calculated and confirmed, using Fisher’s exact test (P < 0.001), that a high-level CHEK1 protein is exhibited in BC tissues. Overexpressed CHEK1 mRNA promotes the occurrence of BC. Also, up-regulated CHEK1 could serve as an independent risk biomarker in BC patients’ prognoses.
Keywords: Breast cancer, cell cycle checkpoints, cytogenetic analysis, medical oncology
Introduction
Breast cancer is the most common malignant tumor in women [1-3]. Its incidence involves many factors-such as diet, fertility, hormonal imbalance, and living environment-and it is closely related to multiple lifestyles [4]. At present, a considerable number of scientists recognize that the occurrence, development, and prognosis of breast cancer is an extremely complicated process, which is related to the interaction of many factors [5-9]. Most importantly, individual genetic level changes, induced by external factors, are a direct determinant of breast cancer. Currently, there are many methods for diagnosing breast cancer, including breast ultrasound, mammography, etc., but these examinations are limited by tumor size, poor specificity, and high rates of missed diagnoses. Although CT and MRI are highly accurate, they are also costly and bring financial burdens to patients [10]. At present, pathological examination is the gold standard for the diagnosis of breast cancer, and it costs less than CT and MRI. All breast cancer patients have their diagnoses confirmed by pathological examination combined with immunohistochemistry after their surgery or biopsy. Therefore, for early treatment and prognosis judgment to prevent the disease, it is of great clinical significance to further study breast cancer’s pathogenesis and risk factors and to find appropriate detection markers and treatment targets.
Cell cycle checkpoint kinase 1 (CHEK1) is a conserved protein kinase found in fission yeast, and it is a very important speed limit point in the cell cycle [11-13]. The gene that encodes CHEK1 is located in the fourth region of the long arm of human chromosome 11 (11q24). The gene contains 13 exons; the length of cDNA is 1891 bp; and the molecular weight is 54 kD. As mentioned above, tumors are genetically-driven diseases occurring under various internal and external tumorigenic factors. Genes mutate (such as through DNA rearrangement, deletion and base modification, etc.), which leads to abnormal protein expression, uncontrolled cell proliferation, and, eventually, carcinogenesis [14-16]. Thus, DNA defects can lead to chromosomal aberrations in the apoptotic regulation pathways, DNA repair pathways, and cell cycle detection points. Previous studies have shown that, because CHEK1 is such an important speed limiting point in the cell cycle, its overexpression may be one of the important mechanisms leading to the development of human malignant tumors, such as lung, bladder, colon, stomach, ovarian, and cervical cancers [17-19].
However, at present, few studies have been done on the relationship between CHEK1 and breast cancer. Therefore, this study aims to detect the expression of CHEK1 in breast cancer and adjacent tissues through immunohistochemistry-exploring the relationship between CHEK1 expression in breast cancer and the clinicopathological factors while paying close attention to the biological indicators related to breast cancer. Also, to provide more effective references for the clinical occurrence, development, treatment, and clinical prognosis of breast cancer, we hope to reach a breakthrough in the diagnosis and treatment of this disease.
Materials and methods
The validation of the mRNA level of CHEK1 in breast cancer
The mRNA levels of CHEK1 in breast cancer and their prognostic significance based on TCGA data
To investigate the mRNA expression level of CHEK1 in BC patients, The Cancer Genome Atlas database (TCGA, https://cancergenome.nih.gov/), which includes 1,085 BC tissues and 291 normal breast tissues, was used to analyze the difference between CHEK1 mRNA in BC tissues and normal breast tissues, as well as in different BC clinical stages. The Gene Expression Omnibus (GEO, https://www.ncbi.nlm.nih.gov/geo/) dataset [20,21] is a gene expression database created and maintained by the United States’ National Center for Biotechnology Information (NCBI). The GEO database is representative because it includes high-throughput gene expression data submitted by research institutions from around the world. Gene Expression Profiling Interactive Analysis (GEPIA, http://gepia.cancer-pku.cn/) is an online networking tool that visualizes large amounts of genome data from over 10,000 cancer tissues in databases such as TCGA and GTEx [22]. GEPIA was applied to visualize the mRNA expression levels of CHEK1 in various types of cancer. The Kaplan-Meier plotter (http://www.kmplot.com/) tool was also used to provide survival curves and further evaluate the prognostic significance of BC patients’ CHEK1 levels by integrating data from the TCGA and the GEO.
Chip screening of the GEO database
To further validate the mRNA levels of CHEK1 in BC tissues, the GEO database was searched for relevant chips using the keyword “breast”. The chips, or samples, that met the following criteria were included in this study: (1) chips simultaneously contained RNA expression data of both normal breast and BC tissues; (2) chips were based on human tissues rather than animal tissues or cell lines; (3) chips contained expression data of CHEK1 mRNA; (4) the patients included in chips had not been treated by chemotherapy, radiotherapy, or any other methods of treatment; (5) the sample’s data was derived from BC tissues instead of ductal carcinoma in situ or BC stromal tissues.
Data analysis
After obtaining qualified chips, all data were normalized to the log2 scale to better display the data results, and the mean and standard deviation (SD) of CHEK1 expression levels were calculated by GraphPad Prism 7.0 (San Diego, CA, USA). Student’s t-test was used to verify the statistical differences between CHEK1 expression in BC and normal tissues. The receiver operating characteristic (ROC) curves for each chip were also constructed by GraphPad Prism 7.0 to assess the potential diagnostic value of CHEK1 in BC patients. In addition, the number of true-positive (TP) cases, true-negative (TN) cases, false-positive (FP) cases, and false-negative (FN) cases per chips were also calculated by IBM SPSS 24.0 (SPSS Inc., Chicago, IL, USA).
Meta-analysis for CHEK1 expression level and potential diagnostic value
To provide a comprehensive assessment of CHEK1 expression levels in BC and normal breast tissues, a meta-analysis was performed using Stata 12.0 (StataCorp, College Station, TX, USA). The fixed effects model was used if I2 < 50%; conversely, when distinct heterogeneity was shown (I2 > 50%), the random effects model was applied, followed by a sensitivity analysis for identifying the source of the heterogeneity. Then, the relevant chips that might lead to the heterogeneity were eliminated from the meta-analysis, and a Begg’s test was used to assess the publication bias. A diagnostic meta-analysis was also performed to evaluate the potential diagnostic value of CHEK1 in BC patients.
Validation of CHEK1 protein levels in breast cancer by immunohistochemistry
Selection of breast cancer patients
Between December 2015 and December 2017, archived specimens, which had been pathologically diagnosed as breast carcinoma, and adjacent tissues were selected from the First Affiliated Hospital of Guangxi University of Chinese Medicine.
The archived specimens were chosen in strict accordance with the following principles: (1) female patients; (2) patients with newly-discovered breast carcinoma; (3) patients classified by the fourth edition of the World Health Organization (WHO) breast cancer classification; (4) patients with complete clinical and pathological data; (5) patients with complete immunohistochemistry (IHC) staining of estrogen (ER), progesterone (PR), human epidermal growth factor receptor-2 (HER-2), protein 53 (P53), and antigen Ki-67 (Ki-67); (6) preoperative patients who had not received any adjuvant therapy, such as chemotherapy, radiotherapy, etc.
Judgment principles of immunohistochemistry
Rabbit anti-human CHEK1 monoclonal antibody presenting as certified positive control was provided by the Abcam company (Cambridge, MA, USA), and phosphate buffered saline (PBS) was used as a negative control to replace the primary antibody. A positive control and a negative control were provided from the reagent company for each stain, and all processes were strictly carried out according to the experimental methods of the kit’s instructions. Positive cells meant that the cells were localized in the cytoplasm and/or nucleus, which were stained with shakes of flakes or granules of light yellow, brownish yellow or tan. The positive cell rate was the percentage of positive cells in the total number of cells. The specimens were independently reviewed by two specialized pathologists, with a double-blinded trial to ensure result reliability, and, if controversial results were shown in the two pathologists’ interpretations, a third pathologist was invited to review and certify the results.
The IHC results were interpreted by the following criteria: (1) Score of staining intensity (I): a. Unstained cell equaled zero points. b. Light yellow equaled one point. c. Brown-yellow equaled two points. d. Dark brown equaled three points. (2) Score of positive cell rate (R): The number of positive cells with high-power fields under the microscope were counted by 10 random fields of view, and then used in the following formula: the percentage of positive staining cells = (the total amount of positive cell)/10. a. A positive cell rate below 10% equaled zero points. b. A positive cell rate between 10% and 30% equaled one point. c. A positive cell rate between 31% and 60% equaled two points. d. A positive cell rate above 60% equaled three points. (3) The points gathered from the percentage of positive cells and the staining intensity were added together to obtain a final score (S). Therefore, S = I + R. a. When S = 0-1, it was considered negative. b. When S = 2-3, it was considered weakly positive. c. When S = 4-5, it was considered moderately positive. d. When S = 6, it was considered strongly positive.
Statistical analysis
The experimental data were analyzed in IBM SPSS 24.0. The differences between the expressions of CHEK1 in the BC tissues and in the adjacent breast tissues, as well as their correlations with the clinicopathological characteristics, were calculated by χ2 or Fisher’s exact test. All data were considered statistically significant with P < 0.05. Additionally, the correlations between the CHEK1 protein and clinicopathological characteristics were further determined by the Spearman correlation test.
Genetic alterations and co-expressed genes of CHEK1 in breast cancer
Genetic alterations and the corresponding prognosis of CHEK1 in breast cancer
The cBio Cancer Genomics Portal (cBioPortal, http://www.cbioportal.org/) provides a comprehensive analysis of genomic, clinical, and related patient data by linking various databases around the world [20,23,24]. The OncoPrint schematic (TCGA Provisional) was constructed by cBioPortal to reveal CHEK1 genetic alterations of CHEK1, counting the types and numbers of CHEK1 gene changes in BC, including mRNA down-regulation, amplification, and deep deletion, etc. Subsequently, by constructing Kaplan-Meier survival curves, the relationship between genetic alterations and BC prognosis significance was demonstrated intuitively. In addition, the correlations between mRNA expression of CHEK1 and methylation, as well as copy-number alterations, were also explored based on TCGA sequencing data.
Acquisition of co-expressed genes and gene function annotation
To further explore the underlying mechanisms of CHEK1 in BC patients, the co-expressed genes of CHEK1 in BC were obtained from cBioPortal, followed by Gene Ontology (GO) enrichment and the Kyoto Encyclopedia of Genes and Genomes (KEGG) pathway analyses provided by Metascape [25], which is a web-based gene annotation tool last updated on August 1, 2018. We then used STR-ING [26] (https://string-db.org/cgi/input.pl?sessionId=sideZmeD7uyT&input_page_show_search=on), a functional protein association constructing network, to construct protein-protein interaction (PPI) networks to show the relationships among the proteins.
Results
The validation of CHEK1 mRNA level and its clinical value in breast cancer
mRNA level of CHEK1 and its prognostic significance in breast cancer
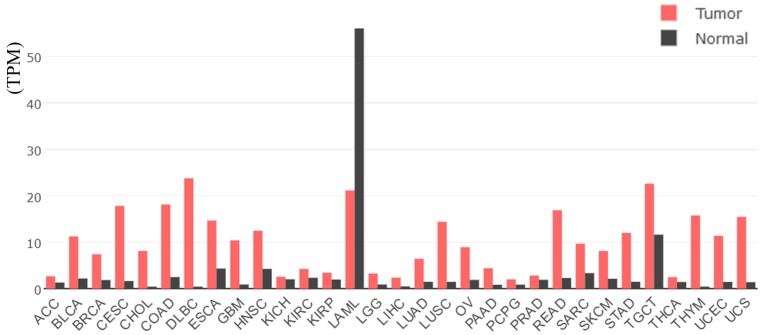
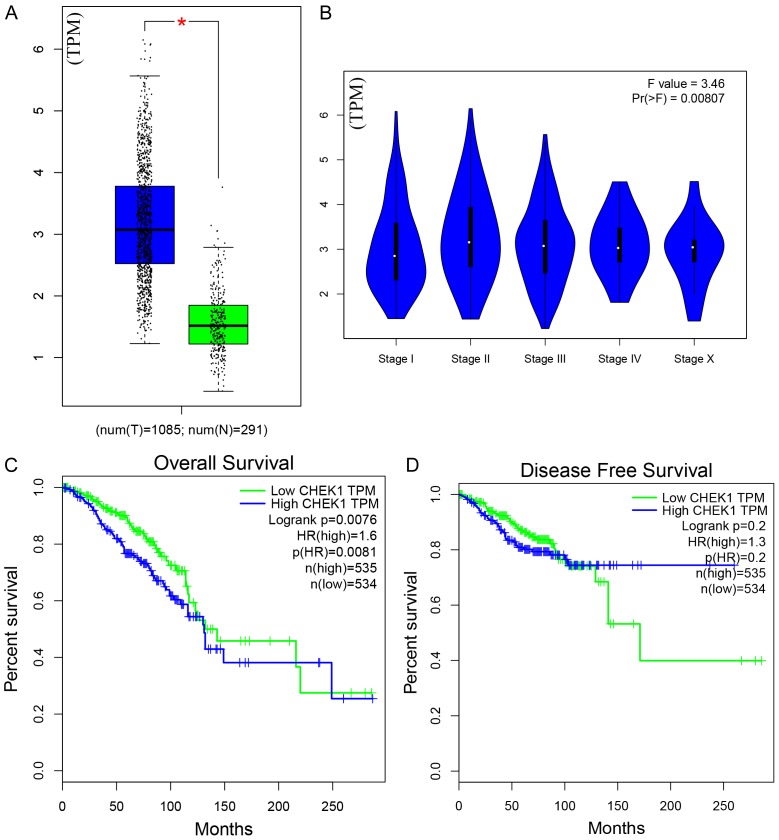
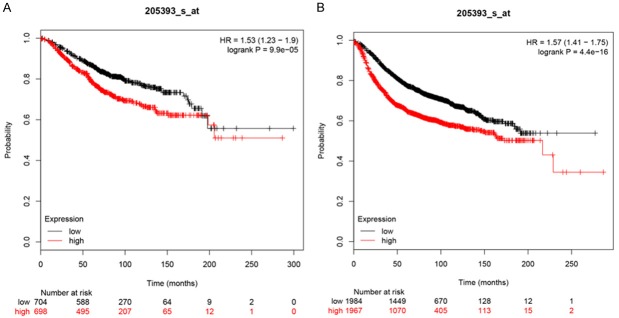
Based on TCGA data, the mRNA levels of CHEK1 in 33 types of human cancer are shown in Figure 1, from which a consistent expressing trend was observed, indicating that higher CHEK1 mRNA levels were exhibited in different types of cancers compared with normal tissues, except for acute myeloid leukemia (LAML). As for BC patients, the mRNA level of CHEK1 was obviously higher in the BC tissues (1,089 cases) than in the non-BC tissues (291 cases) (Figure 2A). The mRNA level of CHEK1 was also related to the clinical stages of BC patients (P = 0.008) (Figure 2B). Concerning the prognostic value, a remarkable prognostic significance of CHEK1 mRNA was shown in a survival curve for overall survival (OS) based on the 1,089 BC patients (HR = 1.6, P = 0.0081) (Figure 2C), but a relationship between the CHEK1 mRNA levels and disease-free survival (DFS) in BC patients was not found (Figure 2D). Similarly, the results achieved from larger cohorts, which integrated TCGA and GEO data, also suggested that CHEK1 mRNA might act as a potential prognostic indicator to predict situations of overall survival (HR = 1.53, P < 0.001) (Figure 3A) and relapse-free survival (HR = 1.57, P < 0.001) (Figure 3B) in BC patients.
Figure 1.
The mRNA levels of CHEK1 in 33 types of tumor tissues and non-cancer tissues, based on TCGA data. The red represents the mRNA level of CHEK1 in tumor tissues, and the black represents the mRNA level of CHEK1 in normal tissues. In the red box is the level of CHEK1 in BC.
Figure 2.
The mRNA expression levels and survival courses of CHEK1 in both BC and non-BC tissues, based on TCGA. A. The mRNA expression levels in BC and non-BC tissues; the blue represents the mRNA level of CHEK1 in tumor tissues, and the green represents the level in normal tissues; the black dot represents each individual expression level. B. The mRNA expression levels in different clinical stages. C. The overall survival curve of CHEK1. D. The disease-free survival curve of CHEK1; the blue line represents high CHEK1 expression, and the green line represents low CHEK1 expression.
Figure 3.
The prognostic value of CHEK1 expression levels in BC patients constructed using a Kaplan-Meier plotter. A. Overall survival curve (n = 1402). B. Relapse-free survival curve (n = 3951). The red line represents high CHEK1 expression, and the black line represents low CHEK1 expression.
Further validation of CHEK1 mRNA level and its diagnostic value in breast cancer by GEO chips
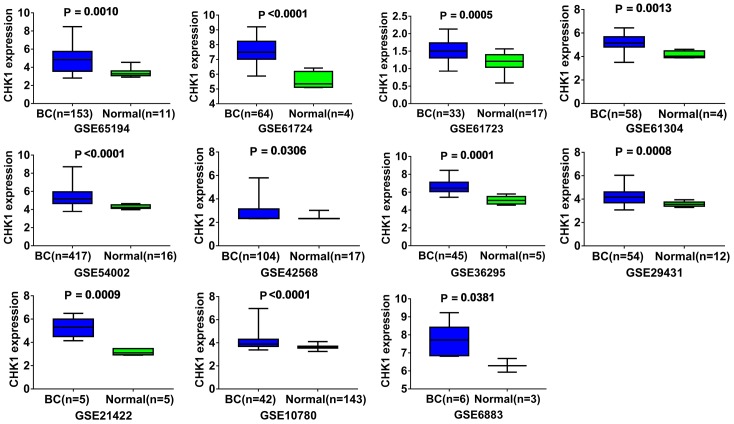
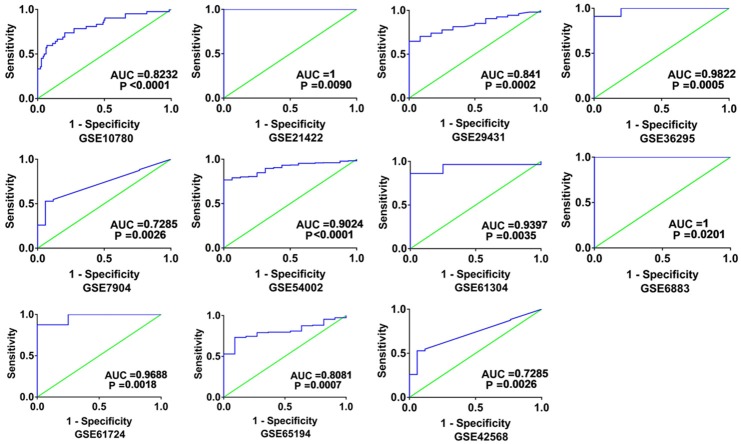
Altogether, 18 chips were enrolled in this research, according to the inclusion criteria (Table 1). Among those 18 chips, 12 suggested that the CHEK1 mRNA level was greatly up-regulated in the BCRA tissues with P < 0.05 (Figure 4). The results of meta-analysis also suggested that CHEK1 mRNA was obviously overexpressed in the BC tissues with a moderate heterogeneity (SMD = 1.10, 95% CI: 0.80-1.40, I2 = 66.3%) (Figure 5A). According to the sensitivity analysis (Figure 5B), two studies (GSE15852 and GSE61724) were considered potential sources of heterogeneity. After removing these two studies, the heterogeneity decreased to 33.9%, and a results consistent result to the aforementioned was also shown (SMD = 1.11, 95% CI: 0.93-1.29) (Figure 6A). Begg’s funnel plot indicated that there was no significant publication bias (Figure 6B), which further validated the overexpression of CHEK1 mRNA in BC tissues. Concerning the potential diagnostic value of CHEK1 mRNA in BC patients, 12 ROC curves with statistical significance are displayed in Figure 7. The smallest area under the curve (AUC) was 0.7285, originating from GSE7904, and the AUC from the summary ROC (sROC) (Figure 9) curve was 0.88, with a sensitivity of 0.79 and a specificity of 0.85 (Figure 8), indicating a notable significance of CHEK1 mRNA in distinguishing between BC tissues and non-BC tissues.
Table 1.
Detailed information on the included GEO chips
| GEO ID | BC cases | Mean ± SD (BC) | Normal cases | Mean ± SD (Normal) | P-value | TP | FP | FN | TN |
|---|---|---|---|---|---|---|---|---|---|
| GSE5764 | 10 | 4.07 ± 2.562 | 20 | 3.454 ± 2.43 | 0.5258 | 6 | 8 | 4 | 12 |
| GSE10797 | 28 | 2.843 ± 0.5606 | 5 | 2.508 ± 0.4031 | 0.2127 | 27 | 3 | 1 | 2 |
| GSE21422 | 5 | 5.267 ± 0.8651 | 5 | 3.177 ± 0.2715 | 0.0009 | 5 | 0 | 0 | 5 |
| GSE33692 | 10 | 8.857 ± 0.73 | 3 | 6.358 ± 4.057 | 0.065 | 5 | 1 | 5 | 2 |
| GSE36295 | 45 | 6.697 ± 0.8267 | 5 | 5.097 ± 0.4698 | 0.0001 | 41 | 0 | 4 | 5 |
| GSE42568 | 104 | 2.77 ± 0.766 | 17 | 2.36 ± 0.1706 | 0.0306 | 55 | 1 | 49 | 16 |
| GSE61304 | 58 | 5.213 ± 0.6262 | 4 | 4.137 ± 0.3263 | 0.0013 | 50 | 0 | 8 | 4 |
| GSE61724 | 64 | 7.528 ± 0.8075 | 4 | 5.549 ± 0.6032 | < 0.0001 | 56 | 0 | 8 | 4 |
| GSE7904 | 43 | 6.354 ± 1.171 | 7 | 4.984 ± 0.2128 | 0.0036 | 40 | 1 | 3 | 6 |
| GSE10780 | 42 | 4.179 ± 0.7588 | 143 | 3.635 ± 0.1508 | < 0.0001 | 31 | 30 | 11 | 113 |
| GSE15852 | 43 | 8.672 ± 1.154 | 43 | 8.436 ± 0.9638 | 0.308 | 16 | 5 | 27 | 38 |
| GSE22544 | 14 | 4.03 ± 0.7302 | 4 | 3.339 ± 0.6381 | 0.1073 | 14 | 1 | 0 | 3 |
| GSE25407 | 5 | 5.457 ± 0.1552 | 5 | 5.43 ± 0.1903 | 0.8094 | 2 | 1 | 3 | 4 |
| GSE29431 | 54 | 4.289 ± 0.6965 | 12 | 3.572 ± 0.2108 | 0.0008 | 36 | 0 | 18 | 12 |
| GSE54002 | 417 | 5.399 ± 0.9674 | 16 | 4.3 ± 0.2051 | < 0.0001 | 321 | 16 | 96 | 0 |
| GSE61723 | 33 | 1.508 ± 0.2752 | 17 | 1.208 ± 0.2585 | 0.0005 | 23 | 4 | 10 | 13 |
| GSE65194 | 153 | 4.829 ± 1.443 | 11 | 3.358 ± 0.4556 | 0.001 | 112 | 2 | 41 | 9 |
| GSE6883 | 6 | 7.749 ± 0.9192 | 3 | 6.301 ± 0.3781 | 0.0381 | 6 | 0 | 3 | 3 |
Figure 4.
The mRNA expression levels of CHEK1 between BC tissues and normal tissues in each GEO chip (P < 0.05). The blue represents BC tissue, and green represents normal tissue.
Figure 5.
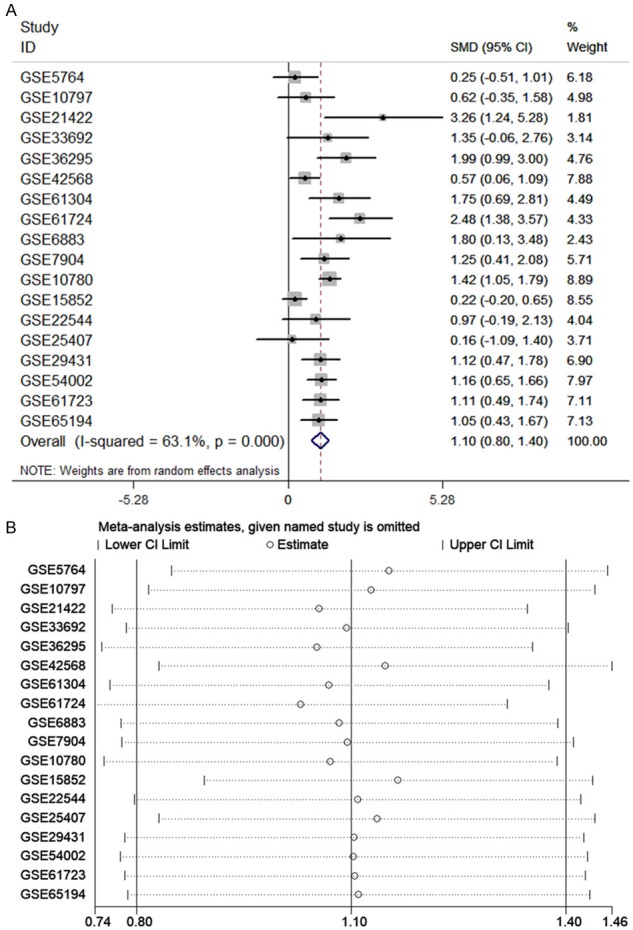
The meta-analysis assessing the expression level of CHEK1 in BC patients. A. Forest plot of 18 microarrays evaluating the SMD of CHEK1; B. sensitivity analysis evaluating the source of heterogeneity.
Figure 6.
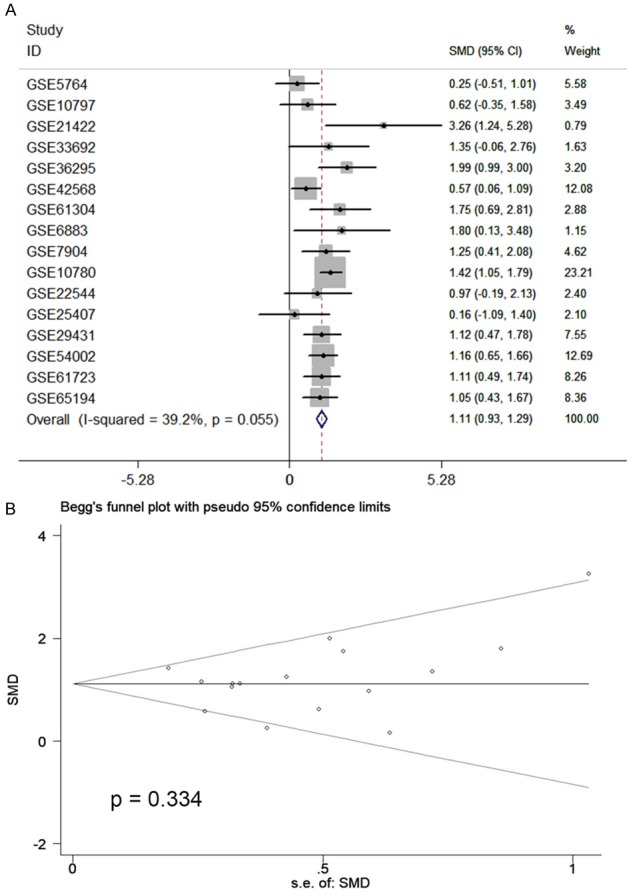
The meta-analysis assessing the expression level of CHEK1 in BC patients. A. Forest plot of 16 microarrays evaluating the SMD of CHEK1 after deletion of GSE15852 and GSE61724; B. Begg’s test to evaluate the publication bias of 16 studies (P = 0.334).
Figure 7.
The ROC curves evaluating the potential diagnostic value of CHEK1 in BC patients (P < 0.05). The X-axis represents 1- specificity, and the Y-axis represents sensitivity. The results only include those ROC curves with P < 0.05.
Figure 9.
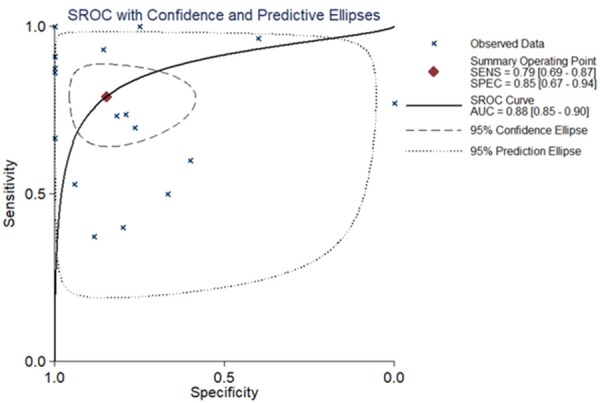
The sROC curve evaluating the potential diagnostic value of CHEK1 in distinguishing BC tissues from normal breast tissues. The X-axis represents specificity and the Y-axis represents sensitivity.
Figure 8.
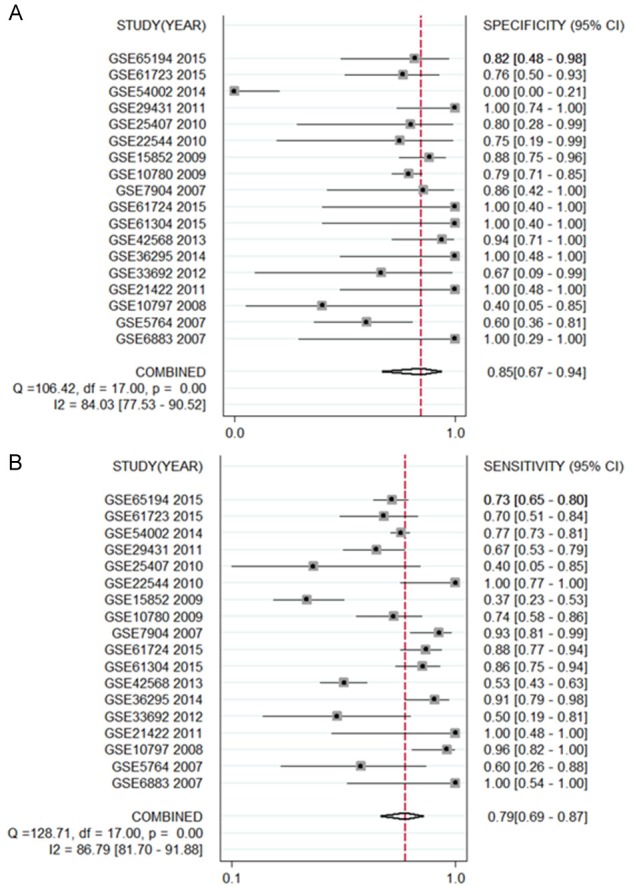
The forest plots concerning a specificity of 0.85 (A) and a sensitivity of 0.79 (B) of CHEK1 based on GEO database.
The validation of CHEK1 protein and its clinical value in breast cancer
Information from experimental samples
According to the criteria mentioned above, 45 cases of breast carcinoma were enrolled to validate CHEK1 protein levels (Table 2). Luminal A included 23 cases; luminal B included 12 cases; triple negative included five cases; and HER-2 overexpression included five cases.
Table 2.
The clinicopathological features from the 45 selected breast carcinoma patients
| Clinicopathological features | Groups | Cases | Percentage (%) |
|---|---|---|---|
| Age (year) | ≤ 50 | 23 | 46.0 |
| > 50 | 22 | 44.0 | |
| Histological grade | I | 1 | 2.00 |
| II | 37 | 74.0 | |
| III | 7 | 14.0 | |
| Lymph node metastasis | Yes | 25 | 55.6 |
| No | 20 | 44.4 | |
| Molecular types | Luminal A | 23 | 51.1 |
| Luminal B | 12 | 26.7 | |
| HER-2 | 5 | 11.1 | |
| Triple-negative | 5 | 11.1 |
CHEK1 protein levels in the BC tissues and their clinical significance
Among the 45 cases of experimental samples, the CHEK1 protein was positively expressed in 40 cases (a positive rate of 88.9%). Of these 40, the CHEK1 protein was weakly-positively expressed in two cases (4.4%), moderately-positively expressed in 35 cases (77.8%), and strongly-positively expressed in three cases (6.7%) (Figure 10). Among the 15 samples of adjacent tissues, only five (33.3%) showed weakly-positive expressions of CHEK1 (Table 3; Figure 11). A statistically significant difference was observed from Fisher’s exact test (P < 0.001), suggesting that a high level of CHEK1 protein was exhibited in the BC tissues. However, no statistical significance was observed to demonstrate the relations between CHEK1 protein levels and clinicopathological features (age, tumor size, molecular classification, tumor stages, lymph node metastasis) in BC patients (P > 0.05) (Table 4). Interestingly, the CHEK1 protein was found to be correlated with tumor stages (P = 0.004), which is consistent with the aforementioned result that the CHEK1 mRNA level was related to tumor stages in BC patients.
Figure 10.
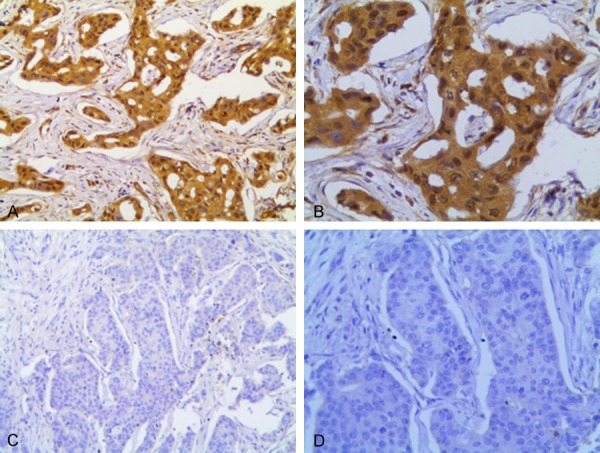
Expression levels of CHEK1 protein in BC. (A, B) CHEK1 expression is (+++) in breast cancer; (C, D) CHEK1 expression is (-) in breast cancer. (A and C) original magnification × 20; (B and D) original magnification × 100).
Table 3.
The differences of the CHEK1 protein in the 45 BC tissues and 15 adjacent tissues
| Adjacent (n = 15) | BC (n = 45) | Sum (n = 60) | |
|---|---|---|---|
| CHEK1 (-) | 10 (66.7%) | 5 (11.1%) | 15 (25.0%) |
| CHEK1 (+) | 5 (33.3%) | 2 (4.4%) | 7 (11.7%) |
| CHEK1 (++) | 0 (0%) | 35 (77.8%) | 35 (58.3%) |
| CHEK1 (+++) | 0 (0%) | 3 (6.7%) | 3 (5.0%) |
Fisher’s exact test: P < 0.001.
Figure 11.
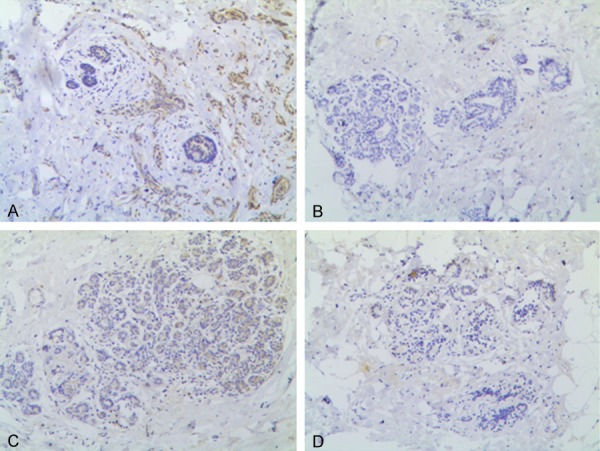
Expression levels of CHEK1 protein in paraneoplastic breast epithelial tissues. A, C. CHEK1 expression is (+) in breast epithelial tissues; B, D. CHEK1 expression is (-) in breast epithelial tissues (original magnification × 10).
Table 4.
The correlation between the CHEK1 protein and clinical parameters
| Clinical parameters | CHEK1 (-) | CHEK1 (+) | CHEK1 (++) | CHEK1 (+++) | Sum (n = 45) | P-value |
|---|---|---|---|---|---|---|
| Menopause status (years) | 0.475 | |||||
| Pre-menopause | 2 | 1 | 8 | 1 | 12 | |
| Post-menopause | 3 | 1 | 27 | 2 | 33 | |
| Molecular sub-types | 0.674 | |||||
| Luminal A | 2 | 2 | 19 | 0 | 23 | |
| Luminal B | 2 | 0 | 9 | 1 | 12 | |
| Triple-negative | 0 | 0 | 4 | 1 | 5 | |
| HER-2 | 1 | 0 | 3 | 1 | 5 | |
| Tumor sizes | 0.138 | |||||
| < 2 cm | 3 | 1 | 6 | 1 | 11 | |
| 2-5 cm | 2 | 1 | 26 | |||
| > 5 cm | 0 | 0 | 3 | 0 | 3 | |
| Histological grade | 0.544 | |||||
| I | 0 | 0 | 1 | 0 | 1 | |
| II | 5 | 2 | 30 | 0 | 37 | |
| III | 0 | 0 | 4 | 3 | 7 | |
| Lymph node metastasis | 0.642 | |||||
| No | 3 | 1 | 15 | 1 | 20 | |
| Yes | 2 | 1 | 20 | 2 | 25 |
Genetic alterations and gene functional annotations
Genetic alterations of CHEK1 and their prognostic significance in BC patients
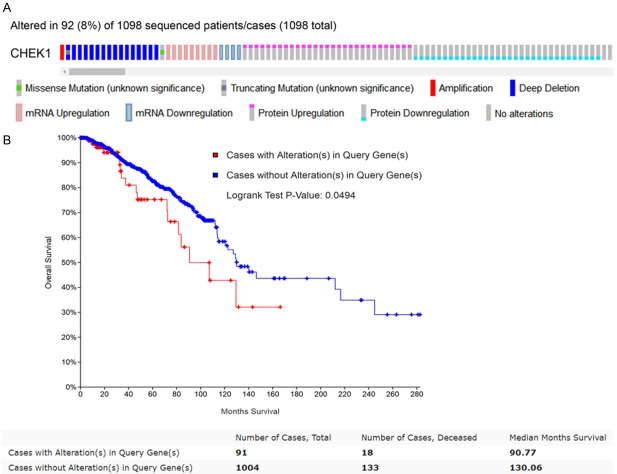
CHEK1’s genetic alterations and their prognostic value in BC patients were determined using the 1,098 sequencing BC data samples provided by the TCGA database. The OncoPrint schematic (Figure 12A) construed by cBioPortal suggested that CHEK1 was altered in 92 (8%) of the 1,098 sequencing cases, including one case of missense mutation, one case of amplification, one mixed case of deep deletion and truncating mutation, four cases of down-regulation, nine cases of mRNA up-regulation, 15 cases of deep deletion, 29 cases of protein up-regulation, and 32 cases of protein down-regulation. Then, the correlation between these CHEK1 gene alterations and overall survival in BC patients was determined by a survival curve (Figure 12B), and a significantly separate trend was exhibited, indicating that these CHEK1 gene alterations were considered risk factors for BC patients’ prognoses. Concerning copy-number alterations, there was no remarkable correlation between them and CHEK1 mRNA levels (Figure 13). Interestingly, the CHEK1 mRNA level was negatively associated with methylation status (Pearson coefficient = -0.37, Spearman coefficient = -0.25) (Figure 14).
Figure 12.
Genetic alterations of CHEK1 and their prognostic significance in BC patients. A. The OncoPrint schematic revealing the genetic alterations of CHEK1 in BC patients based on 1,098 BC sequencing data provided by the TCGA database. B. Kaplan-Meier curve evaluating the prognostic significance between CHEK1 alterations and overall survival curves based on 1,098 BC patients. The blue line represents the cases without alterations, and the red line represents cases with alterations.
Figure 13.
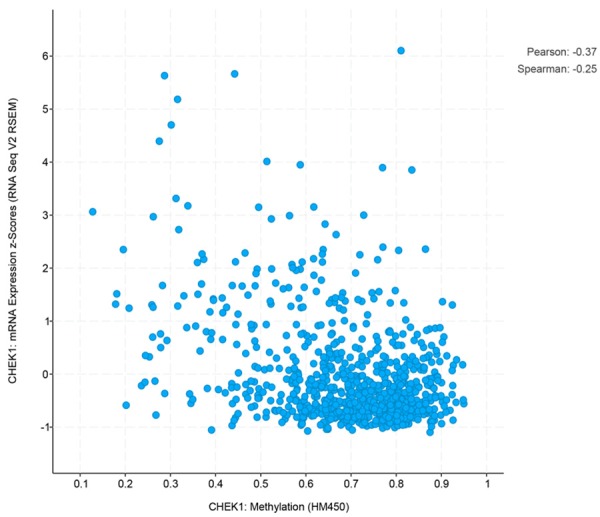
The correlations between the mRNA expression of CHEK1 and level of methylation.
Figure 14.
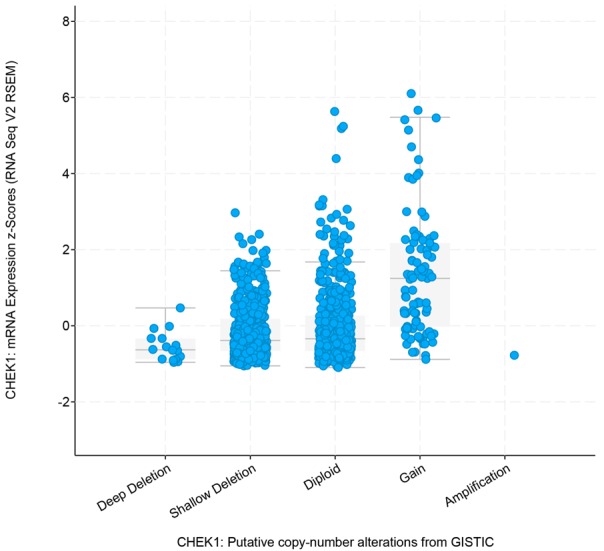
The relationships between the mRNA expression of CHEK1 and specific copy-number alterations.
The co-expressed genes of CHEK1 in BC and relative signaling pathways
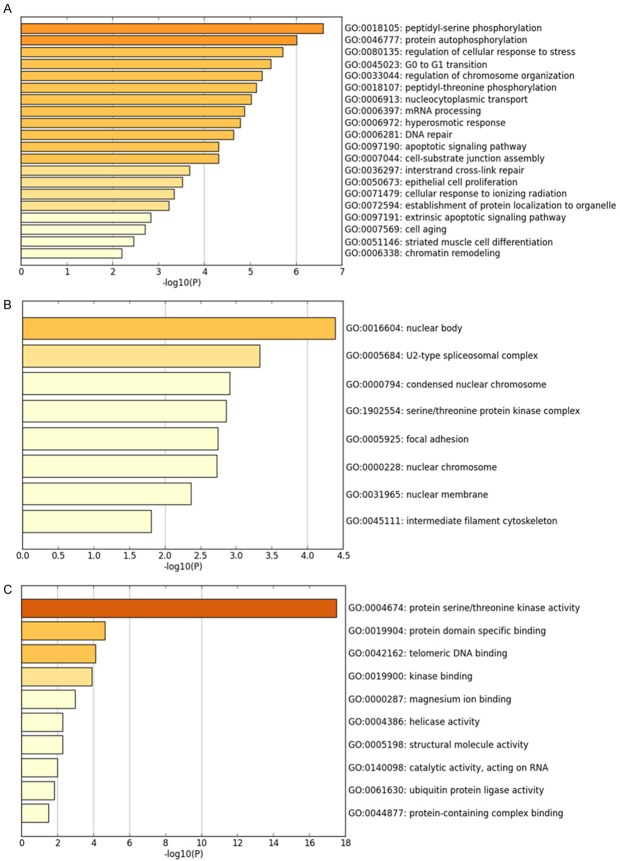
The 50 most frequently altered neighboring genes of CHEK1 in BC’s gene regulation network were obtained from cBioPortal (Table 5); then the PPI networks were constructed by STRING to show the links between these 51 genes (Figure 15). Consequently, the 51 genes were annotated in different GO terms. For the GO pathways in the biological process, the genes were clearly enriched in protein-serine phosphorylation, protein autophosphorylation, regulation of cellular response, and G0 to G1 transition (Figure 16A). Regarding the molecular functions, these genes were obviously linked to protein serine/threonine kinase activity, protein domain specific binding, and telomeric DNA binding (Figure 16B), and, for cellular function, these genes were annotated in the same pathways as those of the molecular functions (Figure 16C). Additionally, five significant pathways were achieved by the KEGG analysis, and, interestingly, several of them were closely related to the occurrence and development of human cancers, such as the cell cycle and the MAPK signaling pathway (Table 6; Figure 17). A total of four genes involved in the cell cycle pathway (CHEK1, RB1, YWHAZ, and TFDP1), and their interactions and correlations are displayed in Figure 18. The expression level of CHEK1 mRNA was positively correlated to YWHAZ and TFDP1 but negatively correlated to RB1.
Table 5.
The 50 most frequently altered neighbor genes of CHEK1 in the BC gene regulation network
| AKT3 | MOS | TAOK2 | CWC25 | PSKH2 |
|---|---|---|---|---|
| ARHGEF2 | MED1 | TFDP1 | DDX19A | RAD9A |
| BUD13 | NEK8 | TLK2 | EPRS | RB1 |
| CAMSAP2 | NUAK2 | TTN | ERN1 | RBM26 |
| CDC42BPA | NUP153 | UBE2T | FAAP100 | RFC4 |
| CHD7 | OBSCN | UHMK1 | KPNA2 | RIPK2 |
| CHTOP | PDPK1 | WNK1 | LAMC1 | RPA1 |
| CKS1B | POP4 | XRCC6 | LMNA | RPL19 |
| CTR9 | PRPF3 | YWHAZ | MDM4 | RPS6KC1 |
| CTTN | PRRC2C | ZNF395 | SMG1 | SRRM2 |
Figure 15.
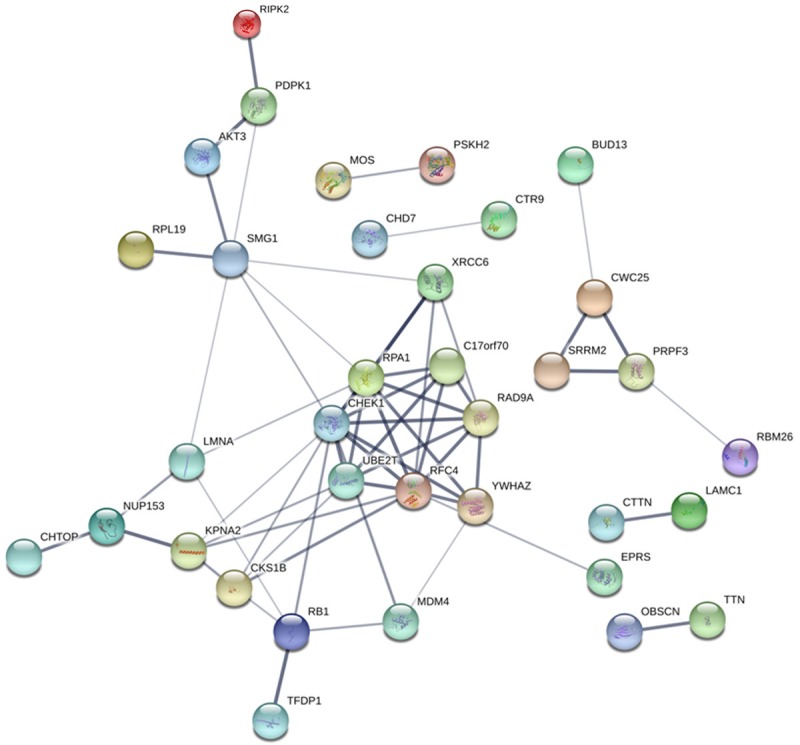
PPI network showing the links between CHEK1 and the 50 most frequently altered neighbor genes of CHEK1 in the BC gene regulation network. Each network node represents one kind of protein; the edges stand for protein-protein associations; and the disconnect nodes are hidden in the network exhibition.
Figure 16.
GO analysis and the 50 most frequently altered neighbor genes of CHEK1 in the BC gene regulation network (P < 0.05). A. Biological process. B. Cellular component. C. Molecular function.
Table 6.
The significant pathways of KEGG analysis
| Pathway ID | KEGG Pathway | P-value (Log10) | Genes |
|---|---|---|---|
| hsa05222 | Small cell lung cancer | -4.406141973 | CKS1B, LAMC1, RB1, AKT3 |
| hsa04110 | Cell cycle | -3.748235958 | CHEK1, RB1, TFDP1, YWHAZ |
| hsa05130 | Pathogenic Escherichia coli infection | -3.579166794 | CTTN, YWHAZ, ARHGEF2 |
| hsa03460 | Fanconi anemia pathway | -3.579166794 | RPA1, UBE2T, FAAP100 |
| hsa03460 | Fanconi anemia pathway | -3.579166794 | RPA1, UBE2T, FAAP100 |
| hsa04010 | MAPK signaling pathway | -1.698969025 | MOS, TAOK2, AKT3 |
Figure 17.
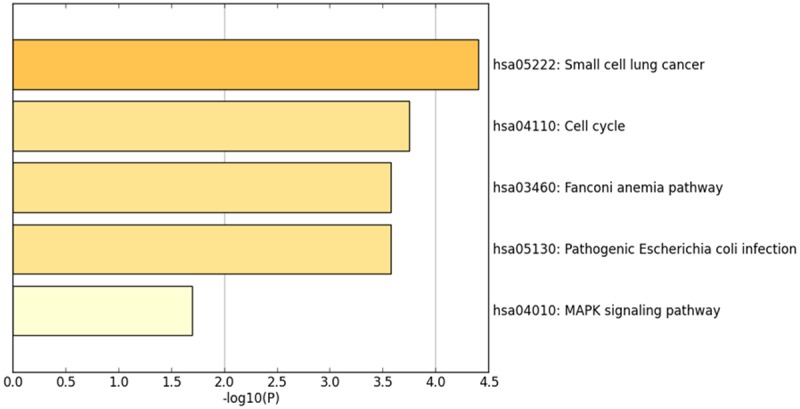
KEGG pathway analysis and the 50 most frequently altered neighbor genes of CHEK1 in the BC gene regulation network (P < 0.05).
Figure 18.
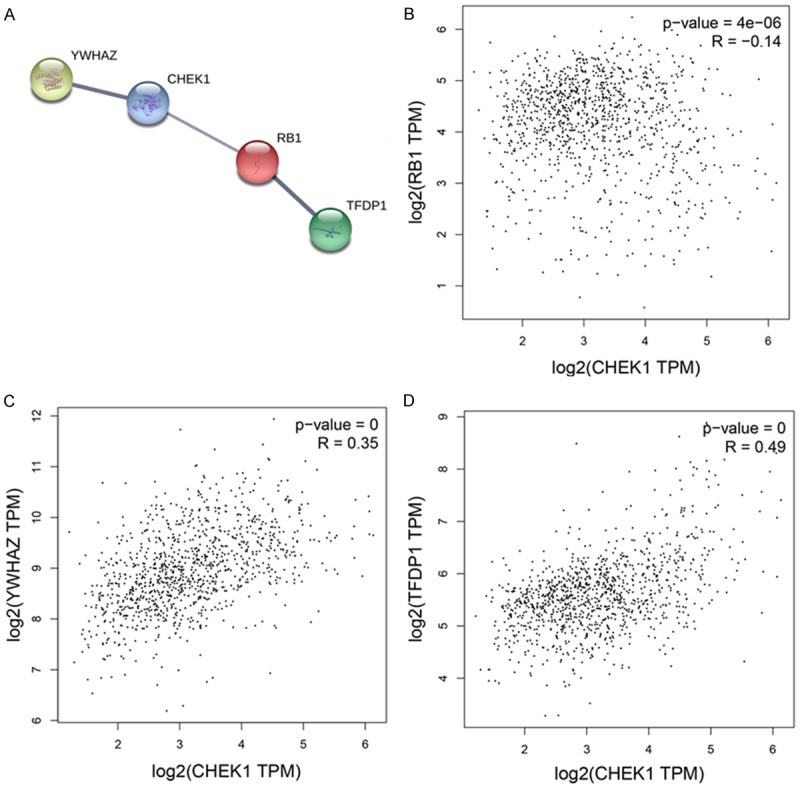
Interactions and correlations of related genes in the cell cycle pathway. A. PPI of related genes. B. Correlations between CHEK1 and RB1. C. YWHAZ. D. TFDP1.
Discussion
In recent years, high-throughput RNA sequencing technology has been widely applied to investigate the underlying mechanism of human cancers based on genome-wide association analysis [27]. Consequently, many differently expressed genes are identified and further proven to greatly contribute to tumorigenesis [28]. They are also considered efficient biomarkers for the early diagnosis and prognosis of human cancers with immensely applicative prospects.
As previously reported, we observed that CHEK1 is differently expressed in various types of human cancer-such as cervical cancer, gastric cancer, etc.-by examining a wide array of extant literature. Several studies, utilizing the immunohistochemical method, have detected a significant overexpression of the CHEK1 protein in cervical cancer tissues, as compared to normal and inflammatory cervical tissues. Also, in cervical cancer, the highly-expressed CHEK1 protein has been related to the differentiation degree, but does not show relationships with age, pathological types, and clinical stages. Overexpressed CHEK1 protein is also discovered in gastric cancer patients, and the patients with a highly-expressed CHEK1 protein are more likely to face a high risk of advanced histological grade stages and lymph node metastasis [29-31]. Beyond this, research has also reported that the CHEK1 protein is highly expressed in triple-negative breast cancer, and its levels are closely related to the pathological grades [14]. What’s more, MK-8776 and AZD7762 are found to be targets of CHEK1 for radiation therapy for triple-negative breast carcinoma, directly suggesting the important role of CHEK1 in the pathogenesis of breast cancer [32,33]. However, to date there are few comprehensive studies to systemically illustrate the expression and clinical value of CHEK1 in BC patients.
In this study, we determined the high expression of CHEK1 mRNA levels in BC tissues with large samples based on integrating the GEO and TCGA databases. The results of TCGA and singular microarrays, as well as the meta-analysis, ensured the credibility of CHEK1 mRNA up-regulation in BC tissues, which suggests that overexpressed CHEK1 mRNA might promote the occurrence of BC. It was also revealed that up-regulated CHEK1 could serve as an independent risk biomarker in BC patients’ prognoses, while the genetic alterations of CHEK1 could be considered risk factors in prognosis. A diagnostic meta-analysis suggests the notable ability of CHEK1 mRNA to distinguish BC tissues from non-BC tissues, which provides a helpful, important reference for further prognosis and diagnosis in BC patients. Furthermore, according to the IHC results, we also confirmed that high-level CHEK1 protein existed in the 45 selected cases of BC tissues, as compared to adjacent breast tissues. Nevertheless, we did not discover any relationships between the CHEK1 protein and relevant clinical features, which can likely be attributed to the limited number of experimental samples. In the future, more experiments should be performed, based on the circulating level, to validate the potential application of the CHEK1 mRNA and protein in diagnosing BC patients.
According to previous studies, CHEK1 is a highly conserved protein kinase in the process of biological evolution, and it exerts an essential influence in regulating cell cycle checkpoints caused by DNA damage. Its overexpression may serve a key function among a variety human cancer mechanisms [34-36]. However, the specific mechanism of CHEK1 in BC patients should be further classified. Since a gene generally exerts its specific influences by targeting a diverse range of co-expressed genes, we collected the 50 most frequently altered neighbor genes of CHEK1 in the BC gene regulation network to better reveal CHEK1’s molecular mechanism. After KEGG analysis, it is evident that these relevant genes are annotated in five pathways, among which the cell cycle and the MAPK signaling pathways are reported as highly tumor-related pathways in BC onset and development. Normally, BC occurrence originates from cell cycle dysregulation, which often induces abnormal cell proliferation and causes cell functional and morphological changes, such as the prolongation of cell lifespan and the suppression of cell apoptosis, further leading to fatal pathological damage to the human body [37-39]. The activation of the MAPK signaling pathway is also reported as vital to regulating cell proliferation, growth, and BC migration [40-42]. An in vitro experiment suggested that isoalantolactone could suppress BC cell metastasis and invasion (MDA-MB-231 cell lines) by inhibiting the p38 MAPK/NF-κB signaling pathway [43]. Therefore, CHEK1 might promote the development of BC by activating the cell cycle and the MAPK signaling pathway, which suggests that CHEK1 could serve as a potential therapeutic target in chemotherapy for BC patients.
Despite the discoveries mentioned above, some limitations in this research still should be illustrated. First, the potential diagnostic value of CHEK1 should be validated with more clinical trials, based on the circulating level, such as the human serum. Second, the relations between the CHEK1 protein and the clinicopathological features must be determined using a larger number of BC patients. Third, a further investigation of CHEK1’s role in BC should be performed through in vitro experiments with the cell lines of CHEK1 knockout.
In the current study, we confirm that both the CHEK1 mRNA and protein are highly expressed in BC tissues. The prognostic analysis suggests that both high-levels of mRNA and genetic alterations in CHEK1 can be regarded as independent or combined prognosis factors, revealing that those BC patients with high-levels of CHEK1 mRNA or CHEK1 alterations are more likely to face unpleasant prognoses. CHEK1 overexpression may also contribute to BC occurrence by regulating some specific pathways, such as the cell cycle and the MAPK signaling pathway. In the future, more studies are needed to confirm the current results.
Acknowledgements
The study was supported by the fund of Future Academic Star of Guangxi Medical University (WLXSZX18089) and the Student’s Platform for Innovation and Entrepreneurship Training Program (201810598004).
Disclosure of conflict of interest
None.
References
- 1.Baeyens-Fernandez JA, Molina-Portillo E, Pollan M, Rodriguez-Barranco M, Del Moral R, Arribas-Mir L, Sanchez-Cantalejo Ramirez E, Sanchez MJ. Trends in incidence, mortality and survival in women with breast cancer from 1985 to 2012 in Granada, Spain: a population-based study. BMC Cancer. 2018;18:781. doi: 10.1186/s12885-018-4682-1. [DOI] [PMC free article] [PubMed] [Google Scholar]
- 2.Zhang WW, Wu SG, Sun JY, Li FY, He ZY. Long-term survival effect of the interval between mastectomy and radiotherapy in locally advanced breast cancer. Cancer Manag Res. 2018;10:2047–2054. doi: 10.2147/CMAR.S163863. [DOI] [PMC free article] [PubMed] [Google Scholar]
- 3.Siegel RL, Miller KD, Jemal A. Cancer statistics, 2018. CA Cancer J Clin. 2018;68:7–30. doi: 10.3322/caac.21442. [DOI] [PubMed] [Google Scholar]
- 4.Sobota A, Ozakinci G. Determinants of fertility issues experienced by young women diagnosed with breast or gynaecological cancer - a quantitative, cross-cultural study. BMC Cancer. 2018;18:874. doi: 10.1186/s12885-018-4766-y. [DOI] [PMC free article] [PubMed] [Google Scholar]
- 5.Fajka-Boja R, Marton A, Toth A, Blazso P, Tubak V, Balint B, Nagy I, Hegedus Z, Vizler C, Katona RL. Increased insulin-like growth factor 1 production by polyploid adipose stem cells promotes growth of breast cancer cells. BMC Cancer. 2018;18:872. doi: 10.1186/s12885-018-4781-z. [DOI] [PMC free article] [PubMed] [Google Scholar]
- 6.Xing P, Dong H, Liu Q, Zhao T, Yao F, Xu Y, Chen B, Zheng X, Wu Y, Jin F, Li J. ALDH1 expression and vasculogenic mimicry are positively associated with poor prognosis in patients with breast cancer. Cell Physiol Biochem. 2018;49:I. doi: 10.1159/000493227. [DOI] [PubMed] [Google Scholar]
- 7.Zhang T, Wu DM, Deng SH, Han R, Liu T, Li J, Xu Y. Integrated analysis reveals that long non-coding RNA TUBA4B can be used as a prognostic biomarker in various cancers. Cell Physiol Biochem. 2018;49:530–544. doi: 10.1159/000492991. [DOI] [PubMed] [Google Scholar]
- 8.Li B, Chen P, Wang J, Wang L, Ren M, Zhang R, He J. MicroRNA-1254 exerts oncogenic effects by directly targeting RASSF9 in human breast cancer. Int J Oncol. 2018;53:2145–2156. doi: 10.3892/ijo.2018.4530. [DOI] [PubMed] [Google Scholar]
- 9.Meng LL, Wang JL, Xu SP, Zu LD, Yan ZW, Zhang JB, Han YQ, Fu GH. Low serum gastrin associated with ER(+) breast cancer development via inactivation of CCKBR/ERK/P65 signaling. BMC Cancer. 2018;18:824. doi: 10.1186/s12885-018-4717-7. [DOI] [PMC free article] [PubMed] [Google Scholar]
- 10.Broeders MJM, Allgood P, Duffy SW, Hofvind S, Nagtegaal ID, Paci E, Moss SM, Bucchi L. The impact of mammography screening programmes on incidence of advanced breast cancer in Europe: a literature review. BMC Cancer. 2018;18:860. doi: 10.1186/s12885-018-4666-1. [DOI] [PMC free article] [PubMed] [Google Scholar]
- 11.Gu L, Chu P, Lingeman R, McDaniel H, Kechichian S, Hickey RJ, Liu Z, Yuan YC, Sandoval JA, Fields GB, Malkas LH. The mechanism by which MYCN amplification confers an enhanced sensitivity to a PCNA-derived cell permeable peptide in neuroblastoma cells. EBioMedicine. 2015;2:1923–1931. doi: 10.1016/j.ebiom.2015.11.016. [DOI] [PMC free article] [PubMed] [Google Scholar]
- 12.Thompson R, Meuth M, Woll P, Zhu Y, Danson S. Treatment with the Chk1 inhibitor Go6976 enhances cisplatin cytotoxicity in SCLC cells. Int J Oncol. 2012;40:194–202. doi: 10.3892/ijo.2011.1187. [DOI] [PubMed] [Google Scholar]
- 13.Wang L, Wang Y, Chen A, Jalali A, Liu S, Guo Y, Na S, Nakshatri H, Li BY, Yokota H. Effects of a checkpoint kinase inhibitor, AZD7762, on tumor suppression and bone remodeling. Int J Oncol. 2018;53:1001–1012. doi: 10.3892/ijo.2018.4481. [DOI] [PMC free article] [PubMed] [Google Scholar]
- 14.Bryant C, Rawlinson R, Massey AJ. Chk1 inhibition as a novel therapeutic strategy for treating triple-negative breast and ovarian cancers. BMC Cancer. 2014;14:570. doi: 10.1186/1471-2407-14-570. [DOI] [PMC free article] [PubMed] [Google Scholar]
- 15.Dufau I, Frongia C, Sicard F, Dedieu L, Cordelier P, Ausseil F, Ducommun B, Valette A. Multicellular tumor spheroid model to evaluate spatio-temporal dynamics effect of chemotherapeutics: application to the gemcitabine/CHK1 inhibitor combination in pancreatic cancer. BMC Cancer. 2012;12:15. doi: 10.1186/1471-2407-12-15. [DOI] [PMC free article] [PubMed] [Google Scholar]
- 16.Meng F, Bhupathi D, Sun JD, Liu Q, Ahluwalia D, Wang Y, Matteucci MD, Hart CP. Enhancement of hypoxia-activated prodrug TH-302 anti-tumor activity by Chk1 inhibition. BMC Cancer. 2015;15:422. doi: 10.1186/s12885-015-1387-6. [DOI] [PMC free article] [PubMed] [Google Scholar]
- 17.Buisson R, Boisvert JL, Benes CH, Zou L. Distinct but concerted roles of ATR, DNA-PK, and Chk1 in countering replication stress during S phase. Mol Cell. 2015;59:1011–1024. doi: 10.1016/j.molcel.2015.07.029. [DOI] [PMC free article] [PubMed] [Google Scholar]
- 18.Sanjiv K, Hagenkort A, Calderon-Montano JM, Koolmeister T, Reaper PM, Mortusewicz O, Jacques SA, Kuiper RV, Schultz N, Scobie M, Charlton PA, Pollard JR, Berglund UW, Altun M, Helleday T. Cancer-specific synthetic lethality between ATR and CHK1 kinase activities. Cell Rep. 2016;14:298–309. doi: 10.1016/j.celrep.2015.12.032. [DOI] [PMC free article] [PubMed] [Google Scholar]
- 19.Zhang Y, Hunter T. Roles of Chk1 in cell biology and cancer therapy. Int J Cancer. 2014;134:1013–1023. doi: 10.1002/ijc.28226. [DOI] [PMC free article] [PubMed] [Google Scholar]
- 20.Sun X, Clermont PL, Jiao W, Helgason CD, Gout PW, Wang Y, Qu S. Elevated expression of the centromere protein-A(CENP-A)-encoding gene as a prognostic and predictive biomarker in human cancers. Int J Cancer. 2016;139:899–907. doi: 10.1002/ijc.30133. [DOI] [PubMed] [Google Scholar]
- 21.Zhu J, Ma J, Wang X, Ma T, Zhang S, Wang W, Zhou X, Shi J. High expression of PHGDH predicts poor prognosis in non-small cell lung cancer. Transl Oncol. 2016;9:592–599. doi: 10.1016/j.tranon.2016.08.003. [DOI] [PMC free article] [PubMed] [Google Scholar]
- 22.Tang Z, Li C, Kang B, Gao G, Li C, Zhang Z. GEPIA: a web server for cancer and normal gene expression profiling and interactive analyses. Nucleic Acids Res. 2017;45:W98–W102. doi: 10.1093/nar/gkx247. [DOI] [PMC free article] [PubMed] [Google Scholar]
- 23.Cerami E, Gao J, Dogrusoz U, Gross BE, Sumer SO, Aksoy BA, Jacobsen A, Byrne CJ, Heuer ML, Larsson E, Antipin Y, Reva B, Goldberg AP, Sander C, Schultz N. The cBio cancer genomics portal: an open platform for exploring multidimensional cancer genomics data. Cancer Discov. 2012;2:401–404. doi: 10.1158/2159-8290.CD-12-0095. [DOI] [PMC free article] [PubMed] [Google Scholar]
- 24.Gao J, Aksoy BA, Dogrusoz U, Dresdner G, Gross B, Sumer SO, Sun Y, Jacobsen A, Sinha R, Larsson E, Cerami E, Sander C, Schultz N. Integrative analysis of complex cancer genomics and clinical profiles using the cBioPortal. Sci Signal. 2013;6:pl1. doi: 10.1126/scisignal.2004088. [DOI] [PMC free article] [PubMed] [Google Scholar]
- 25.Tripathi S, Pohl MO, Zhou Y, Rodriguez-Frandsen A, Wang G, Stein DA, Moulton HM, DeJesus P, Che J, Mulder LC, Yanguez E, Andenmatten D, Pache L, Manicassamy B, Albrecht RA, Gonzalez MG, Nguyen Q, Brass A, Elledge S, White M, Shapira S, Hacohen N, Karlas A, Meyer TF, Shales M, Gatorano A, Johnson JR, Jang G, Johnson T, Verschueren E, Sanders D, Krogan N, Shaw M, Konig R, Stertz S, Garcia-Sastre A, Chanda SK. Meta- and orthogonal integration of influenza “OMICs” data defines a role for UBR4 in virus budding. Cell Host Microbe. 2015;18:723–735. doi: 10.1016/j.chom.2015.11.002. [DOI] [PMC free article] [PubMed] [Google Scholar]
- 26.Szklarczyk D, Morris JH, Cook H, Kuhn M, Wyder S, Simonovic M, Santos A, Doncheva NT, Roth A, Bork P, Jensen LJ, von Mering C. The STRING database in 2017: quality-controlled protein-protein association networks, made broadly accessible. Nucleic Acids Res. 2017;45:D362–D368. doi: 10.1093/nar/gkw937. [DOI] [PMC free article] [PubMed] [Google Scholar]
- 27.Warren EH, Matsen FA 4th, Chou J. High-throughput sequencing of B- and T-lymphocyte antigen receptors in hematology. Blood. 2013;122:19–22. doi: 10.1182/blood-2013-03-453142. [DOI] [PMC free article] [PubMed] [Google Scholar]
- 28.Jessri M, Farah CS. Harnessing massively parallel sequencing in personalized head and neck oncology. J Dent Res. 2014;93:437–444. doi: 10.1177/0022034514524783. [DOI] [PubMed] [Google Scholar]
- 29.Bargiela-Iparraguirre J, Prado-Marchal L, Fernandez-Fuente M, Gutierrez-Gonzalez A, Moreno-Rubio J, Munoz-Fernandez M, Sereno M, Sanchez-Prieto R, Perona R, Sanchez-Perez I. CHK1 expression in Gastric Cancer is modulated by p53 and RB1/E2F1: implications in chemo/radiotherapy response. Sci Rep. 2016;6:21519. doi: 10.1038/srep21519. [DOI] [PMC free article] [PubMed] [Google Scholar]
- 30.Bo S, Hui H, Li W, Hui L, Hong X, Lin D, Dai WX, Wu YH, Ai XH, Hao J, Qi S. Chk1, but not Chk2, is responsible for G2/M phase arrest induced by diallyl disulfide in human gastric cancer BGC823 cells. Food Chem Toxicol. 2014;68:61–70. doi: 10.1016/j.fct.2014.03.007. [DOI] [PubMed] [Google Scholar]
- 31.Gomes J, Magalhaes A, Michel V, Amado IF, Aranha P, Ovesen RG, Hansen HC, Gartner F, Reis CA, Touati E. Pteridium aquilinum and its ptaquiloside toxin induce DNA damage response in gastric epithelial cells, a link with gastric carcinogenesis. Toxicol Sci. 2012;126:60–71. doi: 10.1093/toxsci/kfr329. [DOI] [PubMed] [Google Scholar]
- 32.Zhang Y, Lai J, Du Z, Gao J, Yang S, Gorityala S, Xiong X, Deng O, Ma Z, Yan C, Susana G, Xu Y, Zhang J. Targeting radioresistant breast cancer cells by single agent CHK1 inhibitor via enhancing replication stress. Oncotarget. 2016;7:34688–34702. doi: 10.18632/oncotarget.9156. [DOI] [PMC free article] [PubMed] [Google Scholar]
- 33.Zhou ZR, Yang ZZ, Wang SJ, Zhang L, Luo JR, Feng Y, Yu XL, Chen XX, Guo XM. The Chk1 inhibitor MK-8776 increases the radiosensitivity of human triple-negative breast cancer by inhibiting autophagy. Acta Pharmacol Sin. 2017;38:513–523. doi: 10.1038/aps.2016.136. [DOI] [PMC free article] [PubMed] [Google Scholar]
- 34.King C, Diaz HB, McNeely S, Barnard D, Dempsey J, Blosser W, Beckmann R, Barda D, Marshall MS. LY2606368 causes replication catastrophe and antitumor effects through CHK1-dependent mechanisms. Mol Cancer Ther. 2015;14:2004–2013. doi: 10.1158/1535-7163.MCT-14-1037. [DOI] [PubMed] [Google Scholar]
- 35.Narayanaswamy PB, Tkachuk S, Haller H, Dumler I, Kiyan Y. CHK1 and RAD51 activation after DNA damage is regulated via urokinase receptor/TLR4 signaling. Cell Death Dis. 2016;7:e2383. doi: 10.1038/cddis.2016.291. [DOI] [PMC free article] [PubMed] [Google Scholar]
- 36.Smith J, Tho LM, Xu N, Gillespie DA. The ATM-Chk2 and ATR-Chk1 pathways in DNA damage signaling and cancer. Adv Cancer Res. 2010;108:73–112. doi: 10.1016/B978-0-12-380888-2.00003-0. [DOI] [PubMed] [Google Scholar]
- 37.Deka SJ, Roy A, Ramakrishnan V, Manna D, Trivedi V. Danazol has potential to cause PKC translocation, cell cycle dysregulation, and apoptosis in breast cancer cells. Chem Biol Drug Des. 2017;89:953–963. doi: 10.1111/cbdd.12921. [DOI] [PubMed] [Google Scholar]
- 38.Haricharan S, Punturi N, Singh P, Holloway KR, Anurag M, Schmelz J, Schmidt C, Lei JT, Suman V, Hunt K, Olson JA Jr, Hoog J, Li S, Huang S, Edwards DP, Kavuri SM, Bainbridge MN, Ma CX, Ellis MJ. Loss of mutl disrupts CHK2-dependent cell-cycle control through CDK4/6 to promote intrinsic endocrine therapy resistance in primary breast cancer. Cancer Discov. 2017;7:1168–1183. doi: 10.1158/2159-8290.CD-16-1179. [DOI] [PMC free article] [PubMed] [Google Scholar]
- 39.Kang S, Kim B, Kang HS, Jeong G, Bae H, Lee H, Lee S, Kim SJ. SCTR regulates cell cycle-related genes toward anti-proliferation in normal breast cells while having pro-proliferation activity in breast cancer cells. Int J Oncol. 2015;47:1923–1931. doi: 10.3892/ijo.2015.3164. [DOI] [PubMed] [Google Scholar]
- 40.Ebbesen SH, Scaltriti M, Bialucha CU, Morse N, Kastenhuber ER, Wen HY, Dow LE, Baselga J, Lowe SW. Pten loss promotes MAPK pathway dependency in HER2/neu breast carcinomas. Proc Natl Acad Sci U S A. 2016;113:3030–3035. doi: 10.1073/pnas.1523693113. [DOI] [PMC free article] [PubMed] [Google Scholar]
- 41.Mutlu M, Saatci O, Ansari SA, Yurdusev E, Shehwana H, Konu O, Raza U, Sahin O. miR-564 acts as a dual inhibitor of PI3K and MAPK signaling networks and inhibits proliferation and invasion in breast cancer. Sci Rep. 2016;6:32541. doi: 10.1038/srep32541. [DOI] [PMC free article] [PubMed] [Google Scholar]
- 42.Wang W, Zou L, Zhou D, Zhou Z, Tang F, Xu Z, Liu X. Overexpression of ubiquitin carboxyl terminal hydrolase-L1 enhances multidrug resistance and invasion/metastasis in breast cancer by activating the MAPK/Erk signaling pathway. Mol Carcinog. 2016;55:1329–1342. doi: 10.1002/mc.22376. [DOI] [PubMed] [Google Scholar]
- 43.Wang J, Cui L, Feng L, Zhang Z, Song J, Liu D, Jia X. Isoalantolactone inhibits the migration and invasion of human breast cancer MDA-MB-231 cells via suppression of the p38 MAPK/NF-kappaB signaling pathway. Oncol Rep. 2016;36:1269–1276. doi: 10.3892/or.2016.4954. [DOI] [PubMed] [Google Scholar]


