Abstract
Background
In an atherosclerotic artery wall, monocyte-derived macrophages are the principal mediators that respond to pathogens and inflammation. The present study aimed to investigate potential genetic changes in gene expression between normal tissue-resident macrophages and atherosclerotic macrophages in the human body.
Material/Methods
The expression profile data of GSE7074 acquired from the Gene Expression Omnibus (GEO) database, which includes the transcriptome of 4 types of macrophages, was downloaded. Differentially expressed genes (DEGs) were identified using R software, then we performed functional enrichment, protein-protein interaction (PPI) network construction, key node and module analysis, and prediction of microRNAs (miRNAs)/transcription factors (TFs) targeting genes.
Results
After data processing, 236 DEGs were identified, including 21 upregulated genes and 215 downregulated genes. The DEG set was enriched in 22 significant Gene Ontology (GO) terms and 25 Kyoto Encyclopedia of Genes and Genomes (KEGG) pathways, and the PPI network constructed with these DEGs comprised 6 key nodes with degrees ≥8. Key nodes in the PPI network and simultaneously involved in the prime modules, including rhodopsin (RHO), coagulation factor V (F5), and bestrophin-1 (BEST1), are promising for the prediction of atherosclerotic plaque formation. Furthermore, in the miRNA/TF-target network, hsa-miR-3177-5p might be involved in the pathogenesis of atherosclerosis via regulating BEST1, and the transcription factor early growth response-1 (EGR1) was found to be a potential promoter in atherogenesis.
Conclusions
The identified key hub genes, predicted miRNAs/TFs, and underlying molecular mechanisms may be involved in atherogenesis, thus potentially contributing to the treatment and diagnosis of patients with atherosclerotic disease.
MeSH Keywords: Atherosclerosis, Gene Expression Profiling, Macrophages, Protein Array Analysis
Background
Atherosclerosis is a chronic inflammatory disease in large arteries; it can cause life-threatening cardiac or cerebral vascular events, such as myocardial infarction and ischemic stroke. The main features of atherosclerotic lesions are that they contain subintimal lipid deposition in certain parts of the arteries, and they have the abnormal proliferation of smooth muscle cells or fibrous matrix components [1,2]. This causes a healthy arterial wall to thicken and lose elasticity, eventually leading to atherosclerotic plaque formation.
Macrophage accumulation for depositional lipid elimination in the subendothelial region of the arterial wall is a hallmark of atherosclerosis. These cells laden with lipid facilitate inflammatory responses within the wall of the artery that can cause diverse fatal consequences, such as rupture, hemorrhage, and calcification [3,4]. In early stages, atherogenesis is propelled by the infiltration of monocytes underneath the vascular endothelium. After their differentiation into macrophages, they tend to clear the excess depositional lipids and lipoproteins in the neointima, causing the macrophages to become engorged with lipids and terminally lacking the ability to emigrate from the plaque [5,6]. Indeed, this process contributes to the development of a local arterial inflammatory state and thus generates a chronic and complicated atherosclerotic lesion [7]. The macrophages are present in various lesion regions, such as the plaque shoulder, next to the necrotic core, next to blood vessels, or in the zone next to the rigid and calcified arterial zone [8]. Nevertheless, wherever they are in the atherosclerotic plaque, macrophages are sensitive to the complex micro-environment and they are continuously facing stimuli, or external signals, including cytokines, calcium, and iron [9–11]. Thus, macrophage phenotypes could be influenced by these factors, which manifest different patterns called polarization or activation. In turn, macrophages also influence and mostly control the atherosclerosis-related processes from initiation to maturity.
In recent years, several studies have revealed the role of genetic changes or genetic transcription in the modulation of macrophage phenotype in atherosclerosis. Macrophages can display a continuous phenotype described by different gene expression profiles with the ability to switch from one phenotype to another based on external stimuli. Genetic factors have important impacts on the regulation of macrophage phenotypes involved in the pathogenesis of atherosclerosis. The expression level of a few factors positively correlates with the expression of macrophage markers such as LXRα, PPARγ, and KLF4 [9,12,13]. Therefore, transcription factors, or post-transcriptional regulators, and other related signaling molecules play key roles in the control of macrophage differentiation and polarization; significant changes in expression levels of distinct transcripts clearly occur [14,15]. As mentioned above, evidence has shown that the potential therapeutic targets for atherosclerotic disease may be hiding under the abnormally variable transcriptome. Therefore, it is important to explore the possible mechanisms underlying global changes in gene expression during the physiopathological process of macrophages, which may help to provide more reliable and effective early diagnostic molecular markers for blocking and controlling the progression of atherosclerotic diseases. Microarray technology is an efficient tool for obtaining accurate data on general gene expression levels, and it has been widely used to study overall patterns of gene expression changes in different diseases. These microarrays offer a new approach to study disease-related genes and provide evidence for prognosis and potential molecular targeted therapy [16]. Recently, large amounts of gene chip data have been uploaded to public databases, and using these specific data provide a chance to deeply study the molecular mechanisms in diseases.
The present study aimed to re-analyze the data of GSE7074 (a data set derived from the GEO database, which contains the required transcriptome data) using bioinformatics methods to identify significant differentially expressed genes (DEGs) of resident macrophages in human normal tissue (alveolus, spleen, liver) and in atherosclerotic plaque. After PCA analysis, functional annotation and pathway enrichment were then performed, followed by the construction of protein-protein interaction (PPI) networks, analysis of key nodes, and the regulatory relationship prediction between microRNA/transcription factors (TFs) and DEGs. These analyses allowed us to discover key genes and to develop new insights for understanding the role of macrophages in atherosclerotic plaque formation, as well as suggesting potential new directions in the study of atherosclerosis.
Material and Methods
Microarray data
The microarray data of GSE7074 were downloaded from Gene Expression Omnibus (GEO); the platform for this dataset is GPL4868, AMC-MAD Homo sapiens 19k ver 1.0. The dataset contained 30 samples, including atherosclerotic (carotid arteries) and nonatherosclerotic (lung, liver, and spleen, macrophages were isolated and derived from the patients without any clinical symptoms of systemic inflammation or malignancies) tissues, that were uploaded by Eijgelaar WJ and Horrevoets AJ [17]. Series matrix files and platform information were downloaded, and expression profile data preprocessing was performed using the R software package (R version 3.5.0). Data preprocessing included converting and rejecting the unqualified data, calibration, filling in of missing data, and standardization.
PCA analysis, identification of DEGs, and hierarchical clustering analysis
Principal component analysis (PCA) is a dimension reduction approach, which can effectively represent the effects of the measurements or dataset consisting of a large number of interrelated variables [18]. PCA for this dataset was conducted using R software, and the results were visualized. After the probe ID was converted into a universal name for genes (official gene symbol), gene differential expression analysis was performed using the limma package (from the Bioconductor, http://www.bioconductor.org/), in R as well. Gene expression levels of samples with an adjusted P value <0.05 and |log2-fold change (FC)| >0.58 were considered as valid DEGs. Clustering analysis was then performed using the pheatmap package (from the Comprehensive R Archive Network, https://cran.r-project.org).
Functional and pathway enrichment analyses of DEGs
The DAVID online analysis database (https://david.ncifcrf.gov/) provides functional classification and annotation analyses of candidate genes [19], and Kyoto Encyclopedia of Genes and Genomes (KEGG) enrichment analysis offers a way to detect the potential various types of biochemistry pathways. The functional and pathway enrichment analyses were performed using the DAVID database and the KOBAS database (http://kobas.cbi.pku.edu.cn), respectively. To comprehensively evaluate the relevant pathways, or biological procedures, of macrophages in atherosclerotic plaque, Gene Ontology (GO) and pathway enrichment analyses on DEGs were carried out through the online tools with a threshold of P values <0.05.
Protein–protein interaction (PPI) network construction
The STRING database (http://string-db.org/) is an interactive online tool for identifying interactions or associations between proteins [20]. In the present study, STRING was used to predict the interactions among proteins encoded by DEGs. A combined score ≥0.4 of PPI pairs was considered significant and was chosen to be visualized by constructing a PPI network. The proteins in the network act as the “nodes” and nodes in the central positions may be core roles, which mean that they can be the pivotal candidate proteins/genes with crucial biological functions in the regulatory network. Moreover, the hub nodes were identified by a high score based on the method of degree ranking.
Network module analysis
The plugin of MCODE in Cytoscape [21] was used to analyze the significant module in the PPI network. The MCODE algorithm can calculate the number of close interactions and enrichments of the subnet module, and higher scores of the module presented indicate that the interaction relations inside the module were more closed. According to the analysis, the modules with score ≥5 and node ≥5 were selected. Then, pathway enrichment for the DEGs in modules was analyzed.
Prediction of miRNA-target gene regulatory relations
The miRNA and target genes regulatory network analysis was performed using the Enrichr [22] (http://amp.pharm.mssm.edu/Enrichr/). The predicted miRNAs and target DEGs were identified based on the network geometric test. With the threshold of P value <0.05, the regulatory network between miRNA and target DEGs was visualized using the Cytoscape.
Prediction of transcription factor (TF)-target network
The regulatory network between TFs and target DEGs were predicted using Enrichr, with the threshold of P value <0.05, and significant TFs and target DEGs relationships were visualized using Cytoscape.
Results
PCA analysis and identification of DEGs in human atherosclerotic macrophages
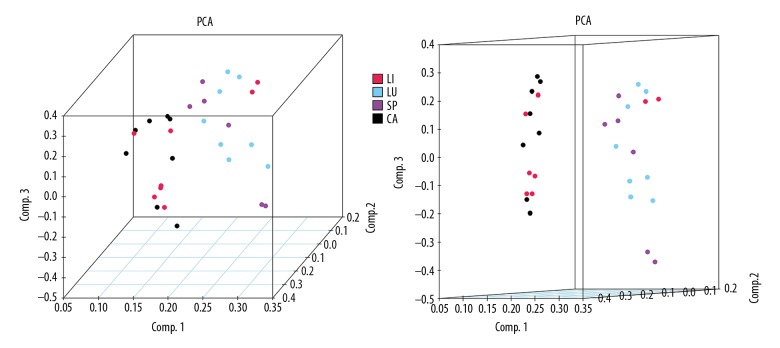
To better define the heterogeneity of gene expression levels between human atherosclerotic macrophages and nonatherosclerotic macrophages, a principal component analysis was performed in R. The result was visualized using a 3D PCA scatterplot (Figure 1), which indicated that most of the nonatherosclerotic sample data in the present study had an obvious distribution difference compare to the atherosclerotic samples (points of different colors represent samples from different groups), and this could offer a guide for the subsequent study. After the macrophage expression microarray dataset GSE7074 was standardized, the data were divided into the atherosclerotic macrophage group or normal tissue macrophage group, including 8 atherosclerotic samples and 22 normal samples from liver, lung, and spleen. After the objective dataset had been screened for gene differential expression analysis (adjusted P value <0.05, |log2-fold change (FC)| >0.58), 236 DEGs were obtained, including 215 downregulated genes and 21 upregulated genes (results of gene differential expression analysis are shown in Table 1). The multiple differential expression genes screened out from the dataset are shown in Figure 2. Next, hierarchical cluster analysis was performed to correctly distinguish DEGs between atherosclerotic and nonatherosclerotic macrophage samples based on significantly different expression patterns (Figure 3), indicating that the results were reliable and suitable for subsequent analyses.
Figure 1.
3D principal component scatterplot, in which points of different colors represent different sample type attributions. LI – liver Kupffer cell samples; LU – alveolar macrophage samples; SP – splenic macrophage samples; CA – atherosclerotic plaque-residing macrophage samples.
Table 1.
Screening DEGs acquired from analyzed data.
| Gene names (upregulated DEGs) |
|---|
| ASAP2, ARL4C, SNRK, ITGA10, DISP1, SFRP2, NAB1, LOC339803, FCGBP, LRP12, LRRC29, AGPAT4-IT1, COL16A1, GHRL, AMMECR1L, BVES-AS1, ASAP3, STPG1, B4GALT5, TRPM2, FAM64A |
| Gene names (downregulated DEGs) |
| C14orf2, ZNRD1, SPRYD7, BTD, LHX3, NSUN5, FAM118B, ZNF460, RAD51, AGTRAP, FAM20C, PSMB10, GPX3, PKIG, CYFIP2, TNFRSF25, LRRC4C, AMOTL2, EFNA5, PTHLH, ELAC1, BRD2, U2SURP, NOX4, SOX14, RP1, ALDH1A1, HS3ST3A1, HMGN4, AR, OLFML2B, HOXB5, KCNK1, PID1, EYA3, C14orf169, OGDH, ENAM, OXA1L, ZNF608, IGSF9B, KRT8P12, TBCE, DENR, SENP3, PDE6A, POLR3B, IL2RB, PIK3CB, IL17RA, PROS1, SLC1A7, SEC23IP, ATP9A, ZNF609, STARD3, RPS6KA3, TUBA8, LOC158402, HCRP1, TMEM38A, NDUFB10, JPH2, VIPR1, FAM189A2, SRR, DLK1, SHROOM2, MPO, FGF11, NPTXR, CD302, STMN1, DRD5, CYP4F8, KCNQ1OT1, CD79A, ZNF277, GBA, PRTFDC1, MAD2L2, VPS11, MYO15A, PDCD10, MYL9, IQCC, TNFAIP6, C1orf159, HAX1, FSCN1, FBXO21, SNORA71B, FBXO24, GPD1L, FPR3, UBL7-AS1, ARNTL2, NDRG4, P2RX4, DRD3, RNASE7, PEX11B, HDLBP, PROP1, HOXC6, FAM204A, MIS18A, KCNJ2, NRSN2, GCNT3, SNAPC2, SLC52A1, SPARCL1, POLR2F, PAX4, PRDM1, CRTAC1, RHO, XXYLT1, KIAA1324, MOGAT3, POLD4, DGAT1, RNLS, CRYBB1, ATP13A1, ZNF496, EIF2B4, NOCT, CHGB, DNAJC2, SLC25A40, LOC340085, ZNF154, FAM131A, HIST1H3E, NOC3L, CCNJ, ARL6IP5, NKX2-8, XCL1, XKR8, ERBB3, VPREB3, ICOS, IL3, GOSR2, OR5L2, KIFC1, BCO1, DUSP22, F5, CLCNKB, CDC42EP2, ACSS2, ZNF148, NLRP1, PDE6G, SCD5, XCR1, SLC39A10, CNTLN, HCRTR2, LINC00115, TULP2, CCM2, SGO1, VIPR2, FUT8, WNT2B, PDPK1, AP1S1, ZNF593, TSTA3, IFT20, MGAT3, AIPL1, POLD2, OR1A1, NAA20, ABCA4, TRAF4, ATP6V1G1, LRRC8A, SPSB4, HIST1H2BL, EFHD1, HIC1, MAP3K12, ROM1, PSMD6-AS2, LOC100507547, YOD1, NDUFA3, MEF2C-AS1, LHX2, SH2B1, AES, KCNE5, CNGA3, CAPZB, SEMA3F, C2, ARNTL, DNMT3L, OPLAH, ARHGEF17, MNS1, ANXA9, TFPI, DYNC2LI1, ICE2, GCLC, PRO1596, BEST1 |
Figure 2.
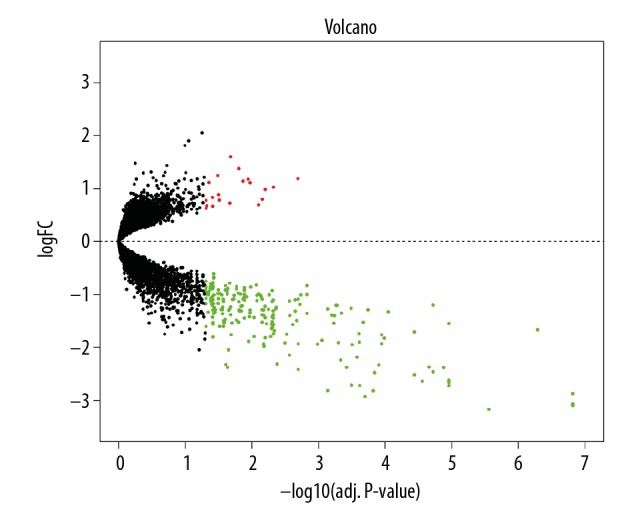
Differential expression of data between atherosclerotic and nonatherosclerotic macrophage samples. Black plots represent down- and upregulated genes, and red or green dots were significant differentially expressed genes. LogFC – log2-fold change.
Figure 3.
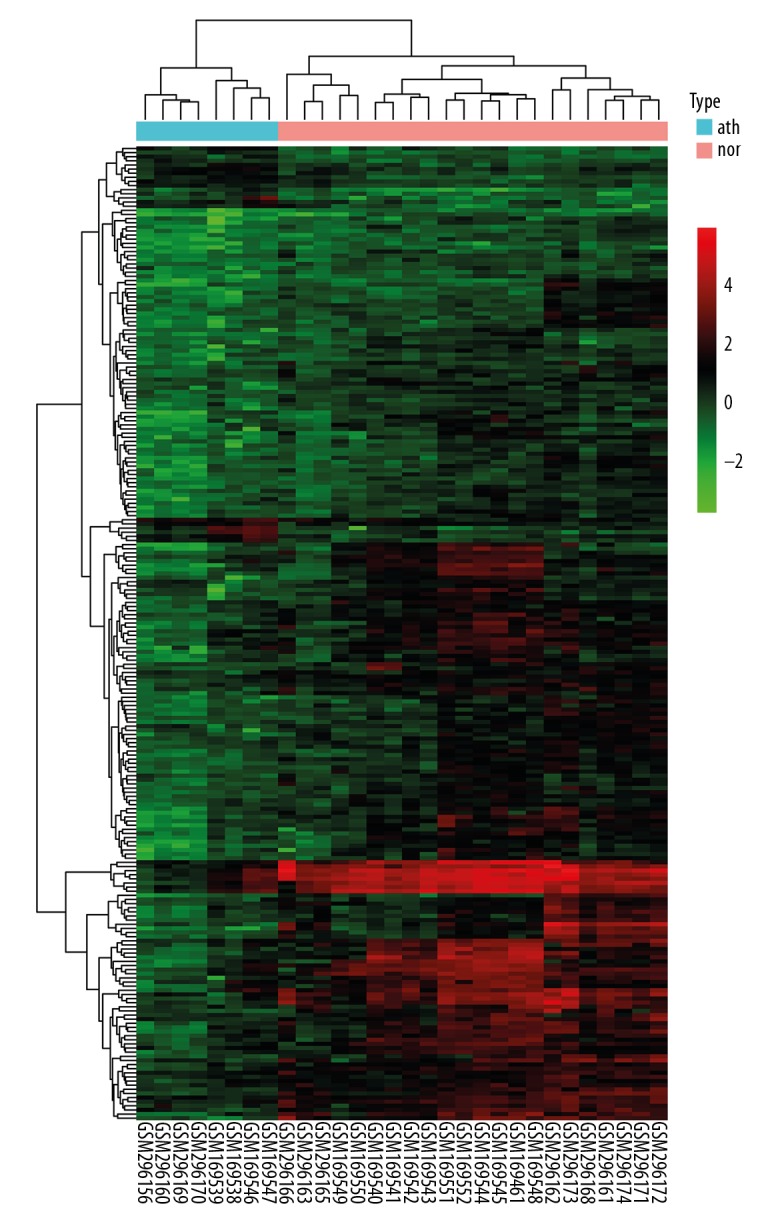
Hierarchical clustering heatmap of DEGs. The bottom horizontal axis shows the names of samples and the vertical axis shows the clusters of DEGs. Colors towards red represent gene expression value relatively upregulated and colors towards green represent gene expression value relatively downregulated. nor – normal samples; ath – atherosclerotic samples.
Enrichment analyses of DEGs
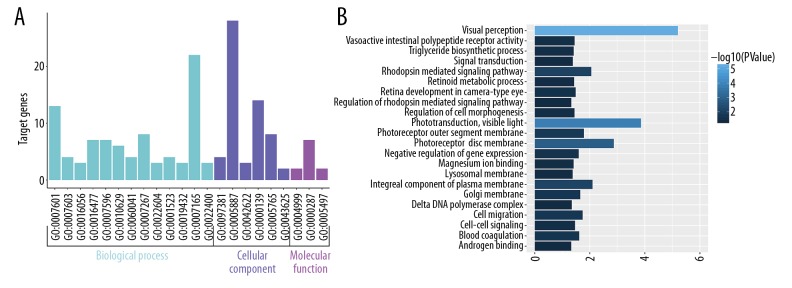
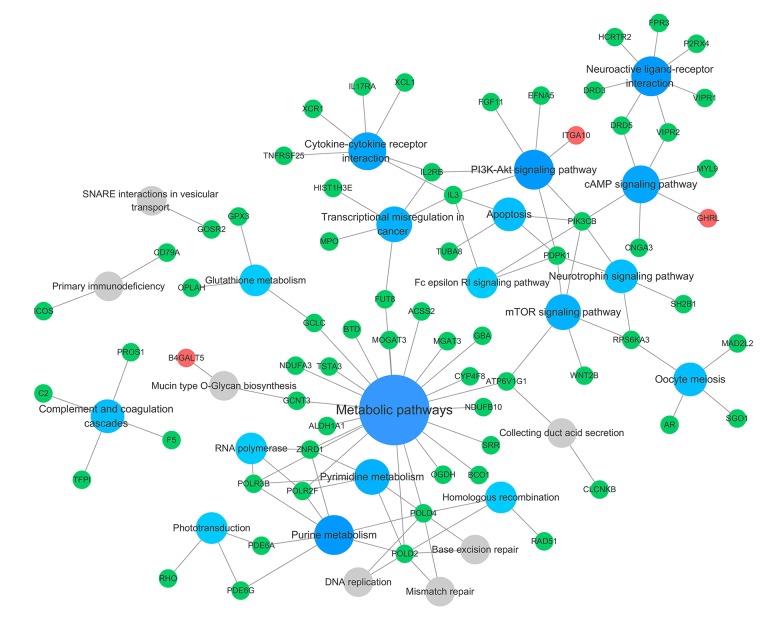
Biological annotation and KEGG pathway enrichment of the DEGs were performed using the DAVID online analysis tool and KOBAS online database (functional classification, annotation analyses, and the potentially related biochemistry pathways of candidate genes), respectively. With a threshold of P<0.05, 22 GO terms and 25 KEGG pathways were enriched from 54 terms and 182 pathways. The results are presented in Figures 4–6, and mainly involved ‘visual perception’ (GO Biological Process [BP] term, P=6.21E-06), ‘phototransduction’ (GO BP term, P=1.39E-04), ‘photoreceptor disc membrane’ (GO Cellular Component [CC] term, P=0.001328569), ‘integral component of plasma membrane’ (GO CC term, P=0.007973519), and the KEGG pathways of ‘Purine metabolism’ (P=0.001546974), ‘Phototransduction’ (P=0.002534266), and ‘Metabolic pathways’ (P=0.002834313) categories. The top 10 significant results of the GO term and KEGG pathway enrichment analysis of DEGs in atherosclerotic macrophages are shown in Tables 2 and 3.
Figure 4.
GO enrichment analysis of identified DEGs. (A) The histograms colored in cyan, slate blue, and orchid represent terms of biological process, cellular component, and molecular function, respectively. (B) Significant GO terms of DEGs according to P value.
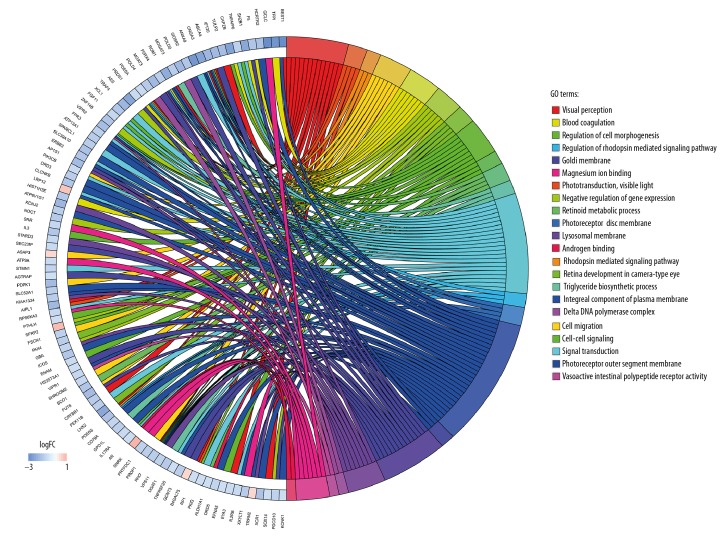
Figure 5.
Distribution of DEGs identified from data set for diverse GO-enriched functions. LogFC – log2-fold change.
Figure 6.
Significant KEGG pathway enrichment of identified DEGs. The big blue circles represent signaling pathways that contain more input genes, and the small grey circles represent signaling pathways that contain fewer input genes. The green and red circles represent the downregulated and upregulated genes, respectively, identified in the study.
Table 2.
The top ten results of GO enrichment analysis of differentially expressed genes.
| GO ID | Term | Count | P-value |
|---|---|---|---|
| GO: 0007601 | Visual perception | 13 | 6.21E-06 |
| GO: 0007603 | Phototransduction, visible light | 4 | 1.39E-04 |
| GO: 0097381 | Photoreceptor disc membrane | 4 | 0.001328569 |
| GO: 0005887 | Integral component of plasma membrane | 28 | 0.007973519 |
| GO: 0016056 | Rhodopsin mediated signaling pathway | 3 | 0.008862666 |
| GO: 0042622 | Photoreceptor outer segment membrane | 3 | 0.016475551 |
| GO: 0016477 | Cell migration | 7 | 0.018312903 |
| GO: 0000139 | Golgi membrane | 14 | 0.022394358 |
| GO: 0007596 | Blood coagulation | 7 | 0.02453119 |
| GO: 0010629 | Negative regulation of gene expression | 6 | 0.025500076 |
Table 3.
The top ten results of KEGG pathway enrichment analysis of differentially expressed genes.
| Term | ID | Input.count | P-value |
|---|---|---|---|
| Purine metabolism | hsa00230 | 7 | 0.001546974 |
| Phototransduction | hsa04744 | 3 | 0.002534266 |
| Metabolic pathways | hsa01100 | 22 | 0.002834313 |
| Homologous recombination | hsa03440 | 3 | 0.003054876 |
| Pyrimidine metabolism | hsa00240 | 5 | 0.00367646 |
| RNA polymerase | hsa03020 | 3 | 0.003951027 |
| Complement and coagulation cascades | hsa04610 | 4 | 0.007059075 |
| cAMP signaling pathway | hsa04024 | 6 | 0.012042269 |
| Glutathione metabolism | hsa00480 | 3 | 0.013195502 |
| mTOR signaling pathway | hsa04150 | 5 | 0.015864191 |
Analyzing all DEGs using a PPI network and modules identification
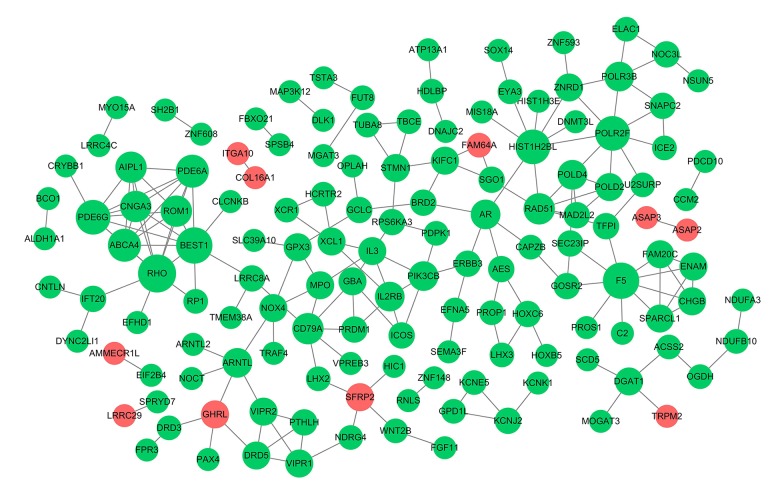
Considering the comprehensive nature of network construction and the whole process, all DEGs from the groups were sent to the STRING website to obtain the PPI information (associations between the candidate genes/proteins). After processing, a subset of 222 nodes with 186 interactions was drawn out from STRING. A complex network of chosen DEGs was constructed after removing the isolated nodes, as shown in Figure 7. The top 10 leading degree hub nodes in the network were: RHO, F5, BEST1, POLR2F, PDE6G, HIST1H2BL, PDE6A, ABCA4, CNGA3, and AIPL1. Among them, there were 6 nodes with degrees ≥8, only RHO, F5, and BEST1, the 3 most significant downregulated genes ranked degree scores ≥9, which were considered to be critical in this network (Table 4). Further, from the PPI network, only 2 subnet modules were selected with score ≥5 (module A=7.429 and module B=5). As shown in Figure 8, module A consisted of 8 downregulated nodes with 26 edges, which were significantly enriched in ‘Phototransduction’ (hsa04744), ‘Purine metabolism’ (hsa00230), and ‘ABC transporters’ (hsa02010). Module B was made up of 5 downregulated nodes with 10 edges, and the genes were significantly enriched in ‘Complement and coagulation cascades’ (hsa04610). RHO and BEST1 were in module A, and F5 was counted in module B.
Figure 7.
Protein–protein interaction (PPI) network. The nodes indicate the genes and the lines represent the corresponding interactions. The red circles represent the upregulated genes and the green represent the downregulated genes, and the bigger circles represent the genes with high degree scores.
Table 4.
Top 6 genes with the degree ≥8 in the protein-protein interaction (PPI) network.
| Gene | LogFC | Adj.P | Degree |
|---|---|---|---|
| RHO | −1.325868022 | 0.035374995 | 10 |
| F5 | −1.545198153 | 1.11E-05 | 9 |
| BEST1 | −3.456209744 | 2.66E-08 | 9 |
| HIST1H2BL | −1.977145687 | 0.006584092 | 8 |
| PDE6G | −1.59907313 | 0.026771841 | 8 |
| POLR2F | −1.305954127 | 0.014398162 | 8 |
LogFC – log2-fold change; Adj.P – adjusted P-value.
Figure 8.
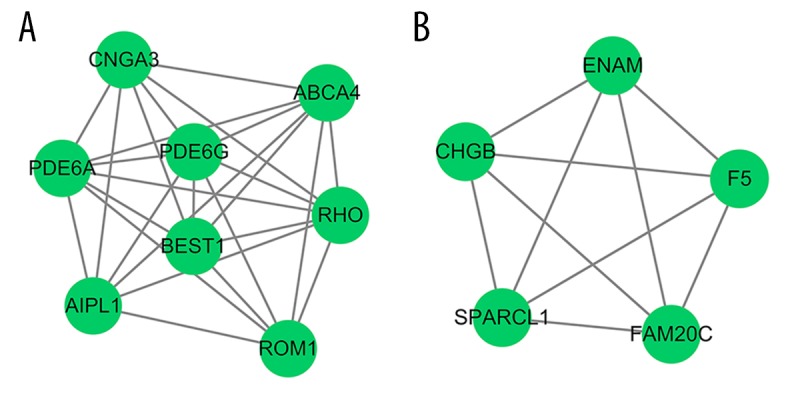
Subnet modules identified in the PPI network. (A) Module A, (B) module B. The green circles represent the downregulated genes.
miRNA/TF prediction and analysis
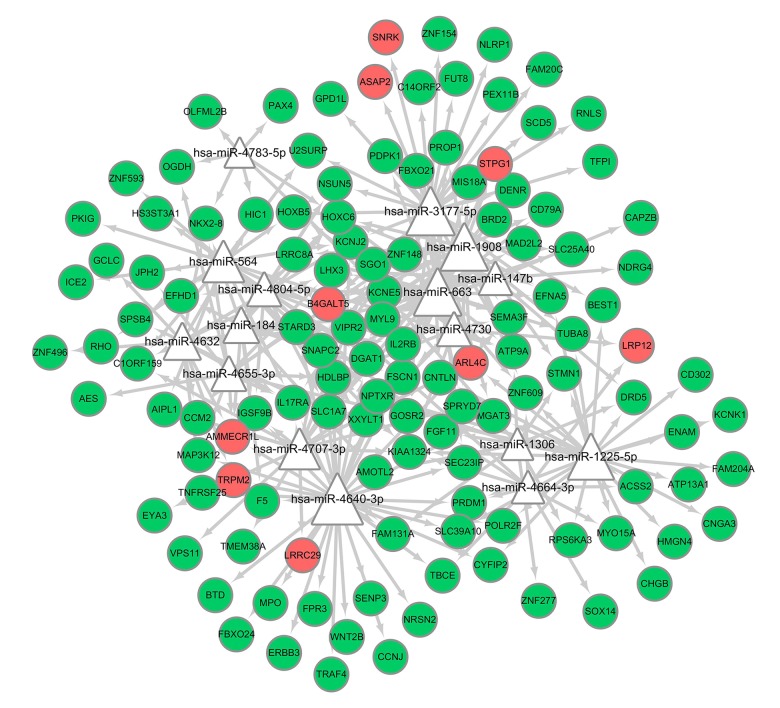
In the miRNA-target regulatory network, 16 miRNAs were predicted in the DEGs with the threshold of P<0.05, and 4 miRNAs were highlighted with degrees ≥30, including hsa-miR-4640-3p, hsa-miR-3177-5p, hsa-miR-1908, hsa-miR-663. Among them, hsa-miR-4640-3p and hsa-miR-3177-5p had the highest scores (19.23667544 and 11.46519428, respectively), which could target PPI network-crucial genes F5 and BEST1, respectively. TFs were also predicted from the DEGs; 5 TFs were predicted, including EGR1, CLOCK, GATA3, WRNIP1, and PBX3, among which early growth response-1 (EGR1) was predicted to target 3 downregulated DEGs, and others were predicted to target 2. Based on the obtained miRNA-target pairs, and TF-targets, we constructed integrated networks using Cytoscape software, as shown in Figures 9, 10.
Figure 9.
Regulatory network of miRNAs and target genes in the present study. The bigger triangles represent miRNAs possess more targets. The green and red circles represent the downregulated and upregulated genes, respectively, identified in the study.
Figure 10.
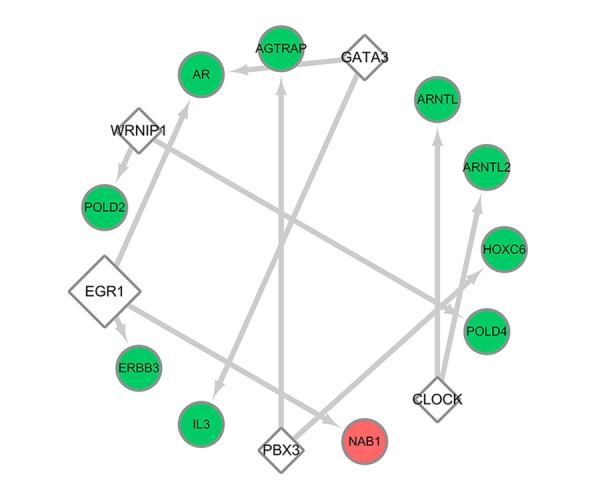
Regulatory network of transcription factors and target genes in the present study. The bigger rhombuses represent transcription factors that possess more targets. The green and red circles represent the downregulated and upregulated genes, respectively, identified in the study.
Discussion
Recent studies have revealed the functional and ontogenetic diversity of tissue-resident macrophages, and data acquired by high-throughput sequencing has confirmed the transcriptional and epigenetic programs of these macrophages [23,24]. In contrast to most of the general histocytes which have the same transcriptional program regardless of where they reside, these tissue-resident macrophages possess evolutionary diversity and distinct functions in maintaining homeostasis, and they also exhibit extensive plasticity during disease progression. Here, the gene data profiles present 3 different regions of normal tissue-resident macrophages: Kupffer cells, alveolar macrophages, and splenic macrophages. Compared to Kupffer cells, splenic macrophage and alveolar macrophage populations are essential parts of the tissue immune compartment and tend to be involved in anti-inflammatory settings and the maintenance of a steady state. Many pathological studies have revealed a series of changes in blood vessels during atherogenesis and indicated that blood-derived inflammatory cells like monocytes/macrophages have a key role. Tissue culture studies with endothelial cells, vascular smooth muscle cells, and monocytes/macrophages suggested possible pathways of disease initiation and progression in atherosclerosis. Thus, this chronic inflammatory disease involving monocytes/macrophages aggregation in the vessel wall is inevitably related to tissue-resident microenvironmental changes, cellular stress, and monocyte phenotypic diversity. This may explain the obvious difference between the 3 kinds of nonatherosclerotic macrophages and atherosclerotic macrophages in PCA analysis. In the present study, we focused on exploring the link between normal tissue-resident macrophages phenotypic changes as well as functional diversity and atherosclerotic macrophages due to specific tissue microenvironmental changes or external stimuli, from macrophages resident in the human alveolus, spleen, and liver compared with carotid plaque. R software was used to analyze the dataset; 236 DEGs were identified, and most of them are downregulated genes. Specially, RHO, F5, and BEST1 were considered as important genes. With high degrees in the PPI network, F5 could be targeted by hsa-miR-4640-3p and BEST1 could be targeted by hsa-miR-3177-5p, and the transcription factor EGR 1 was predicted to target most DEGs. Meanwhile, both RHO and F5 were enriched in Golgi membrane cellular component, and both RHO and BEST1 were enriched in visual perception biological process and integral component of plasma membrane cellular component. We believe that these genes may be closely related to atherosclerotic plaque formation and development.
As integral membrane proteins, bestrophins (Best) were first found by genetic linkage of human BEST1 to a juvenile form of macular degeneration called ‘best disease’ (best vitelliform macular dystrophy) [25]. Belonging to a protein family, consisting of 4 members (bestrophin 1–4), BEST1 has been functionally proposed to be a regulator of Ca2+-activated Cl− channel in heterologous studies [26–28]. Recent research showed the role of BEST3 in TNFα-induced human endothelial inflammatory response and the underlying molecular mechanisms, showing that overexpression of BEST3 significantly attenuated TNFα-induced expression of adhesion molecules and chemokines, and subsequently inhibited the adhesion of monocytes to human umbilical vein endothelial cells, suggesting that BEST3, a member of the bestrophins family, may be a novel approach for the treatment of vascular inflammatory diseases [29]. Experiments using downregulated bestrophins in vivo support the hypothesis that bestrophins play key roles in the cGMP-dependent Ca2+-activated Cl− current for initiation of vasomotion, and the specific downregulation of bestrophin-3 induces a secondary reduction of bestrophin-1 and -2 expressions [30]. This means that BEST1, along with other members of the bestrophin family, may exert synergistic effects in the maintenance of normal vasomotion and vascular homeostasis. Disrupting the balance leads to vascular lesions, and abnormal vasomotion is believed to be a precursor to atherosclerotic disease [31,32], which may be the initiation of atherosclerosis. Thus, BEST1 is likely to be involved in the progression of atherosclerotic inflammation, just like the role of BEST3 in the endothelial inflammatory response. We also predicted that BEST1 could be targeted by hsa-miR-3177-5p, which has been shown to have important regulatory effects on the expression of the 5-HT1A receptor in HEK-293 cells [33]. The 5-HT1A receptor is a subtype of serotonin receptor system (5-HT receptor), and serotonin modulates vascular tonus and mediates development and rupture of atherosclerotic plaques [34,35]. Whole-blood levels of hsa-miR-3177-3p were also identified to serve as a biomarker for vasospasm [36]. miR-3177 was proved to take part in the process of vascular tonus or vasospasm modulating. Considering the specific regulatory function of BEST1 in vasculature as described above, it is no coincidence that both of miR-3177 and BEST1 can participate in the regulation of vasomotion, and the regulatory relationship between them seems to be clear. Thus, it was speculated that hsa-miR-3177-5p may take part in the regulation of vasomotion by targeting BEST1, and the expression disorder of miR-3177-5p/BEST1 can cause abnormal vasomotion and may be subsequently involved in the occurrence of atherosclerosis. Upregulation of miR-3177-5p and low expression of BEST1 in atherosclerotic macrophages are likely to represent the molecular phenotype of this vascular disease.
F5 (Factor V) is part of the common pathway and plays a critical role in blood coagulation. It is a large, heavily glycosylated, single-chain protein that is homologous to factor VIII and shares a similar domain organization [37,38]. Interestingly, defects in F5 may result in either hemorrhagic (FV deficiency) or thrombotic phenotypes. The most prevalent form of factor V deficiency is caused by an inherited genetic defect in the F5 gene sequence (congenital factor V deficiency or parahemophilia), and these mutations typically reduce protein expression or cause a loss of protein function [39]. In particular, the missense mutation in the factor V position 506 by glutamine is found in patients presenting with venous thrombosis [40], called Factor V Leiden (FVL). Early in 2007, a clinical trial proved that Factor V Leiden mutation can influence the progression of atherosclerosis [41], and a recent study has confirmed that homozygosity for the FVL mutation in mice leads to enhanced arterial thrombosis and atherosclerosis [42]. The mutation of F5 ultimately alters the normal gene expression, and it participates in the regulation of both anticoagulation function and coagulation function. Our results showed that F5 gene expression level is downregulated in atherosclerotic macrophages. Recent evidence indicates that the mutation of this gene is likely associated with atherogenesis, and the mutations lead to gene expression deficiency or severe biological function impairment of the protein product. It was also reported that when monocytes extravasate by crossing the vascular endothelium, they differentiate into macrophages and gradually lose F5 expression [43]. However, there has been little research on the function of F5 in atherosclerosis, and it is unclear whether the simple change of F5 expression has a direct effect on promoting internal progression, thrombosis, or rupture of atherosclerotic plaque. In addition, miRNA-4640, which was identified in 2011 by next-generation sequencing of small RNAs in breast cancer [44], was predicted to target F5. As a relatively new miRNA under study, miR-4640 has yet to be investigated in the context of physiology and disease.
Simultaneously enriched in GO term ‘integral component of plasma membrane cellular component’ with BEST1 in the present analysis, another integral membrane protein, rhodopsin, was first found in the rods of the retina and belongs to the G-protein-coupled receptors (GPCRs). Rhodopsins are members of class A subfamily that are the largest group of GPCRs. Studies have revealed that some rhodopsin-like G protein-coupled receptors play different roles in the pathogenesis of atherosclerosis. For instance, apelin (APJ) is a class A, Rhodopsin-like G protein-coupled receptor and is widely expressed in the cardiovascular system and central nervous system. A number of studies have shown that there is a close relationship between APJ system and atherosclerosis: in the Ang II-induced atherosclerotic apolipoprotein E-deficient mouse model, Chun et al. [45] found that apelin signaling blocked atherogenesis by activating NO synthase (eNOS) phosphorylation pathways, and the APJ system was also found to be involved in the development of atherosclerosis by affecting vascular smooth muscle cells [46]. Low levels of plasma apelin were correlated with the severity of carotid plaque vulnerability, whereas it was positively related to the stability of atherosclerotic plaque [47,48]. Another class A or rhodopsin-like G-protein-coupled receptor, neuropeptide Y (NPY) receptor, plays a crucial role in various biological processes. Abnormal regulation of NPY is involved in the development of a wide range of diseases, including hypertension, atherosclerosis, and metabolic disorders [49]. Our results also show that the expression level of rhodopsin is downregulated in atherosclerotic macrophages. This suggests that rhodopsins have potential inhibitory effects on atherosclerosis, but this conclusion is controversial, and more investigations are needed to disclose the mechanisms and pathways mediating the various processes in atherosclerosis carried out by the archetype of the largest class of GPCRs in the human genome.
In the present study, among the 5 predicted TFs, early growth response-1 (EGR1) had the most targeted-DEGs in the TF-target regulatory network. EGR1 is thought to play an important role in the pathogenesis of atherosclerosis, and critical work in the identification of the biological link between EGR1 and atherosclerosis came from experiments by the laboratories of McCaffrey et al. [50], who found that transcripts for EGR1 were upregulated in human atherosclerotic plaque and the lesions of the LDL (low-density lipoprotein) receptor-deficient mice fed with a high-fat diet. Moreover, immunohistochemistry localized EGR1 to macrophages, endothelial cells, and vascular smooth muscle cells (SMC). Within the atherosclerotic plaque, increased EGR1 expression in the lesion was positively correlated with elevated expression of several known EGR1 target genes, such as TNF, ICAM-1, and M-CSF, suggesting that EGR1 is transcriptionally active in human atheroma [50]. In the present study, EGR1 was predicted to target 3 DEGs: ERBB3 (erb-b2 receptor tyrosine kinase 3), AR (androgen receptor), and NAB1 (NGFI-A binding protein 1). It was shown that ERBB signaling plays a role in the control of proinflammatory activation of monocytes [51]. Experiments using the ARKO mouse model suggest an atheroprotective role for AR [52]. EGR-1 is the partner identified for NAB1, and it appears that NAB1 serves as a repressor for the EGR-1-responsive expression of proinflammatory associated genes in many cells [53,54]. Specific function of ERBB3 and NAB1 remain unclear, as the EGR-1 downstreams influence an inflammatory reaction in macrophages in atherosclerotic plaque. Nonetheless, from the current evidence, it is highly likely that these unascertained downstream interacting partners of EGR1 also participate in the process of atherogenesis; thus, whether and how these genes contribute to atherogenesis suppression involved in the EGR1 associate-regulatory network is a promising direction of research in the future. Taken together, these findings provide definitive mechanistic support for the link between transcription factor EGR1 and the pathogenesis of atherosclerosis, and suggest that the present analytic results have theoretical significance.
However, the present study has some limitations: the number of specimens in the existing database limited our efforts to include more samples in the study, and a finite number of macrophage examples were included in the analysis, which might affect the values of these results and findings. The dataset GSE7074 had been used in another study [55]. Compared to the previous research, our results demonstrated distinct DEGs. A possible reason for this difference may be that macrophage samples used in the previous study contained peripheral blood-derived macrophages from patients with atherosclerosis, which is obviously distinct from the in situ atherosclerotic tissue-derived macrophages used in the present study. Furthermore, the previous study used the online differential gene analysis platform GEO2R, but we utilized the rigorous code of R software for data processing, and the criteria and thresholds defined in differential gene screening are not all the same. The findings obtained from the microarray method still need experimental verifications, and the clinical significance of the DEGs and predicted miRNAs/TFs in disease need further elucidation.
Conclusions
We found 236 significantly mutual DEGs from transcriptomic comparisons of human atherosclerotic and nonatherosclerotic macrophages covering the majority of the human body’s internal environment. Specially, 3 highlighted downregulated genes (RHO, F5, and BEST1) in the PPI network were identified as potential suppressors or diagnostic biomarkers for atherosclerosis formation and development. Moreover, hsa-miR-3177-5p was predicted as the potential upstream regulator for BEST1 and might be involved in the progression of atherosclerosis, and the transcription factor EGR1 was the potential facilitator in atherogenesis and could serve as an underlying target for atherosclerosis treatment. These findings provide the theoretical basis for the future study in this disease and provide insight into the underlying molecular mechanisms within the initiation and progression of the disease. However, more work is needed to better define the specific role of these genes in tissue-specific metabolites and macrophage function in different tissues, along with how they are changed during inflammation and the general procedure of atherosclerosis formation.
Footnotes
Source of support: This work was supported by the National Natural Science Foundation of China (grant no. 81571144) and the Independent Research Project of Natural Science Foundation of Tianjin City (grant no. 16JCZDJC35700)
References
- 1.Libby P, Loscalzo J, Ridker PM, et al. Inflammation, Immunity, and Infection in Atherothrombosis: JACC Review Topic of the Week. J Am Coll Cardiol. 2018;72:2071–81. doi: 10.1016/j.jacc.2018.08.1043. [DOI] [PMC free article] [PubMed] [Google Scholar]
- 2.Skalen K, Gustafsson M, Rydberg EK, et al. Subendothelial retention of atherogenic lipoproteins in early atherosclerosis. Nature. 2002;417:750–54. doi: 10.1038/nature00804. [DOI] [PubMed] [Google Scholar]
- 3.Stary HC. Natural history and histological classification of atherosclerotic lesions: An update. Arterioscler Thromb Vasc Biol. 2000;20:1177–78. doi: 10.1161/01.atv.20.5.1177. [DOI] [PubMed] [Google Scholar]
- 4.Arbab-Zadeh A, Fuster V. The myth of the “vulnerable plaque” transitioning from a focus on individual lesions to atherosclerotic disease burden for coronary artery disease risk assessment. J Am Coll Cardiol. 2015;65:846–55. doi: 10.1016/j.jacc.2014.11.041. [DOI] [PMC free article] [PubMed] [Google Scholar]
- 5.Randolph GJ. Mechanisms that regulate macrophage burden in atherosclerosis. Circ Res. 2014;114:1757–71. doi: 10.1161/CIRCRESAHA.114.301174. [DOI] [PMC free article] [PubMed] [Google Scholar]
- 6.Ley K, Miller YI, Hedrick CC. Monocyte and macrophage dynamics during atherogenesis. Arterioscler Thromb Vasc Biol. 2011;31:1506–16. doi: 10.1161/ATVBAHA.110.221127. [DOI] [PMC free article] [PubMed] [Google Scholar]
- 7.Moore KJ, Tabas I. Macrophages in the pathogenesis of atherosclerosis. Cell. 2011;145:341–55. doi: 10.1016/j.cell.2011.04.005. [DOI] [PMC free article] [PubMed] [Google Scholar]
- 8.Leitinger N, Schulman IG. Phenotypic polarization of macrophages in atherosclerosis. Arterioscler Thromb Vasc Biol. 2013;33:1120–26. doi: 10.1161/ATVBAHA.112.300173. [DOI] [PMC free article] [PubMed] [Google Scholar]
- 9.Bouhlel MA, Derudas B, Rigamonti E, et al. PPARgamma activation primes human monocytes into alternative M2 macrophages with anti-inflammatory properties. Cell Metab. 2007;6:137–43. doi: 10.1016/j.cmet.2007.06.010. [DOI] [PubMed] [Google Scholar]
- 10.Li X, Kramer MC, van der Loos CM, et al. A pattern of disperse plaque microcalcifications identifies a subset of plaques with high inflammatory burden in patients with acute myocardial infarction. Atherosclerosis. 2011;218:83–89. doi: 10.1016/j.atherosclerosis.2011.04.032. [DOI] [PubMed] [Google Scholar]
- 11.Bories G, Colin S, Vanhoutte J, et al. Liver X receptor activation stimulates iron export in human alternative macrophages. Circ Res. 2013;113:1196–205. doi: 10.1161/CIRCRESAHA.113.301656. [DOI] [PMC free article] [PubMed] [Google Scholar]
- 12.Liao X, Sharma N, Kapadia F, et al. Kruppel-like factor 4 regulates macrophage polarization. J Clin Invest. 2011;121:2736–49. doi: 10.1172/JCI45444. [DOI] [PMC free article] [PubMed] [Google Scholar]
- 13.Pourcet B, Feig JE, Vengrenyuk Y, et al. LXRalpha regulates macrophage arginase 1 through PU.1 and interferon regulatory factor 8. Circ Res. 2011;109:492–501. doi: 10.1161/CIRCRESAHA.111.241810. [DOI] [PMC free article] [PubMed] [Google Scholar]
- 14.Martinez FO, Gordon S, Locati M, Mantovani A. Transcriptional profiling of the human monocyte-to-macrophage differentiation and polarization: New molecules and patterns of gene expression. J Immunol. 2006;177:7303–11. doi: 10.4049/jimmunol.177.10.7303. [DOI] [PubMed] [Google Scholar]
- 15.Baek YS, Haas S, Hackstein H, et al. Identification of novel transcriptional regulators involved in macrophage differentiation and activation in U937 cells. BMC Immunol. 2009;10:18. doi: 10.1186/1471-2172-10-18. [DOI] [PMC free article] [PubMed] [Google Scholar]
- 16.Petryszak R, Burdett T, Fiorelli B, et al. Expression Atlas update – a database of gene and transcript expression from microarray- and sequencing-based functional genomics experiments. Nucleic Acids Res. 2014;42:D926–32. doi: 10.1093/nar/gkt1270. [DOI] [PMC free article] [PubMed] [Google Scholar]
- 17.Eijgelaar WJ, Horrevoets AJ, Bijnens AP, et al. Equivalence testing in microarray analysis: similarities in the transcriptome of human atherosclerotic and nonatherosclerotic macrophages. Physiol Genomics. 2010;41:212–23. doi: 10.1152/physiolgenomics.00193.2009. [DOI] [PubMed] [Google Scholar]
- 18.Ma S, Dai Y. Principal component analysis based methods in bioinformatics studies. Brief Bioinform. 2011;12:714–22. doi: 10.1093/bib/bbq090. [DOI] [PMC free article] [PubMed] [Google Scholar]
- 19.Sherman BT, Huang da W, Tan Q, et al. DAVID Knowledgebase: a gene-centered database integrating heterogeneous gene annotation resources to facilitate high-throughput gene functional analysis. BMC Bioinformatics. 2007;8:426. doi: 10.1186/1471-2105-8-426. [DOI] [PMC free article] [PubMed] [Google Scholar]
- 20.von Mering C, Huynen M, Jaeggi D, et al. STRING: A database of predicted functional associations between proteins. Nucleic Acids Res. 2003;31:258–61. doi: 10.1093/nar/gkg034. [DOI] [PMC free article] [PubMed] [Google Scholar]
- 21.Bandettini WP, Kellman P, Mancini C, et al. MultiContrast Delayed Enhancement (MCODE) improves detection of subendocardial myocardial infarction by late gadolinium enhancement cardiovascular magnetic resonance: A clinical validation study. J Cardiovasc Magn Reson. 2012;14:83. doi: 10.1186/1532-429X-14-83. [DOI] [PMC free article] [PubMed] [Google Scholar]
- 22.Chen EY, Tan CM, Kou Y, et al. Enrichr: Interactive and collaborative HTML5 gene list enrichment analysis tool. BMC Bioinformatics. 2013;14:128. doi: 10.1186/1471-2105-14-128. [DOI] [PMC free article] [PubMed] [Google Scholar]
- 23.Lavin Y, Winter D, Blecher-Gonen R, et al. Tissue-resident macrophage enhancer landscapes are shaped by the local microenvironment. Cell. 2014;159:1312–26. doi: 10.1016/j.cell.2014.11.018. [DOI] [PMC free article] [PubMed] [Google Scholar]
- 24.Gautier EL, Shay T, Miller J, et al. Gene-expression profiles and transcriptional regulatory pathways that underlie the identity and diversity of mouse tissue macrophages. Nat Immunol. 2012;13:1118–28. doi: 10.1038/ni.2419. [DOI] [PMC free article] [PubMed] [Google Scholar]
- 25.Hartzell HC, Qu Z, Yu K, et al. Molecular physiology of bestrophins: multifunctional membrane proteins linked to best disease and other retinopathies. Physiol Rev. 2008;88:639–72. doi: 10.1152/physrev.00022.2007. [DOI] [PubMed] [Google Scholar]
- 26.Tsunenari T, Sun H, Williams J, et al. Structure-function analysis of the bestrophin family of anion channels. J Biol Chem. 2003;278:41114–25. doi: 10.1074/jbc.M306150200. [DOI] [PMC free article] [PubMed] [Google Scholar]
- 27.Yang T, Liu Q, Kloss B, et al. Structure and selectivity in bestrophin ion channels. Science. 2014;346:355–59. doi: 10.1126/science.1259723. [DOI] [PMC free article] [PubMed] [Google Scholar]
- 28.Barro Soria R, Spitzner M, Schreiber R, Kunzelmann K. Bestrophin-1 enables Ca2+-activated Cl- conductance in epithelia. J Biol Chem. 2009;284:29405–12. doi: 10.1074/jbc.M605716200. [DOI] [PMC free article] [PubMed] [Google Scholar]
- 29.Song W, Yang Z, He B. Bestrophin 3 ameliorates TNFalpha-induced inflammation by inhibiting NF-kappaB activation in endothelial cells. PLoS One. 2014;9:e111093. doi: 10.1371/journal.pone.0111093. [DOI] [PMC free article] [PubMed] [Google Scholar]
- 30.Broegger T, Jacobsen JC, Secher Dam V, et al. Bestrophin is important for the rhythmic but not the tonic contraction in rat mesenteric small arteries. Cardiovasc Res. 2011;91:685–93. doi: 10.1093/cvr/cvr111. [DOI] [PubMed] [Google Scholar]
- 31.von Mering GO, Arant CB, Wessel TR, et al. Abnormal coronary vasomotion as a prognostic indicator of cardiovascular events in women: Results from the National Heart, Lung, and Blood Institute-Sponsored Women’s Ischemia Syndrome Evaluation (WISE) Circulation. 2004;109:722–25. doi: 10.1161/01.CIR.0000115525.92645.16. [DOI] [PubMed] [Google Scholar]
- 32.Prasad A, Husain S, Quyyumi AA. Abnormal flow-mediated epicardial vasomotion in human coronary arteries is improved by angiotensin-converting enzyme inhibition: A potential role of bradykinin. J Am Coll Cardiol. 1999;33:796–804. doi: 10.1016/s0735-1097(98)00611-1. [DOI] [PubMed] [Google Scholar]
- 33.Wu X, Ding M, Liu Y, et al. hsa-miR-3177-5p and hsa-miR-3178 Inhibit 5-HT1A expression by binding the 3′-UTR region in vitro. Front Mol Neurosci. 2019;12:13. doi: 10.3389/fnmol.2019.00013. [DOI] [PMC free article] [PubMed] [Google Scholar]
- 34.Hara K, Hirowatari Y, Yoshika M, et al. The ratio of plasma to whole-blood serotonin may be a novel marker of atherosclerotic cardiovascular disease. J Lab Clin Med. 2004;144:31–37. doi: 10.1016/j.lab.2004.03.014. [DOI] [PubMed] [Google Scholar]
- 35.Vanhoutte PM. Endothelial dysfunction and vascular disease. Verh K Acad Geneeskd Belg. 1998;60:251–66. [PubMed] [Google Scholar]
- 36.Pulcrano-Nicolas AS, Proust C, Clarencon F, et al. Whole-blood miRNA sequencing profiling for vasospasm in patients with aneurysmal subarachnoid hemorrhage. Stroke. 2018;49:2220–23. doi: 10.1161/STROKEAHA.118.021101. [DOI] [PubMed] [Google Scholar]
- 37.Mann KG, Kalafatis M. Factor V: A combination of Dr Jekyll and Mr Hyde. Blood. 2003;101:20–30. doi: 10.1182/blood-2002-01-0290. [DOI] [PubMed] [Google Scholar]
- 38.Camire RM, Bos MH. The molecular basis of factor V and VIII procofactor activation. J Thromb Haemost. 2009;7:1951–61. doi: 10.1111/j.1538-7836.2009.03622.x. [DOI] [PMC free article] [PubMed] [Google Scholar]
- 39.Duckers C, Simioni P, Rosing J, Castoldi E. Advances in understanding the bleeding diathesis in factor V deficiency. Br J Haematol. 2009;146:17–26. doi: 10.1111/j.1365-2141.2009.07708.x. [DOI] [PubMed] [Google Scholar]
- 40.Rees DC, Cox M, Clegg JB. World distribution of factor V Leiden. Lancet. 1995;346:1133–34. doi: 10.1016/s0140-6736(95)91803-5. [DOI] [PubMed] [Google Scholar]
- 41.Vallus G, Dlustus B, Acsady G, et al. Factor V Leiden and apolipoprotein E genotypes in severe femoropopliteal atherosclerosis with restenosis. Clin Chim Acta. 2007;377:256–60. doi: 10.1016/j.cca.2006.10.004. [DOI] [PubMed] [Google Scholar]
- 42.Eitzman DT, Westrick RJ, Shen Y, et al. Homozygosity for factor V Leiden leads to enhanced thrombosis and atherosclerosis in mice. Circulation. 2005;111:1822–25. doi: 10.1161/01.CIR.0000160854.75779.E8. [DOI] [PubMed] [Google Scholar]
- 43.Dashty M, Akbarkhanzadeh V, Zeebregts CJ, et al. Characterization of coagulation factor synthesis in nine human primary cell types. Sci Rep. 2012;2:787. doi: 10.1038/srep00787. [DOI] [PMC free article] [PubMed] [Google Scholar]
- 44.Persson H, Kvist A, Rego N, et al. Identification of new microRNAs in paired normal and tumor breast tissue suggests a dual role for the ERBB2/Her2 gene. Cancer Res. 2011;71:78–86. doi: 10.1158/0008-5472.CAN-10-1869. [DOI] [PubMed] [Google Scholar]
- 45.Chun HJ, Ali ZA, Kojima Y, et al. Apelin signaling antagonizes Ang II effects in mouse models of atherosclerosis. J Clin Invest. 2008;118:3343–54. doi: 10.1172/JCI34871. [DOI] [PMC free article] [PubMed] [Google Scholar]
- 46.Luo X, Liu J, Zhou H, Chen L. Apelin/APJ system: A critical regulator of vascular smooth muscle cell. J Cell Physiol. 2018;233:5180–88. doi: 10.1002/jcp.26339. [DOI] [PubMed] [Google Scholar]
- 47.Kadoglou NP, Sailer N, Moumtzouoglou A, et al. Adipokines: A novel link between adiposity and carotid plaque vulnerability. Eur J Clin Invest. 2012;42:1278–86. doi: 10.1111/j.1365-2362.2012.02728.x. [DOI] [PubMed] [Google Scholar]
- 48.Zhou Y, Wang Y, Qiao S. Apelin: A potential marker of coronary artery stenosis and atherosclerotic plaque stability in ACS patients. Int Heart J. 2014;55:204–12. doi: 10.1536/ihj.13-234. [DOI] [PubMed] [Google Scholar]
- 49.Yi M, Li H, Wu Z, et al. A promising therapeutic target for metabolic diseases: Neuropeptide Y receptors in humans. Cell Physiol Biochem. 2018;45:88–107. doi: 10.1159/000486225. [DOI] [PubMed] [Google Scholar]
- 50.McCaffrey TA, Fu C, Du B, et al. High-level expression of Egr-1 and Egr-1-inducible genes in mouse and human atherosclerosis. J Clin Invest. 2000;105:653–62. doi: 10.1172/JCI8592. [DOI] [PMC free article] [PubMed] [Google Scholar]
- 51.Ryzhov S, Matafonov A, Galindo CL, et al. ERBB signaling attenuates proinflammatory activation of nonclassical monocytes. Am J Physiol Heart Circ Physiol. 2017;312:H907–18. doi: 10.1152/ajpheart.00486.2016. [DOI] [PMC free article] [PubMed] [Google Scholar]
- 52.Ikeda Y, Aihara K, Yoshida S, et al. Androgen-androgen receptor system protects against angiotensin II-induced vascular remodeling. Endocrinology. 2009;150:2857–64. doi: 10.1210/en.2008-1254. [DOI] [PubMed] [Google Scholar]
- 53.Qiu FH, Devchand PR, Wada K, Serhan CN. Aspirin-triggered lipoxin A4 and lipoxin A4 up-regulate transcriptional corepressor NAB1 in human neutrophils. FASEB J. 2001;15:2736–38. doi: 10.1096/fj.01-0576fje. [DOI] [PubMed] [Google Scholar]
- 54.Yan SF, Pinsky DJ, Mackman N, Stern DM. Egr-1: Is it always immediate and early? J Clin Invest. 2000;105:553–54. doi: 10.1172/JCI9513. [DOI] [PMC free article] [PubMed] [Google Scholar]
- 55.Huang HM, Jiang X, Hao ML, et al. Identification of biomarkers in macrophages of atherosclerosis by microarray analysis. Lipids Health Dis. 2019;18:107. doi: 10.1186/s12944-019-1056-x. [DOI] [PMC free article] [PubMed] [Google Scholar]


