

Abstract
The chromatin‐organizing factor CCCTC‐binding factor (CTCF) is involved in transcriptional regulation, DNA‐loop formation, and telomere maintenance. To evaluate the clinical impact of CTCF in prostate cancer, we analyzed CTCF expression by immunohistochemistry on a tissue microarray containing 17 747 prostate cancers. Normal prostate tissue showed negative to low CTCF expression, while in prostate cancers, CTCF expression was seen in 7726 of our 12 555 (61.5%) tumors and was considered low in 44.6% and high in 17% of cancers. Particularly, high CTCF expression was significantly associated with the presence of the transmembrane protease, serine 2:ETS‐related gene fusion: Only 10% of ERG‐negative cancers, but 30% of ERG‐positive cancers had high‐level CTCF expression (P < 0.0001). CTCF expression was significantly associated with advanced pathological tumor stage, high Gleason grade (P < 0.0001 each), nodal metastasis (P = 0.0122), and early biochemical recurrence (P < 0.0001). Multivariable modeling revealed that the prognostic impact of CTCF was independent from established presurgical parameters such as clinical stage and Gleason grade of the biopsy. Comparison with key molecular alterations showed strong associations with the expression of the Ki‐67 proliferation marker and presence of phosphatase and tensin homolog deletions (P < 0.0001 each). The results of our study identify CTCF expression as a candidate biomarker for prognosis assessment in prostate cancer.
Keywords: CTCF, deletion, prostate cancer, TMA
The transcriptional repressor CCCTC‐binding factor, which is involved in modeling the chromatin face in the nucleus of a cell, was analyzed for its expression in prostate cancer. We report here that its upregulation was associated with a shorter prostate‐specific antigen recurrence‐free survival after prostatectomy in a large cohort of prostate cancer patients.
Abbreviations
- CTCF
CCCTC‐binding factor
- FISH
fluorescence in situ hybridization
- IHC
immunohistochemistry
- Ki67‐LI
Ki67 labeling index
- PSA
prostate‐specific antigen
- PTEN
phosphatase and tensin homolog
- TMA
tissue microarray
- TMPRSS2:ERG
transmembrane protease, serine 2:ETS‐related gene fusion
1. Introduction
Prostate cancer has an incidence of 76 in 100 000 men and a mortality rate of 10 in 100 000 men in Western Europe (Bray et al., 2018). This means that one out of seven prostate cancer patient has a rather aggressive disease. In localized disease, the decision between radical prostatectomy and observation is guided by established pretreatment prognostic parameters [Gleason grade and tumor extent on biopsies, preoperative prostate‐specific antigen (PSA), and clinical stage] (Thompson and Tangen, 2012; Wilt et al., 2012). In retrospective studies, these parameters are statistically powerful. For individual treatment decisions, their specificity, sensitivity, and predictive value are suboptimal. Thus, it is hoped that new clinically applicable molecular markers will enable a more reliable prediction of prostate cancer aggressiveness.
CCCTC‐binding factor (CTCF) is a ubiquitously expressed transcription factor characterized by 11 zinc fingers binding to more than 20 000 DNA loci in the human genome (Ohlsson et al., 2001). By mediating inter‐ and intrachromosomal interactions, CTCF is essential for the three‐dimensional chromatin organization (Ong and Corces, 2014) and participates in the regulation of DNA methylation and transcriptional activity (Guastafierro et al., 2008). In addition, CTCF is involved in the regulation of telomerase as reviewed previously in a complex manner (Ramlee et al., 2016). The binding of CTCF to the first exon of the hTERT gene was reported to suppress its expression in telomerase‐negative cells but not in cancer cells in a DNA methylation‐dependent manner (Renaud et al., 2007). In line with this finding, treatment with a histone deacetylase inhibitor induced histone hyperacetylation and loss of CpG methylation, which facilitated CTCF binding at this locus (Meeran et al., 2010). Furthermore, CTCF was reported to be involved in the spatial organization of the subtelomeres and linked to regulating hTERT expression via binding to an upstream enhancer (Eldholm et al., 2014) as well as transcription of the telomeric TERRA transcript and stability of the shelterin complex (Deng et al., 2012). Thus, it is not surprising that deregulation of CTCF has been observed in many human cancer types. For example, overexpression of CTCF has been reported to occur in breast cancer (Docquier et al., 2005), cervical cancer (Velazquez‐Hernandez et al., 2015), ovarian cancer (Zhao et al., 2017), and hepatocellular carcinoma (Zhang et al., 2017), and has been linked to adverse tumor features in some of them (Zhang et al., 2017; Zhao et al., 2017). Little is known about the clinical impact of CTCF expression in prostate cancer. However, genome‐wide association studies revealed single nucleotide polymorphisms in the CTCF region associated with prostate cancer risk and functional studies in cell lines demonstrated an impact of CTCF knockdown on prostate cell proliferation, migration, and invasion (Chen et al., 2015; Shan et al., 2019). Such data suggest a biologically relevant role of CTCF in prostate cancer (Whitington et al., 2016).
To learn more on the impact of CTCF expression on the clinical course of prostate cancer, we took advantage of our large tissue microarray (TMA) resource including more than 17 000 prostate cancers. The database attached to our TMA contains pathological and clinical follow‐up data, as well as abundant molecular data on key molecular alterations of this disease such as ERG fusion and various genomic deletions.
2. Materials and methods
2.1. Patients
The 17 747 patients had radical prostatectomy between 1992 and 2014 at the Department of Urology and the Martini Clinics at the University Medical Center Hamburg‐Eppendorf. The entire prostate was embedded and analyzed with a standard procedure (Schlomm et al., 2008). Classical Gleason grading was done along with ‘quantitative’ Gleason grading reflecting the percentage of Gleason 4 patterns as described before (Sauter et al., 2016). Follow‐up was available for 14 464 patients (median 48 months, range 1–275 months; Table S1). PSA recurrence was defined as a postoperative PSA level of ≥ 0.2 ng·mL−1 or increasing levels in subsequent measurements. The TMA was produced with 0.6 mm spots as described earlier in detail (Kononen et al., 1998; Mirlacher and Simon, 2010). Each TMA contained various control tissues and normal prostate tissue. The TMA was annotated with results on ERG expression (Minner et al., 2011), ERG break‐apart fluorescence in situ hybridization (FISH) (Tsourlakis et al., 2016), Ki67 labeling index (Ki67‐LI) (Tennstedt et al., 2012), and deletion status of 5q21 (CHD1 (Burkhardt et al., 2013), 6q15 (MAP3K7) (Kluth et al., 2013), 10q23 [phosphatase and tensin homolog (PTEN)] (Krohn et al., 2012), and 3p13 (FOXP1 (Krohn et al., 2013). Archived diagnostic leftover tissues were pseudo‐anonymized and used without consent in accordance with the local law (HmbKHG, §12a) and approved by the local ethics committee (Ärztekammer Hamburg, WF‐049/09). The work has been carried out in compliance with the Helsinki Declaration.
2.2. Immunohistochemistry (IHC)
Freshly cut TMA sections were stained on the same day and experiment. Slides were dewaxed and exposed to heat‐induced antigen retrieval for 5 min at 121 °C in pH 7.8 Tris/EDTA/citrate buffer. The anti‐CTCF polyclonal rabbit antibody HPA004122 Sigma (Merck, Darmstadt, Germany) was applied at 37 °C for 60 min at 1 : 150 dilution (Uhlen et al., 2015). Bound antibody was then visualized using the EnVision Kit (Dako, Glostrup, Denmark) according to the manufacturer's directions. CTCF staining was validated with positive and negative control tissues and found in the nucleus of positive cells. Complete absence of staining was scored as ‘negative’, and a ‘low’ score was given to cancers with a staining intensity of 1+, or 2+ in ≤ 70% of tumor cells, or 3+ in ≤ 30% of tumor cells. The score was ‘high’ if staining intensity was 2+ in > 70% of tumor cells or 3+ in > 30% of tumor cells.
2.3. Statistics
Contingency tables were calculated to study association, and the chi‐square test was used to find significant relationship between CTCF expression and clinicopathological variables. Analysis of variance and F‐test were applied to find association between CTCF expression and Ki67‐LI. Kaplan–Meier analysis and log‐rank test were applied to test differences in PSA recurrence after prostatectomy. Cox proportional hazards regression analysis was performed to test independence and significance of pathological, molecular, and clinical variables. jmp 12 (SAS Institute Inc., Cary, NC, USA) was used.
3. Results
3.1. CTCF staining
A total of 12 555 (71%) tumor samples were interpretable. The remaining 5192 spots (29%) were noninformative because the tissue sample lacked completely or had no unequivocal cancer cells. At the selected 1 : 150 dilution of the anti‐CTCF antibody HPA004122, normal prostate tissue showed negative to low nuclear CTCF expression in basal and luminal cells. In cancers, detectable nuclear CTCF staining was seen in 7726 of our 12 555 (61.5%) tumors and was considered low in 44.6% and high in 17% of cancers. Representative images of CTCF staining are given in Fig. 1.
Figure 1.

Representative pictures of (A) negative, (B) low, and (C) high CTCF staining in prostate cancer. Spot size is 600 µm at 100/400× original.
3.2. Association with TMPRSS2:ERG fusion status and ERG protein expression
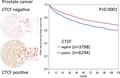
Data on ERG expression obtained by IHC and on transmembrane protease, serine 2:ETS‐related gene fusion (TMPRSS2:ERG) rearrangement obtained by FISH were available from 7935 and from 5360 cancers with interpretable CTCF staining results. Data on both ERG FISH and IHC were available from 5191 cancers, and an identical result (ERG IHC positive and break by FISH or ERG IHC negative and missing break by FISH) was found in 4970 of 5191 (96%) cancers. CTCF staining was strongly linked to TMPRSS2:ERG rearrangement and ERG positivity in our set of prostate cancers (P < 0.0001, Fig. 2).
Figure 2.

Association between CTCF staining and ERG status (IHC/FISH).
3.3. Association with tumor phenotype
CCCTC‐binding factor staining was significantly linked to advanced tumor stage, high Gleason grade, and presence of lymph node metastasis (P ≤ 0.0002 each, Fig. 3). The increase in the percentage of CTCF expression for stage and lymph node metastasis was restricted to the low CTCF group and not seen in the high group, indicating that grouping in CTCF negative vs. positive as shown in Fig. 4 is the more appropriate model for the prognostic effect of CTCF in prostate cancer (Tables S2 and S3).
Figure 3.
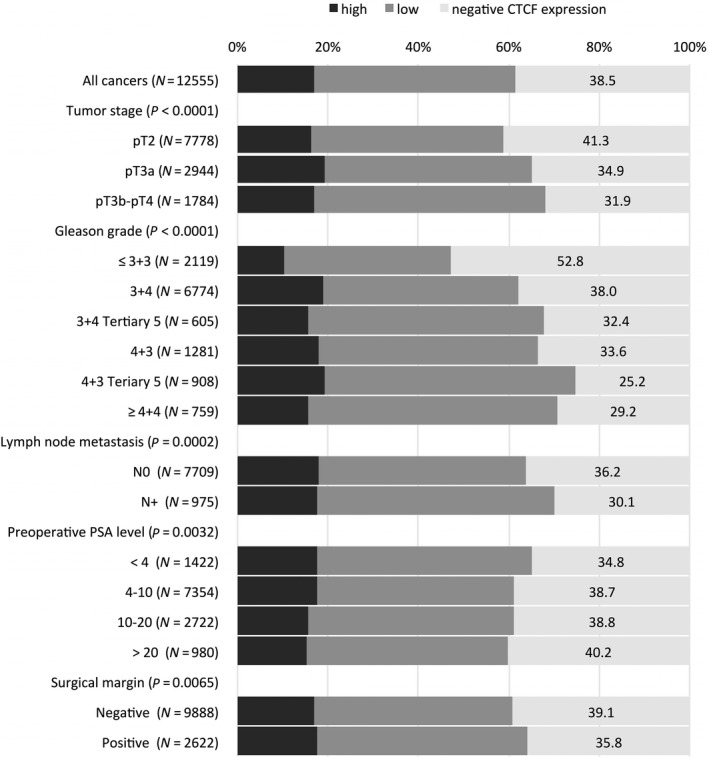
Association between CTCF staining and prostate cancer phenotype.
Figure 4.

Association between negative and positive CTCF expression and biochemical recurrence in (A) all cancers, (B) the ERG‐negative, and (C) the ERG‐positive subset.
3.4. Association with PSA recurrence
Positive CTCF staining was significantly associated with early PSA recurrence. Subset analyses revealed that this association was true for both ERG‐negative and ERG‐positive cancers (P < 0.0001, Fig. 4). To better understand the prognostic power of CTCF, we performed further subset analyses in cancers with identical classical and quantitative Gleason scores. Here, CTCF staining did not provide clear‐cut prognostic information beyond the Gleason score, neither in any subsets defined by the classical Gleason score (Fig. S1a) nor by the quantitative Gleason score (Fig. S1b–h).
3.5. Association with genomic deletions and tumor cell proliferation
CCCTC‐binding factor staining was strongly associated with PTEN deletions when all cancers were jointly analyzed (P < 0.0001, Fig. 5). This held also true in the subset of ERG‐negative cancers (P < 0.0001), while this association was lost in ERG‐positive cancers (P = 0.0876). CTCF expression was significantly linked to increased cell proliferation as measured by Ki67‐LI (Table 1). The average Ki67‐LI increased from 2.1 ± 0.05 in cancers lacking CTCF expression to 3.20 ± 0.06 in cancers with low and to 3.42 ± 0.09 in cancers with high CTCF levels (P < 0.0001). This association held true in all tumor subsets with identical Gleason score (≤ 3 + 3: P < 0.0001, 3 + 4: P < 0.0001, 4 + 3: P = 0.006, ≥ 4 + 4: P = 0.0205).
Figure 5.

Association between CTCF staining and 10q23 (PTEN), 5q21 (CHD1), 6q15 (MAP3K7), 3p13 (FOXP1) deletions in all cancers, the ERG‐negative, and the ERG‐positive subset.
Table 1.
Association between CTCF staining results and Ki67‐LI in various Gleason categories. SEM, standard error of the mean.
| Gleason | CTCF expression | N | Ki67‐LI mean | ±SEM | P |
|---|---|---|---|---|---|
| Total | Negative | 2333 | 2.09 | 0.05 | < 0.0001 |
| Low | 2229 | 3.20 | 0.06 | ||
| High | 930 | 3.42 | 0.09 | ||
| ≤ 3 + 3 | Negative | 622 | 1.84 | 0.08 | < 0.0001 |
| Low | 408 | 2.64 | 0.10 | ||
| High | 102 | 2.72 | 0.21 | ||
| 3 + 4 | Negative | 1248 | 1.96 | 0.06 | < 0.0001 |
| Low | 1228 | 3.01 | 0.07 | ||
| High | 611 | 3.22 | 0.09 | ||
| 3 + 4 Tertiary 5 | Negative | 85 | 2.61 | 0.29 | 0.0024 |
| Low | 100 | 3.48 | 0.27 | ||
| High | 35 | 4.46 | 0.46 | ||
| 4 + 3 | Negative | 210 | 2.68 | 0.23 | 0.006 |
| Low | 235 | 3.56 | 0.21 | ||
| High | 90 | 3.74 | 0.35 | ||
| 4 + 3 Tertiary 5 | Negative | 89 | 2.52 | 0.39 | 0.0006 |
| Low | 141 | 4.45 | 0.31 | ||
| High | 48 | 4.00 | 0.54 | ||
| ≥ 4 + 4 | Negative | 79 | 3.43 | 0.52 | 0.0205 |
| Low | 115 | 4.75 | 0.43 | ||
| High | 42 | 5.81 | 0.71 |
3.6. Multivariable analyses
Multivariable analyses were performed in all cancers and the subset of ERG‐negative and ERG‐positive cancers evaluating the clinical relevance of CTCF expression in different scenarios (Table 2, Table S4). The results of these analyses demonstrated a weak independent prognostic role of CTCF in the preoperative setting with a hazard ratio of 1.30 and a P‐value < 0.0001.
Table 2.
Cox proportional hazards for PSA recurrence‐free survival after prostatectomy of established preoperative prognostic parameter and CTCF expression.
| Variable | N | Univariable analysis | Multivariable analysis (N = 8624) | |
|---|---|---|---|---|
| Gleason grade biopsy | ≥ 4 + 4 vs. ≤ 3 + 3 | 12 172 | 5.91 (5.33–6.55)*** | 4.01 (3.54–4.54)*** |
| cT‐stage | T3a vs. T1c | 14 404 | 2.15 (1.72–2.65)*** | 1.46 (1.11–1.88)* |
| Preoperative PSA level | ≥ 20 vs. <4 | 14 611 | 5.06 (4.41–5.81)*** | 3.44 (2.84–4.17)*** |
| CTCF expression | Positive vs. negative | 10 227 | 1.37 (1.26–1.48)*** | 1.30 (1.19–1.42)*** |
| ERG‐negative subset | Positive vs. negative | 4120 | 1.40 (1.24–1.58)*** | 1.27 (1.12–1.43)** , a |
| ERG‐positive subset | Positive vs. negative | 3297 | 1.40 (1.18–1.67)*** | 1.44 (1.20–1.72)*** , b |
Confidence interval (95%) in brackets; asterisk indicates significance level:
N = 4014.
N = 3182.
P ≤ 0.05
P ≤ 0.001
P ≤ 0.0001.
4. Discussion
The results of our study show that CTCF expression is linked to poor outcome in prostate cancer.
Our immunohistochemical analysis revealed detectable CTCF staining in 61.5% of 12 555 analyzable prostate cancers. The level of immunostaining was typically higher in cancers than in normal prostate glands, the latter of which showed mostly negative and only sometimes weak CTCF expression. This suggests that CTCF becomes upregulated during tumor development and/or progression in a relevant fraction of prostate cancers. Similar findings have been reported from other solid cancer types. For example, CTCF was more strongly expressed in breast and cervical cancers as compared to very low CTCF levels detected in normal breast tissues and in low‐grade intraepithelial lesions of the cervix (Docquier et al., 2005; Velazquez‐Hernandez et al., 2015).
The significant association of elevated CTCF expression with unfavorable tumor phenotype, including high Gleason grade, advanced tumor stage, presence of lymph node metastasis (P ≤ 0.0002, each), accelerated cell proliferation (P < 0.0001), and early biochemical recurrence (P ≤ 0.001), argues for a role of CTCF for prostate cancer progression and aggressiveness. This view is supported by recent data from Shan et al. showing that prostate cancer cell line growth (LNCap, PC‐3) in nude mice is promoted by CTCF (Shan et al., 2019). A tumor‐promoting role of CTCF is also supported by studies in other cancer types. For example, CTCF upregulation was linked to advanced or metastatic disease and poor prognosis in hepatocellular carcinoma and ovarian cancers (Zhang et al., 2017; Zhao et al., 2017). CTCF has a multifunctional role enabling chromatin looping for interactions between distal enhancers and proximal promoters. It is likely that altered CTCF expression can cause deregulation of many genes. In fact, it has been shown that many tumor‐related genes become affected by CTCF expression changes, including p53, retinoblastoma protein, c‐myc, insulin‐like growth factor 2, p14, p16, and Fox0 (Fiorentino and Giordano, 2012; Shan et al., 2019). Interestingly, structural DNA changes induced by CTCF have also been implicated with telomere maintenance and tumor cell immortality as CTCF is supposed to prevent telomere DNA damage signaling (Deng et al., 2012; Renaud et al., 2007).
The highly annotated TMA allowed us to further study CTCF upregulation in molecularly defined subgroups. About 50% of all prostate cancers carry a gene fusion linking the androgen‐regulated serine protease TMPRSS2 with the ETS‐transcription factor ERG resulting in an androgen‐related overexpression of ERG (Brase et al., 2011; Tomlins et al., 2005; Weischenfeldt et al., 2013). The intriguing association between strong CTCF expression and ERG fusion is compatible with the role of CTCF for the development of genomic rearrangements (Canela et al., 2017). It is well known that CTCF increases the risk for translocations through induction of chromosomal proximity (Handoko et al., 2011; Ong and Corces, 2014) and that it is even implicated in DNA looping involving ETS genes (Qin et al., 2015; Taslim et al., 2012). Comparison with recurrent genomic deletions identified PTEN as the only deletion that was linked to strong CTCF expression. PTEN deletion is the main reason for hyperactive PI3K/AKT signaling in prostate cancer and is associated with tumor growth, progression, and poor clinical outcome (Taslim et al., 2012). An effect of PTEN inactivation on CTCF expression fits well with earlier reports linking PTEN to CTCF via MYC: Loss of PTEN triggers MYC upregulation (Kaur and Cole, 2013), which is an upstream activator of CTCF expression (Klenova et al., 2002).
The results of our multivariable modeling identify CTCF as a candidate marker that could help to guide therapy decisions at the stage of the needle biopsy. However, it is of note that the Gleason grade is the strongest (and least expensive) prognostic feature in prostate cancer. In a recent analysis, we have demonstrated that by using the percentage of unfavorable Gleason patterns, the Gleason grading can be transformed from a categorical into a continuous variable with an even finer distinction of prognostic subgroups (Sauter et al., 2018; Sauter et al., 2016). That CTCF lacks prognostic impact in cancers with identical (classical and quantitative) Gleason is another proof for the unprecedented prognostic power of Gleason scoring when it is performed in a specialized center.
The multifunctional role of CTCF in cancer biology may open new avenues for novel targeted anticancer therapies. For example, it has been shown that CTCF knockdown causes an anti‐apoptotic effect in breast cancer cells (Docquier et al., 2005). Furthermore, CTCF can regulate TERT expression and induce telomere instability (Ramlee et al., 2016; Renaud et al., 2007). It is, thus, tempting to speculate that prostate cancer patients with CTCF expression may benefit from novel therapies targeting telomere instability once they become available. For example, putative telomere‐associated target structures may include the telomeric G‐strand, components of the telomere synthesis machinery, or telomere protection proteins such as shelterin, the molecular target of gemcitabine (Fadri‐Moskwik et al., 2013).
5. Conclusions
In summary, our study shows that CTCF expression is a prognostic unfavorable feature in prostate cancer, but CTCF is a candidate biomarker with low predictive power.
Conflict of interest
The authors declare no conflict of interest.
Author contributions
DH, CS, RS, AS, and GS designed the study and drafted the manuscript. HHu, MG, AH, HHe, RK, and KR participated in the study design. EB, CS, MCT, and SM performed IHC analysis and scoring. FB, FJ, WW, and SS participated in pathology data analysis. CH, CS, and RS performed statistical analysis. AH, TS, MK, AMP, and MO participated in data interpretation and helped to draft the manuscript. All authors read and approved the final manuscript.
Supporting information
Table S1 . Pathological and clinical data of the arrayed prostate cancers.
Table S2 . Association between CTCF staining results and prostate cancer phenotype in the ERG negative subset.
Table S3 . Association between CTCF staining results and prostate cancer phenotype in the ERG fusion positive subset.
Table S4 . Multivariable analysis including CTCF expression in all cancers, the ERG negative and the ERG positive subset.
Fig. S1 . Prognostic impact of CTCF expression in subsets of cancers defined by a) the classical Gleason score categories and b–h) the quantitative Gleason score categories defined by the percentage of b) ≤ 5%, c) 6–10%, d) 11–20%, e) 21–30%, f) 31–49%, g) 50–60%, and h) 61–100% Gleason 4 patterns.
Acknowledgements
We thank Christina Möller‐Koop, Janett Lütgens, Sünje Seekamp, and Inge Brandt for excellent technical assistance. This work support was by project CancerTelSys (grants 01ZX130 and 01ZX1602) in the e:Med program and the project CSCC (01EO1002, 01EO1502) of the German Federal Ministry of Education and Research (BMBF).
Doris Höflmayer and Amélie Steinhoff contributed equally to this work
References
- Brase JC, Johannes M, Mannsperger H, Falth M, Metzger J, Kacprzyk LA, Andrasiuk T, Gade S, Meister M, Sirma H et al (2011) TMPRSS2‐ERG ‐specific transcriptional modulation is associated with prostate cancer biomarkers and TGF‐beta signaling. BMC Cancer 11, 507. [DOI] [PMC free article] [PubMed] [Google Scholar]
- Bray F, Ferlay J, Soerjomataram I, Siegel RL, Torre LA and Jemal A (2018) Global cancer statistics 2018: GLOBOCAN estimates of incidence and mortality worldwide for 36 cancers in 185 countries. CA Cancer J Clin 68, 394–424. [DOI] [PubMed] [Google Scholar]
- Burkhardt L, Fuchs S, Krohn A, Masser S, Mader M, Kluth M, Bachmann F, Huland H, Steuber T, Graefen M et al (2013) CHD1 is a 5q21 tumor suppressor required for ERG rearrangement in prostate cancer. Can Res 73, 2795–2805. [DOI] [PubMed] [Google Scholar]
- Canela A, Maman Y, Jung S, Wong N, Callen E, Day A, Kieffer‐Kwon KR, Pekowska A, Zhang H, Rao SSP et al (2017) Genome organization drives chromosome fragility. Cell 170, 507–521, e518. [DOI] [PMC free article] [PubMed] [Google Scholar]
- Chen H, Yu H, Wang J, Zhang Z, Gao Z, Chen Z, Lu Y, Liu W, Jiang D, Zheng SL et al (2015) Systematic enrichment analysis of potentially functional regions for 103 prostate cancer risk‐associated loci. Prostate 75, 1264–1276. [DOI] [PubMed] [Google Scholar]
- Deng Z, Wang Z, Stong N, Plasschaert R, Moczan A, Chen HS, Hu S, Wikramasinghe P, Davuluri RV, Bartolomei MS et al (2012) A role for CTCF and cohesin in subtelomere chromatin organization, TERRA transcription, and telomere end protection. EMBO J 31, 4165–4178. [DOI] [PMC free article] [PubMed] [Google Scholar]
- Docquier F, Farrar D, D'Arcy V, Chernukhin I, Robinson AF, Loukinov D, Vatolin S, Pack S, Mackay A, Harris RA et al (2005) Heightened expression of CTCF in breast cancer cells is associated with resistance to apoptosis. Can Res 65, 5112–5122. [DOI] [PubMed] [Google Scholar]
- Eldholm V, Haugen A and Zienolddiny S (2014) CTCF mediates the TERT enhancer‐promoter interactions in lung cancer cells: identification of a novel enhancer region involved in the regulation of TERT gene. Int J Cancer 134, 2305–2313. [DOI] [PubMed] [Google Scholar]
- Fadri‐Moskwik M, Zhou Q and Chai W (2013). Beyond telomerase: telomere instability as a novel target for cancer therapy. J Mol Genet Med 7, 91. [DOI] [PMC free article] [PubMed] [Google Scholar]
- Fiorentino FP and Giordano A (2012) The tumor suppressor role of CTCF. J Cell Physiol 227, 479–492. [DOI] [PubMed] [Google Scholar]
- Guastafierro T, Cecchinelli B, Zampieri M, Reale A, Riggio G, Sthandier O, Zupi G, Calabrese L and Caiafa P (2008) CCCTC‐binding factor activates PARP‐1 affecting DNA methylation machinery. J Biol Chem 283, 21873–21880. [DOI] [PMC free article] [PubMed] [Google Scholar]
- Handoko L, Xu H, Li G, Ngan CY, Chew E, Schnapp M, Lee CW, Ye C, Ping JL, Mulawadi F et al (2011) CTCF‐mediated functional chromatin interactome in pluripotent cells. Nat Genet 43, 630–638. [DOI] [PMC free article] [PubMed] [Google Scholar]
- Kaur M and Cole MD (2013) MYC acts via the PTEN tumor suppressor to elicit autoregulation and genome‐wide gene repression by activation of the Ezh2 methyltransferase. Can Res 73, 695–705. [DOI] [PMC free article] [PubMed] [Google Scholar]
- Klenova EM, Morse HC 3rd, Ohlsson R and Lobanenkov VV (2002) The novel BORIS + CTCF gene family is uniquely involved in the epigenetics of normal biology and cancer. Semin Cancer Biol 12, 399–414. [DOI] [PubMed] [Google Scholar]
- Kluth M, Hesse J, Heinl A, Krohn A, Steurer S, Sirma H, Simon R, Mayer PS, Schumacher U, Grupp K et al (2013) Genomic deletion of MAP3K7 at 6q12‐22 is associated with early PSA recurrence in prostate cancer and absence of TMPRSS2:ERG fusions. Mod Pathol 26, 975–983. [DOI] [PubMed] [Google Scholar]
- Kononen J, Bubendorf L, Kallioniemi A, Barlund M, Schraml P, Leighton S, Torhorst J, Mihatsch MJ, Sauter G and Kallioniemi OP (1998) Tissue microarrays for high‐throughput molecular profiling of tumor specimens. Nat Med 4, 844–847. [DOI] [PubMed] [Google Scholar]
- Krohn A, Diedler T, Burkhardt L, Mayer PS, De Silva C, Meyer‐Kornblum M, Kotschau D, Tennstedt P, Huang J, Gerhauser C et al (2012) Genomic deletion of PTEN is associated with tumor progression and early PSA recurrence in ERG fusion‐positive and fusion‐negative prostate cancer. Am J Pathol 181, 401–412. [DOI] [PubMed] [Google Scholar]
- Krohn A, Seidel A, Burkhardt L, Bachmann F, Mader M, Grupp K, Eichenauer T, Becker A, Adam M, Graefen M et al (2013) Recurrent deletion of 3p13 targets multiple tumour suppressor genes and defines a distinct subgroup of aggressive ERG fusion‐positive prostate cancers. J Pathol 231, 130–141. [DOI] [PubMed] [Google Scholar]
- Meeran SM, Patel SN and Tollefsbol TO (2010) Sulforaphane causes epigenetic repression of hTERT expression in human breast cancer cell lines. PLoS ONE 5, e11457. [DOI] [PMC free article] [PubMed] [Google Scholar]
- Minner S, Enodien M, Sirma H, Luebke AM, Krohn A, Mayer PS, Simon R, Tennstedt P, Muller J, Scholz L et al (2011) ERG status is unrelated to PSA recurrence in radically operated prostate cancer in the absence of antihormonal therapy. Clin Cancer Res 17, 5878–5888. [DOI] [PubMed] [Google Scholar]
- Mirlacher M and Simon R (2010) Recipient block TMA technique. Methods Mol Biol 664, 37–44. [DOI] [PubMed] [Google Scholar]
- Ohlsson R, Renkawitz R and Lobanenkov V (2001) CTCF is a uniquely versatile transcription regulator linked to epigenetics and disease. Trends Genet 17, 520–527. [DOI] [PubMed] [Google Scholar]
- Ong CT and Corces VG (2014) CTCF: an architectural protein bridging genome topology and function. Nat Rev Genet 15, 234–246. [DOI] [PMC free article] [PubMed] [Google Scholar]
- Qin F, Song Z, Babiceanu M, Song Y, Facemire L, Singh R, Adli M and Li H (2015) Discovery of CTCF‐sensitive Cis‐spliced fusion RNAs between adjacent genes in human prostate cells. PLoS Genet 11, e1005001. [DOI] [PMC free article] [PubMed] [Google Scholar]
- Ramlee MK, Wang J, Toh WX and Li S (2016) Transcription regulation of the human telomerase reverse transcriptase (hTERT) gene. Genes (Basel), 7, 50. [DOI] [PMC free article] [PubMed] [Google Scholar]
- Renaud S, Loukinov D, Abdullaev Z, Guilleret I, Bosman FT, Lobanenkov V and Benhattar J (2007) Dual role of DNA methylation inside and outside of CTCF‐binding regions in the transcriptional regulation of the telomerase hTERT gene. Nucleic Acids Res 35, 1245–1256. [DOI] [PMC free article] [PubMed] [Google Scholar]
- Sauter G, Clauditz T, Steurer S, Wittmer C, Buscheck F, Krech T, Lutz F, Lennartz M, Harms L, Lawrenz L et al (2018) Integrating tertiary Gleason 5 patterns into quantitative Gleason grading in prostate biopsies and prostatectomy specimens. Eur Urol 73, 674–683. [DOI] [PubMed] [Google Scholar]
- Sauter G, Steurer S, Clauditz TS, Krech T, Wittmer C, Lutz F, Lennartz M, Janssen T, Hakimi N, Simon R et al (2016) Clinical Utility of quantitative Gleason grading in prostate biopsies and prostatectomy specimens. Eur Urol 69, 592–598. [DOI] [PubMed] [Google Scholar]
- Schlomm T, Iwers L, Kirstein P, Jessen B, Kollermann J, Minner S, Passow‐Drolet A, Mirlacher M, Milde‐Langosch K, Graefen M et al (2008) Clinical significance of p53 alterations in surgically treated prostate cancers. Mod Pathol 21, 1371–1378. [DOI] [PubMed] [Google Scholar]
- Shan Z, Li Y, Yu S, Wu J, Zhang C, Ma Y, Zhuang G, Wang J, Gao Z and Liu D (2019) CTCF regulates the FoxO signaling pathway to affect the progression of prostate cancer. J Cell Mol Med 23, 3130–3139. [DOI] [PMC free article] [PubMed] [Google Scholar]
- Taslim C, Chen Z, Huang K, Huang TH, Wang Q and Lin S (2012) Integrated analysis identifies a class of androgen‐responsive genes regulated by short combinatorial long‐range mechanism facilitated by CTCF. Nucleic Acids Res 40, 4754–4764. [DOI] [PMC free article] [PubMed] [Google Scholar]
- Tennstedt P, Koster P, Bruchmann A, Mirlacher M, Haese A, Steuber T, Sauter G, Huland H, Graefen M, Schlomm T et al (2012) The impact of the number of cores on tissue microarray studies investigating prostate cancer biomarkers. Int J Oncol 40, 261–268. [DOI] [PubMed] [Google Scholar]
- Thompson IM Jr and Tangen CM (2012) Prostate cancer–uncertainty and a way forward. N Engl J Med 367, 270–271. [DOI] [PubMed] [Google Scholar]
- Tomlins SA, Rhodes DR, Perner S, Dhanasekaran SM, Mehra R, Sun XW, Varambally S, Cao X, Tchinda J, Kuefer R et al (2005) Recurrent fusion of TMPRSS2 and ETS transcription factor genes in prostate cancer. Science 310, 644–648. [DOI] [PubMed] [Google Scholar]
- Tsourlakis MC, Stender A, Quaas A, Kluth M, Wittmer C, Haese A, Graefen M, Steurer S, Simon R, Korbel J et al (2016) Heterogeneity of ERG expression in prostate cancer: a large section mapping study of entire prostatectomy specimens from 125 patients. BMC Cancer 16, 641. [DOI] [PMC free article] [PubMed] [Google Scholar]
- Uhlen M, Fagerberg L, Hallstrom BM, Lindskog C, Oksvold P, Mardinoglu A, Sivertsson A, Kampf C, Sjostedt E, Asplund A et al (2015). Proteomics. Tissue‐based map of the human proteome. Science 347, 1260419. [DOI] [PubMed] [Google Scholar]
- Velazquez‐Hernandez N, Reyes‐Romero MA, Barragan‐Hernandez M, Guerrero‐Romero F, Rodriguez‐Moran M, Aguilar‐Duran M and Lazalde Medina B (2015) BORIS and CTCF are overexpressed in squamous intraepithelial lesions and cervical cancer. Genet Mol Res 14, 6094–6100. [DOI] [PubMed] [Google Scholar]
- Weischenfeldt J, Simon R, Feuerbach L, Schlangen K, Weichenhan D, Minner S, Wuttig D, Warnatz HJ, Stehr H, Rausch T et al (2013) Integrative genomic analyses reveal an androgen‐driven somatic alteration landscape in early‐onset prostate cancer. Cancer Cell 23, 159–170. [DOI] [PubMed] [Google Scholar]
- Whitington T, Gao P, Song W, Ross‐Adams H, Lamb AD, Yang Y, Svezia I, Klevebring D, Mills IG, Karlsson R et al (2016) Gene regulatory mechanisms underpinning prostate cancer susceptibility. Nat Genet 48, 387–397. [DOI] [PubMed] [Google Scholar]
- Wilt TJ, Brawer MK, Jones KM, Barry MJ, Aronson WJ, Fox S, Gingrich JR, Wei JT, Gilhooly P, Grob BM et al (2012) Radical prostatectomy versus observation for localized prostate cancer. N Engl J Med 367, 203–213. [DOI] [PMC free article] [PubMed] [Google Scholar]
- Zhang B, Zhang Y, Zou X, Chan AW, Zhang R, Lee TK, Liu H, Lau EY, Ho NP, Lai PB et al (2017) The CCCTC‐binding factor (CTCF)‐forkhead box protein M1 axis regulates tumour growth and metastasis in hepatocellular carcinoma. J Pathol 243, 418–430. [DOI] [PMC free article] [PubMed] [Google Scholar]
- Zhao L, Yang Y, Yin S, Yang T, Luo J, Xie R, Long H, Jiang L and Zhu B (2017) CTCF promotes epithelial ovarian cancer metastasis by broadly controlling the expression of metastasis‐associated genes. Oncotarget 8, 62217–62230. [DOI] [PMC free article] [PubMed] [Google Scholar]
Associated Data
This section collects any data citations, data availability statements, or supplementary materials included in this article.
Supplementary Materials
Table S1 . Pathological and clinical data of the arrayed prostate cancers.
Table S2 . Association between CTCF staining results and prostate cancer phenotype in the ERG negative subset.
Table S3 . Association between CTCF staining results and prostate cancer phenotype in the ERG fusion positive subset.
Table S4 . Multivariable analysis including CTCF expression in all cancers, the ERG negative and the ERG positive subset.
Fig. S1 . Prognostic impact of CTCF expression in subsets of cancers defined by a) the classical Gleason score categories and b–h) the quantitative Gleason score categories defined by the percentage of b) ≤ 5%, c) 6–10%, d) 11–20%, e) 21–30%, f) 31–49%, g) 50–60%, and h) 61–100% Gleason 4 patterns.