

The success of a sample preparation method can be difficult to evaluate for unusual or unfamiliar samples. Further, it can be hard to discern the suitability of a chosen database for a search of such data. Automated de novo sequencing can provide metrics for both problems.
Keywords: Algorithms, Caenorhabditis elegans, data evaluation, de novo sequencing, mass spectrometry, peptides*, protein identification, quality control and metrics, sequencing ms, tandem mass spectrometry, metaproteomics
Graphical Abstract

Highlights
An automated de novo sequencing program is evaluated with respect to different types of data.
The number of unique high scoring de novo sequences that can be assigned to a data set provides a metric of overall data quality.
A database suitability metric is presented for situations when the database choice is not obvious, or when the database quality is uncertain.
Abstract
The analysis of samples from unsequenced and/or understudied species as well as samples where the proteome is derived from multiple organisms poses two key questions. The first is whether the proteomic data obtained from an unusual sample type even contains peptide tandem mass spectra. The second question is whether an appropriate protein sequence database is available for proteomic searches. We describe the use of automated de novo sequencing for evaluating both the quality of a collection of tandem mass spectra and the suitability of a given protein sequence database for searching that data. Applications of this method include the proteome analysis of closely related species, metaproteomics, and proteomics of extinct organisms.
Matching tandem mass spectra to database-derived sequences is routine, and a variety of software pipelines are available (1). However, atypical and new types of samples can be problematic. For example, it can be difficult to evaluate sample preparation methods using LCMS/MS data from fossils, soil, or glacial meltwaters, when such samples are new to the research community, DNA is unattainable, or there is no obvious protein database to search. If the genome of the organism under study is unknown, or if the sample comes from multiple unknown species (i.e. metaproteomics) the suitability of a chosen sequence database can be difficult to evaluate (2). In the case of species whose genomes are unsequenced, data analysis typically employs a protein sequence database from a taxonomically related species, where the hope is that the sequences are mostly identical (3). For metaproteomics, the standard approach is to sequence the DNA in the sample, assemble a metagenome, and translate it into protein sequences as a FASTA formatted file (4). The hope is that there are no mistakes in assembly and translation to protein sequence, and that the translated metagenome accurately represents the metaproteome under study. Once a FASTA file is created, a database search is performed and the number of identifications is reported, yet it is not clear how many high-quality tandem mass spectra failed to make a match because the peptide sequence was not represented in the FASTA file. If there is more than one sequence database to choose from (e.g. because of different gene assembly methods), the one with the largest number of identifications over a range of false discovery rates is the optimal choice. Although this is a valid way to proceed, one cannot know if a low number of identifications is because of bad tandem mass spectrometry (MS/MS)1 data, an inappropriate or insufficient sequence database, or both. Here we propose and evaluate a simple solution that uses automated de novo sequencing to evaluate both tandem mass spectrum quality and sequence database suitability.
De novo sequencing is the concept of deriving a peptide sequence from a tandem mass spectrum without use of a sequence database (5). Before the existence of sequence databases (or ready access to powerful computers), de novo sequencing was the only approach to interpret tandem mass spectra of peptides. The degree to which one can successfully derive a sequence is dependent on spectral quality. Specifically, spectra that can be sequenced possess a contiguous series of sequencing ions of the same type (e.g. b- and y-type ions), which turns out to be the case for low energy collision induced dissociation (CID) of tryptic peptides. In the past, automated de novo sequencing has had difficulty deriving accurate sequences in a timely manner; however, the accuracy of the sequences and associated scores improved markedly with the use of high mass accuracy analyzers such as time-of-flight or orbitrap instruments. The recently developed automated de novo sequencing program called Novor (6) has eliminated the speed limitation in that the software can generate de novo sequences faster than it takes to acquire the data (and generally in less time than a database search of the same data). The question now is: what should we do with these de novo interpretations?
Here we describe an approach that utilizes Novor to assess tandem mass spectra quality and the suitability of FASTA files for database searches. Finding many high scoring de novo sequences in a data set implies that many high-quality tandem mass spectra of peptides are present (7). Likewise, comparison of de novo sequencing results with database search results (all from the same data file and scored with the same database search algorithm) can be used to determine the suitability of a chosen FASTA file. The strategy is to append de novo sequences to the FASTA file under study, run a standard database search of the modified FASTA file, and compare the ranking of the de novo sequences with the original FASTA file sequences. Returning a higher number of matches to the original FASTA file sequences, compared with the de novo sequences, implies that the FASTA file is suitable for use in a database search. Here we show that automated de novo sequencing using Novor provides a simple and fast means of evaluating both tandem mass spectra and FASTA file quality.
EXPERIMENTAL PROCEDURES
Sample Preparation
A human K562 cell extract was obtained from Promega (Madison, WI). A C. elegans tryptic digest was prepared as previously described (8). Tryptic digests of whole Asian citrus psyllids (D. citri) were performed as described (9). One hundred milligrams of powdered cave bear bone provided by Richard E. Green (University of California, Santa Cruz, CA) (10–12) was placed in 500 μl of 0.2% PPS Silent Surfactant (Expedeon San Diego, CA) in 50 mm ammonium bicarbonate (ABC), and probe sonicated three times for 20 s while on ice. An additional 500 μl of 50 mm ABC brought the final extract to 1.0 ml in 0.1% PPS. The extract was centrifuged, and the supernatant shown to contain 1.2 mg/ml total protein using a BCA assay. A spotted ratfish (Hydrolagus colliei) and a little skate (Leucoraja erinacea) were collected and euthanized in compliance with IACUC protocol numbers, IACUC16–014 and AUP18–0001 respectively. The ratfish was collected from Puget Sound and experimentation was carried out at the Benaroya Research Institute in Seattle, WA. The skate was shipped from the Marine Biological Laboratory in Woods Hole, MA to the University of California, Merced where studies were performed. For both specimens, viscous hydrogel found within the electrosensory ampullae of Lorenzini was extracted by applying pressure on the organs externally. Dilution of 100 μl of this material with 200 μl of 0.2% PPS and 50 mm Tris buffer at pH 8 reduced the sample viscosity before tryptic digestion. Glacial silt from Greenland meltwater was isolated at the field site. Sample preparation, including DNA extraction, is described in detail in the supplemental section.
Reduction and alkylation of disulfide bonds employed treatment with 5 mm tris(2-carboxyethyl) phosphine for an hour at 37 C, cooling to room temperature, and adding 5.5 mm iodoacetamide at room temperature for 20 min. Tryptic digestion proceeded overnight using 1:50 by weight of Promega trypsin at 37 C. Digestion was stopped and PPS cleaved by acidification with trifluoroacetic acid (TFA) (0.2% by volume and pH 2, as verified by pH paper). In most cases, the tryptic digestions were analyzed directly; however, the fish hydrogel samples were subjected to solid phase extraction using MCX cartridges (Waters) per manufacturer's instructions, dried on a vacuum centrifuge, and resolubilized in 100 μl of 2% acetonitrile containing 0.1% TFA.
Data Acquisition
All mass spectrometry was performed on either a Fusion Orbitrap or Q-Exactive-HF (Thermo Fisher Scientific, San Jose, CA) mass spectrometer. Up to 1 μg of each sample digest was loaded from the autosampler onto a 150-μm inner diameter (ID) Kasil fritted trap packed with Reprosil-Pur C18-AQ (3-μm bead diameter, Dr. Maisch Ammerbuch, Germany) to a bed length of 2 cm at a flow rate of 2 μl/min. After loading and desalting using a total volume of 10 μl of 0.1% formic acid plus 2% acetonitrile, the trap was brought on-line with a pulled fused-silica capillary tip (75-μm ID) packed with the same Reprosil C18-AQ that was mounted in a microspray source and placed in line with a Waters Nanoacquity binary UPLC pump plus autosampler. Peptides were eluted off the column using a gradient of 2–35% acetonitrile in 0.1% formic acid over 60 min, followed by 35–60% acetonitrile over 5 min at a flow rate of 250 nl/min. The mass spectrometers were operated using electrospray ionization (2 kV) with the heated transfer tube at 275 C using data dependent acquisition (DDA) in the so-called “Top Speed” mode (Fusion), or “Top 20” mode (Q-Exactive). The orbitrap resolution was 120,000 at m/z 200, and for tandem mass spectrometry (MS/MS) the linear ion trap provided unit resolution or the orbitrap was operated at a resolving power of 15,000. Unless otherwise specified, the MS/MS spectra were acquired using a quadrupole isolation width of 1.6 m/z and HCD normalized collision energy (NCE) of 30%, or CID collision energy of 35%. Dynamic exclusion (including all isotope peaks) was set for 30 s using monoisotopic precursor selection. Data file format conversions were made with Proteowizard version 3.0.19053 (13).
Novor
De novo sequences were generated using the program Novor (v1.5.573) (6), and unless otherwise specified the following parameters were used - Enzyme: Trypsin, Instrument Type: HCD-FT, Precursor Error Tolerance: 10 ppm, Fragment Error Tolerance: 0.02 Da, and no variable modifications were considered, but the appropriate cysteine modification was used as a fixed modification. Novor produces a csv output file that includes the de novo sequence and a sequence score.
Evaluation of the Novor scores was performed by comparing high confidence peptide sequence search results with the de novo sequences. The database search used Comet (version 2018.01 rev. 1) (14), followed by PeptideProphet (15) using the Trans-Proteomic Pipeline (v5.0.0 Typhoon) (16). Novor was used to determine de novo sequences for spectra that in a database search gave peptide spectrum matches (PSMs) with false discovery rates (FDR) and Comet E-values less than 0.001. If the de novo sequence could account for at least 70% of the high confidence database sequence, then it was defined as having been correctly determined. Having made this determination, precision-recall curves were derived. Based on this analysis, de novo sequences with scores of 60 or higher were combined into a single protein sequence that was appended to the appropriate FASTA file (described next).
Sequence Databases
For the analysis of a human cell line tryptic digest, Uniprot reference proteome FASTA files were used from a number of mostly chordate species - B. floridae (2/27/18; 28,542), C. brachyrhynchos (2/27/18; 13,621), F. catus (3/13/18; 20,447), G. aculeatus (3/13/18; 20,666), G. gorilla (5/26/18; 21,795), H. sapiens (6/27/18; 21,053), O. anatinus (3/13/18; 21,677), O. garnettii (3/13/18; 19,451), P. abelii (5/26/18; 21,999), P. troglodytes (6/23/18; 23,008), S. harrisii (3/13/18; 18,781), T. asiatica (3/13/18; 10,315), and X. laevis (2/27/18; 41,562). For the analysis of a C. elegans tryptic digest, Uniprot reference proteome FASTA files were used from a few nematode species - C. briggsae (2/27/18; 21,725), C. elegans (6/27/18; 19,998), D. viviparus (2/26/18; 14,161), H. bacteriophora (3/13/18; 20,833), N. americanus (2/27/18; 19,125), and O. dentatum (2/26/18; 25,133). The date in parentheses denotes the last time each was modified, followed by the number of protein entries. In addition, shuffled FASTA files were created from H. sapiens and C. elegans by maintaining the tryptic cleavage sites and scrambling the intervening amino acid sequences. Seawater data and FASTA files were downloaded from the Noble lab (17). The env_nr, metagenome, and metapeptide FASTA files contained 7,003,678, 459,004, and 15,911,893 entries, respectively. Cave bear (U. deningeri) bone data was searched against a Uniprot reference proteome FASTA file from A. melanoleuca (3/13/18; 19,344) and a NCBI FASTA file from Ursus arctos horribilis (11/15/18; 35,412). Spotted ratfish (H. colliei) data was searched against a Uniprot proteome from C. milii (9/25/18; 19,344), and little skate (L. erinacea) data was also searched against C. milii, as well as a combination of sequence data for all chondrichthyes found in Uniprot and RefSeq (111,444 entries). Data from whole Asian psyllids (D. citri), was searched against two fasta files derived from Gnmon gene predictions of the D. citri genome (version 1.1) (20150806Diaphorina_citri_GeneModel_MCOTprotein.ahrd.fasta and NCBI_Gnomon_MCOT_AHRD_and_endosymbionts.fasta), where the latter also contains sequences of known endosymbionts (Candidatus Carsonella ruddii, Candidatus Profftella armaturae, and Wolbachia). These had 30,562 and 47,160 entries, respectively. DNA extracted from glacial sediments was used to make metagenome FASTA files; further details are in the supplemental section. Appended to each of these FASTA files was a list of common contaminants (https://www.thegpm.org/crap/index.html).
Database Searches
All database searches were performed with Comet using FASTA files that had been modified by appending high scoring de novo sequences. In all cases, enzymatic cleavage was semi-tryptic, allowing for up to 2 missed cleavages per peptide. This could result in matches to a partial de novo sequence or to combinations of multiple de novo sequences; however, if such matches scored higher than any FASTA-derived sequence, the latter could still be poor matches. The precursor tolerance was set to 20 ppm, and the fragment tolerance in Comet was set via a fragment bin tolerance value of 0.02 m/z units. Either iodoacetamide or methyl methanethiosulfonate were used, as appropriate (only the psyllid proteome was modified using the latter), for static modifications of cysteine. Variable modifications included oxidized methionine, acetylation of the protein N terminus, and cleavage of the protein N-terminal methionine. The concatenated decoy search option was used.
The resulting pep.xml file output from Comet was then modified using a custom Python script to deal with the observation that correct sequences derived from a FASTA file entry can sometimes have a slightly lower Comet cross-correlation score than a de novo sequence. This occurs when the two sequences are nearly identical, but a slight sequence variation allows the de novo sequence to account for one or two additional minor fragment ions. Hence, in these cases the first and second rankings need to be reversed. The differences between the first and second ranked decoy sequences were used to model this effect. The rationale for this approach is that we assume all decoy sequences are incorrect regardless of their rankings, and that the first ranked decoy has a slightly higher score because of some extra random matches. This is like when a de novo sequence score is slightly higher than a correct FASTA file sequence score. To account for the effect of peptide size on cross-correlation scores, these decoy differences were normalized to the peptide molecular weight. The suitability of this modeling is demonstrated in supplemental Fig. S1, which shows the close match between score differences. The algorithm sorts the decoy score difference (normalized by MW), and counts down through a specified percent of the list (1% is used in all cases described here) to extract a normalized score difference that can be used as a cutoff. Score differences less than that cutoff would capture 99% of the decoy score differences. Likewise, these score differences would capture about 99% of the cases when a de novo sequence scores slightly better than a target FASTA sequence.
Once the Comet pep.xml file has been modified thus, PeptideProphet (15) was used to determine the FDR where the cutoff was 0.01 in conjunction with the Comet E-value cutoff of 0.01 (the only exception being the determination of high confidence sequences for Novor score evaluations as described above).
Python 2.7 scripts were written to produce precision-recall tables for evaluating Novor results, extracting high scoring sequences produced by Novor and appending them to a FASTA file, and to manipulate Comet pep.xml files before analysis by PeptideProphet, and are available at bitbucket.org/rj8/fasta_quality.
RESULTS
Evaluation of the Novor Sequence Score
The automatic de novo sequencing program Novor produces an overall sequence score for each sequence that ranges between 0 and 100, where the higher number indicates a better match. To understand how to interpret this score, human tryptic peptides were analyzed in four ways with combinations of beam CID versus resonance CID and high versus low mass accuracy MS/MS measurements on a Thermo Fusion orbitrap mass spectrometer using DDA. For each analysis, peptides were identified using a database search (Comet followed by PeptideProphet) of a human FASTA file. The FDR and Comet E-value limits were both set at 0.001. These PSMs were assumed to be correct and were compared with the Novor-derived sequences from the same MS/MS spectra. This sounds simple enough, however, matching de novo and database sequences is not straightforward.
De novo sequences are usually not completely correct but are often partially correct. One obvious error would be because of the inability to differentiate isomeric amino acids (leucine and isoleucine). Sometimes a handful of low intensity or absent sequencing ions results in short regions of poorly defined sequence in an otherwise correct sequence. A good automated de novo sequencing program should be able to handle short regions of poorly defined sequence and still provide a partially correct sequence with a high score. In contrast, bad spectra containing insufficient fragment ions to delineate most of the sequence should receive a low score. Likewise, non-peptide tandem mass spectra (e.g. from detergent ions) generally do not result in high scoring de novo sequences. This tendency to produce partially correct de novo sequences is what makes it a challenge to compare them to database sequences, because a direct string-to-string comparison will be far too conservative. Fig. 1A illustrates a better way to make these comparisons using mass alignments (18, 19). In this mock example, the two N-terminal amino acids are reversed, which is a common mistake because of the frequent lack of sequence-defining fragment ions between the first and second amino acids. Likewise, the absence of cleavage between Ala and Gly could be construed as being because of the presence of Gln. Another example is when an adventitious fragment ion results in Gly-Gly in the de novo sequence when it is just Asn. To further illustrate the idea of mass-based alignment, Figs. 1B–D show a few actual cases where the top de novo sequences (all with scores > 60) were manually aligned with the top database hit (MS/MS spectra are shown in supplemental Fig. S2). In Fig. 1B there was very little fragmentation in the middle of the peptide, yet 75% of the amino acid masses could be aligned at the two termini. Likewise, 50% of the amino acid masses could be aligned at the termini in Fig. 1C; however, in this case, the de novo sequence mistakenly jumps between y- and b-ion series. The database sequence contains a subsequence of LLEVE, whereas the de novo sequence has this reversed. There is really no alignment in Fig. 1D, but this was a case where two peptides were co-fragmented—the database search picked out one of the peptides and Novor sequenced the other one. In fact, a BLAST search of the de novo sequence showed an exact match to a human calmodulin tryptic peptide, where Novor assigned Ala-Ala instead of carbamylated-Val at the N terminus. However, for the purposes described here, if a mass-based alignment shows that at least 70% of the peptide mass is correct, then the de novo sequence is considered “correct.”
Fig. 1.

Mass-based alignment. A, The alignment in this panel is for illustrative purposes and shows some common de novo sequencing errors. One error is the inability to delineate the two N-terminal amino acids, and in this example they are reversed. Absence of a sequencing fragment ion between the third and fourth residues (A and G) could be construed as Q in that sequence position (A and G have the same mass as Q). The reverse problem might occur in the presence of an extra ion (e.g. from a co-isolated peptide), and is illustrated by GG in the de novo sequence, when the database sequence at that position is actually N. Leucine and isoleucine usually cannot be differentiated based on mass. Finally, the combined mass of D plus L is the same as V plus E. In this mock example, the de novo sequence is quite different from the database sequence; however, a mass-based alignment suggests 100% identity. In addition to this mock alignment, real examples are shown (B–D) where the top de novo sequence was manually aligned with the top database sequence. These illustrate cases where 75%, 50%, and 9% of the amino acid masses are aligned, respectively. Labeled spectra for these alignments are shown in supplemental Fig. S2.
Novor results were compared with database search results with very low false discovery rates (<0.001), which were all considered to be correct. Data was collected from a tryptic digest of a human K562 cell lysate on a Thermo Fusion Orbitrap mass spectrometer that employed either resonance CID (occurring in the linear ion trap) or beam CID (so-called HCD), and either high or low accuracy/resolution measurements (orbitrap or linear ion trap, respectively). True positives (TP) are the number of correct de novo sequences at or above a given Novor sequence score. False positives (FP) are the number of incorrect de novo sequences at or above a given score. False negatives (FN) are the number of correct de novo sequences below a given score. It should be noted again that a “correct” de novo sequence only needs to be able to mass align 70% of the peptide molecular weight (Fig. 1A). Fig. 2A shows the number of de novo sequences whose sequence score exceeds the score necessary to result in a specified precision, and Fig. 2B shows the precision—recall curves for the same data.
Fig. 2.

Effect of mass accuracy and dissociation type on de novo sequencing using Novor. Using a human cell line tryptic digest, data was acquired on a Lumos hybrid mass spectrometer using quadrupole isolation with beam CID and orbitrap MS2, resonance CID and orbitrap MS2, resonance CID and linear ion trap MS2, or beam CID and linear ion trap MS2. Data was searched against a human FASTA file, using an FDR cutoff of 0.001 and a Comet E-value cutoff of 0.001, PSMs were assumed correct, and compared with Novor results. Panel (A) shows the number of de novo sequences versus precision, and panel (B) shows the precision-recall curve for the same data.
Novor is most successful if fragment ion masses are measured with high accuracy and resolution. The effect of activation type (resonance versus beam CID) depended on the mass accuracy—beam CID is better for high accuracy fragment mass measurement, and resonance CID is better for low accuracy. This most likely reflects the types of data used to train Novor, and not anything intrinsic to the information content of beam versus resonance CID fragmentations. Supplemental Table S1 shows the Novor scores and number of de novo sequences obtained for beam and resonance CID with accurate mass MS/MS data for a few different precision values. For example, if a precision of 0.95 is acceptable, a Novor sequence score threshold of 58 was able to recall over 91% of the correct de novo sequences when using beam CID. In this case, there were 12,342 de novo sequences out of a total of 16,062 spectra identified in a database search, of which 5% were incorrect (as defined above). Hence, a Novor sequence score threshold in the range of 60 to 70 would seem to be an appropriate choice for selecting de novo sequences for further consideration. Similarly, supplemental Table S2 shows results for linear trap MS/MS data. All subsequent data was acquired using beam CID with high mass accuracy orbitrap mass measurements of the fragment ions.
Initial Assessment of LC-MS/MS Data Using De Novo Sequencing
It can be difficult to evaluate and troubleshoot a new sample preparation method or a new type of sample, especially when there is no obvious FASTA file to search. One typically examines the general appearance of the total ion current (TIC) plot, evaluates the precursor charge states, and counts the number of tandem mass spectra triggered using DDA. Given the speed of Novor, it makes sense to also evaluate the numbers of de novo sequences before database searches, where you can learn what fraction of the MS/MS spectra are high quality peptide spectra, the precursor charge states of these spectra, and the number of unique de novo sequences that have been derived. To simulate lower quality MS/MS spectra, varying numbers of fragment ions in a LC-MS/MS file from a human tryptic digest analyzed using a Q-Exactive HF were randomized. The randomization occurred in such a manner as to maintain the appropriate mass defect by randomly adding or subtracting an integer (1 to 9) (supplemental Table S3). Even when only 5% of the fragment ions were randomized, there was a significant decrease in the number of high scoring de novo sequences. Supplemental Table S4 shows a less contrived example of different tryptic digests of Greenland glacier melt water that had been concentrated and subjected to tryptic digestion followed by LC-MS/MS. These results demonstrate the presence of thousands of high-quality peptide MS/MS spectra derived from samples that were very difficult to process and not particularly rich in protein content. At this point, one could conclude that there are many peptide MS/MS spectra present in the data, although it remains to be established how many are because of human contaminant proteins.
Method For Using Automated De Novo Sequencing to Evaluate Sequence Database Suitability
Fig. 3 shows an outline of the approach, which seeks to compare the fraction of MS/MS spectra that can be confidently matched to peptide sequences in the database to the fraction that are instead better interpreted by de novo sequencing. High scoring de novo sequences are appended into a single large bogus protein with a unique header line, e.g. “>nv 000000 NOVOR_NOVOR.” This mock protein sequence is appended to the end of the FASTA file to be tested. Next, the modified FASTA file is searched using a standard database search program, such as Comet, followed by FDR determinations using PeptideProphet. Hence, the Comet scoring scheme and FDR calculations are applied to both FASTA database sequences and any competing de novo sequences. For a given FDR, one then counts the number of de novo and database sequences to calculate the database quality.
Fig. 3.

De novo analysis of FASTA file quality. Using Novor, de novo sequences are derived for all tandem mass spectra. De novo sequences of suitably high quality are appended to create a single large protein, which is then itself appended to the FASTA file under study. A database search using Comet creates a pep.xml file output. Instances where a de novo sequence ranks slightly higher than a FASTA-derived sequence are re-ranked to put the FASTA peptide on top. PeptideProphet then establishes the FDR. The fraction of unique peptides matching the original FASTA file out of all unique sequences, including de novo sequences, represents the database quality metric.
To determine this database quality, one needs to be able to handle the incomplete sequence information present in a typical MS/MS spectrum, and to recognize when a database derived sequence and a de novo result are essentially tied (e.g. supplemental Table S5), with the tie going to the database. When is the database sequence score close enough to the de novo score to be considered a tie? To make this determination, we hypothesize that the top two decoy matches are similarly “close enough.” For all spectra that contain at least two decoys within the top 10 sequence matches, cross-correlation score differences are calculated. Because cross-correlation scores increase with the size of the peptide, these differences were normalized to molecular weight and sorted from high to low (i.e. from large differences between the two decoy scores to zero difference). To capture 100% of the instances where a correct FASTA-derived sequence is ranked second after a de novo sequence, one could use the greatest decoy difference as the cutoff. A more conservative approach would capture just a fraction of the total (e.g. 99%), where the cutoff score difference would be obtained further down the sorted list (e.g. 1% of the way down). A Python script was written that derives a score difference cutoff based on decoys, and then re-ranks FASTA-derived sequences that are within this cutoff if they are ranked second to a de novo sequence.
To test this model, high confidence PSMs from a tryptic digest of a human cell line (using FDR and Comet E-value cutoffs of 0.001) were subjected to a repeat search of the human FASTA file to which was appended the corresponding de novo sequences for those high confidence PSMs. Given the stringency of the search, it is assumed in this instance that all FASTA-derived sequences are correctly determined, and that whenever a de novo sequence has a higher score that this is because of random, adventitious, and slightly better matches with predicted fragment ions. The score difference (de novo - FASTA) is normalized to the peptide molecular weight, sorted, and plotted. From the same pep.xml file, score differences between the top two decoy hits (not necessarily top overall matches) are similarly calculated and plotted. As shown in supplemental Fig. S1, these plots are very close. Similar results were obtained using a different data set obtained from a tryptic digest of C. elegans.
The penultimate step shown in Fig. 3 employs PeptideProphet to determine error rates and probabilities using this modified pep.xml file. The number of de novo sequences that were clearly better than any alternative database sequence (again, using the cutoff derived from the top two decoys) can be ascertained by filtering for “NOVOR_NOVOR” as part of the header line of the bogus de novo protein. In this manner, the number of unique de novo sequences can be compared with the total (unique FASTA and de novo sequences combined), and the database quality metric is calculated as the final step. When the number of unique de novo sequences is low, then the database quality is high. When the number of unique de novo sequences is high, then the database quality is low. Next, we apply this method to several practical situations to evaluate what percentages might be considered high or low values.
Evaluating FASTA Files from Similar Species
Situations can arise where proteomic data are acquired for a species that lacks a complete protein sequence database (or genome). In these cases, one would search against a FASTA file from a closely related species. The question naturally arises as to whether the chosen database is close enough. The pipeline in Fig. 3 was tested by comparing searches from a variety of related and unrelated organisms. The data in Fig. 4 and supplemental Table S6 show what happens when human proteomic data is searched against various FASTA file protein sequence databases. Searching against a human database produced 19,693 unique sequences, of which 90.8% matched best to a human FASTA sequence. The remainder could be because of sequence variants and unexpected modifications. When the human database was shuffled before appending the de novo sequences, 0.4% of the unique sequences matched to the shuffled FASTA sequences. Repeating this analysis for closely related primates (chimp, gorilla, and orangutan) resulted in about 83–88% of the unique sequences matching to FASTA sequences, but this went down to 66.5% for the more distantly related primate O. garnettii. Moving away from primates, 67.9% of the unique sequences could match to house cats, and the percentages for more distantly related mammals, Tasmanian devils and platypus, went even lower to 40.1% and 49.2%, respectively. These percentages continue to drop as FASTA files from more distantly related vertebrates were searched, although all are well above the value obtained from shuffled human sequences. Even the chordate B. floridae had a respectable 8.8%, and not until human proteomic data was searched against tapeworms does the percentage approach that of a shuffled human FASTA file. Supplemental Fig. S3 and supplemental Table S7 show the results obtained when tryptic proteomic data from C. elegans is searched against FASTA files from other members of the nematode phylum. In this case, searches against an unshuffled and shuffled C. elegans FASTA file with de novo sequences appended resulted in 88.7% and 0.2%, respectively, of the unique sequences matching to the corresponding FASTA file. A comparison of Figs. 4 and supplemental Fig. S3 show that taxonomic categorization is not a reliable guide to choosing a suitably related FASTA file. The most closely related nematode, C. briggsae, is in the same genus yet only about half of the unique sequences could be assigned to this worm's FASTA file. The genome sequence variations between these two taxonomically related worms (which diverged 60 million years ago) is comparable to people versus cats (which diverged 90 million years ago). Although choosing FASTA files from the most taxonomically related organism is the best strategy in these situations, results may vary depending on the extent of sequence divergence.
Fig. 4.

Searching LC-MS/MS data from human tryptic peptides against various FASTA files. De novo sequences were appended to FASTA files from various chordates, a tape worm, and a human FASTA file that had been shuffled (keeping the original tryptic cleavage sites but shuffling intervening sequences). Using a PeptideProphet FDR of 0.01 and maximum Comet E-value of 0.01, the fraction of unique peptides that best matched to FASTA file sequences are shown.
Three applications of this technique are demonstrated using proteomic data obtained from bone fragments from the extinct cave bear (U. deningeri), a gel extracted from a spotted ratfish (H. colliei), and a gel extracted from a little skate (L. erinacea). Until recently, the giant panda (A. melanoleuca) was the species most related to cave bear for which a complete proteome was available. In this case, the search was performed with hydroxyl-proline and hydroxyl-lysine as variable modifications in addition to oxidized methionine, as collagen was expected to be a major protein component in the bone. When a Comet database search was performed on the panda FASTA file to which was appended the Novor de novo peptide sequences, 44.7% of the unique sequences matched to the FASTA sequences (Table I). Given that these bones had been sitting in a cave for many thousands of years, we hypothesized that most or all the amide side chains had hydrolyzed. The search was repeated, except that conversion of Gln to Glu and Asn to Asp were set as static modifications. Deamidation was set as a static, rather than variable, modification to avoid unnecessarily expanding the search space, given the likelihood of complete deamidation after thousands of years in a cave. The number of unique sequences attributable to the FASTA file jumped from 44.7% to 70.2%, suggesting that most of the side chain amides had indeed hydrolyzed over time. The total number of unique sequences dropped from 1518 to 1221, which is because of the inability to match to contaminant proteins when side chain deamidation is a static modification. One might also expect that most of the methionines would be oxidized, and indeed 66 out of 89 unique sequences containing methionine were identified in the oxidized form. Recently, the proteome for brown bears (Ursus arctos horribilis) became available, and using side chain deamidation as a static modification, the percentage of FASTA file derived unique sequences went up to 75.4%. This high percentage may be because various collagens are highly conserved and are major protein components of bone.
Table I. De novo analysis of various FASTA protein sequence databases. Analysis of LC-MS-MS data from cave bear bones (U. deningeri), ratfish (H. colliei) gel, little skate (L. erinacea) gel, and whole psyllids (D. citri). The columns labeled “Novor PSMs” and “Novor unique sequences” list the number of PSMs and unique sequences that matched best to de novo sequences, rather than the FASTA file sequences.
| Sample | FASTA file | Total PSMs | Total unique sequences | Novor PSMs | Novor unique sequences | Database PSMs (%) | Database unique sequences (%) |
|---|---|---|---|---|---|---|---|
| Cave bear bones (U. deningeri) | Giant Panda (A. melanoleuca) | 4166 | 1518 | 2207 | 840 | 47.0 | 44.7 |
| Cave bear bones | Giant Panda; deamidation of Asn/Gln as fixed modifications | 3833 | 1221 | 1100 | 364 | 71.3 | 70.2 |
| Cave bear bones | Brown bear (Ursus arctos horribilis); deamidation of Asn/Gln as fixed modification | 3944 | 1245 | 866 | 306 | 78.0 | 75.4 |
| Spotted ratfish gel (H. colliei) | Ghost shark (C. milii) | 3839 | 2730 | 874 | 619 | 22.8 | 22.7 |
| Little skate gel (L. erinacea) | Ghost shark (C. milii) | 32,930 | 14,624 | 28,788 | 12,551 | 12.6 | 14.2 |
| Little skate gel (L. erinacea) | All chondrichthyes | 30,143 | 13,300 | 24,574 | 10,538 | 18.5 | 20.8 |
| Psyllid (D. citri) | Psyllid (D. citri) | 13,358 | 8,779 | 5,768 | 3,835 | 56.8 | 56.3 |
| Psyllid | Psyllid plus endosymbionts | 13,037 | 8,588 | 5,352 | 3,544 | 58.9 | 58.7 |
For the spotted ratfish from the northern Pacific, the nearest relative for which a complete proteome FASTA file is available is from the Australian ghost shark (C. milii). In this analysis, 22.7% of the unique sequences were FASTA sequences (Table I). A similar experiment was performed on a different fish, little skate (L. erinacea). In this case, two FASTA files were tested - the ghost shark FASTA and a file comprised of all known sequences from chondrichthyes (jawed cartilaginous) fish. The number of unique sequences attributable to the two FASTA files were 14.2% and 20.8%, respectively. The fish data suggests that the available FASTA files are not suitable for standard database searching.
Evaluating FASTA Files for Metaproteomics
Metaproteomics involves the analysis of complex samples derived from a community of unknown species. Hence, creating and evaluating a suitable protein sequence database to search is particularly challenging (2). This typically involves assembling what are often very large non-redundant databases comprised only of proteins from possible or likely species (e.g. giant panda proteins are not likely to be in filtered seawater). Alternatively, one can perform shotgun DNA sequencing, assemble the reads into a metagenome, and translate the metagenome sequences to a metaproteome (4). The assembly of a metagenome from DNA sequence reads and subsequent translation to metaproteome can introduce errors, so May et al. (17) have introduced the concept of a metapeptide database. In this third approach, any predicted tryptic peptide of a suitable size from a simple six-frame translation of the short DNA reads become entries in the metapeptide database. May et al. compared the number of identifications made from two different seawater microbiomes (Bering Strait and the Chukchi Sea). In this study, search results from the analysis of three FASTA files were compared - a pre-existing environmental non-redundant database from NCBI (i.e. env_nr), protein sequences translated from metagenome assemblies made from DNA sequencing of each seawater sample, and the metapeptide databases derived from the same DNA sequencing data. The NCBI env_nr database is an assembly of translated nucleotide sequences obtained from large environmental sequencing projects, only some of which were marine. These FASTA files and LC-MS/MS raw files were analyzed using de novo sequence analysis (Fig. 5), which showed that the metapeptide database is, in fact, superior for both the Chukchi Sea and Bering Strait samples. The metagenome databases appeared to be comparable to the non-redundant NCBI database. These findings, where the metapeptide FASTA file is clearly superior to either the NCBI environmental database or the assembled metagenome, mirrors the claims made by May et al. (17).
Fig. 5.
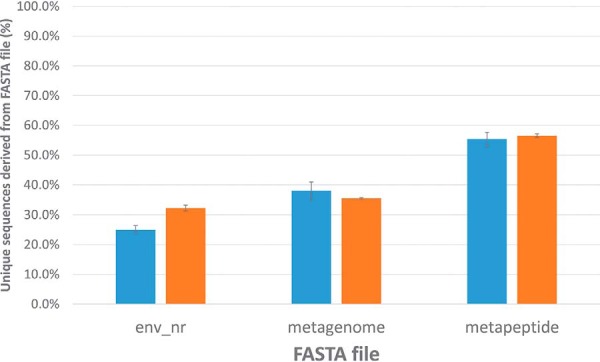
Comparison of FASTA files used to search sea water metaproteomics samples. Using the FASTA files and raw data from May et al. (17), the de novo approach was used to assess FASTA file quality. Shown are the percentages of peptide-spectrum matches (PSMs) for proteomic data obtained from the Bering Strait (blue) and the Chukchi Sea (orange). For each location, the error bars represent 3-fold standard deviation from three technical replicates when searching against location-specific metapeptide and metagenome FASTA files, plus a non-redundant environmental sequence database from NCBI (env_nr).
Studies on whole organisms provides another metaproteomics example. Asian citrus psyllids (D. citri) are insect vectors responsible for transmission of a bacterial pathogen responsible for citrus greening disease. In addition to the pathogen, psyllids also contain bacterial endosymbionts. Hence, the analysis of proteins in whole psyllid tryptic digests is a metaproteomics experiment that requires a FASTA file containing protein sequences from multiple organisms. Such a file was assembled from various sources and included insect, and pathogen sequences. Analysis of this FASTA file (Table I) showed that about 56.3% of the unique sequences could be matched to this combined FASTA file. This FASTA file was expanded to include endosymbiotic bacteria, but there was only a modest increase in the percentage of unique sequences attributable to the new FASTA file (58.7%). These FASTA files may still be missing some sequences, which is likely because the annotation of the Asian citrus psyllid genome is incomplete (20). However, the current database is adequate for metaproteomics experiments (9, 21–23).
A more challenging metaproteomics project currently under study is the analysis of Greenland glacier meltwater microbiomes. Samples were taken early, mid, and late in the melting season (i.e. summer), and melt waters coming off the glacier surface or subsurface (i.e. ice-rock interface) were collected, filtered, digested with trypsin, and analyzed by LC-MS/MS. The same samples were subjected to DNA sequencing to derive sample-specific metagenome databases for the purpose of generating protein sequence databases for mass spectrometric analysis. Table II shows the results of de novo analysis of these various FASTA files using the corresponding LC-MS/MS data. In all cases, most tandem mass spectra best matched de novo sequences, rather than proteins from translated metagenomes. Given that these samples contain so little protein, it seemed plausible that many of the tryptic peptides would be from contaminant proteins. However, these FASTA files had common contaminant sequences appended, yet the percentages associated with the FASTA file were still low.
Table II. De novo analysis of FASTA files created from metagenomes obtained from various melt water sources from a Greenland glacier. Five melt water samples obtained from early, mid, and late summer collected from either the glacier surface or subsurface (rock-ice interface).
| Melt water | Total PSMs | Total unique sequences | Novor PSMs | Novor unique sequences | Database PSMs (%) | Database unique sequences (%) |
|---|---|---|---|---|---|---|
| Surface melt; early season | 3325 | 1736 | 2371 | 1399 | 28.7 | 19.4 |
| Subsurface melt; early season | 3411 | 1623 | 1810 | 1025 | 46.9 | 36.8 |
| Subsurface melt; mid season | 4691 | 2077 | 2620 | 1483 | 44.1 | 28.6 |
| Surface melt; mid season | 4438 | 2116 | 2637 | 1456 | 40.6 | 31.2 |
| Subsurface melt; late season | 3523 | 1407 | 2369 | 1188 | 32.8 | 15.6 |
DISCUSSION
Although a commercial software package (PEAKS, Bioinformatics Solutions, Inc.) can perform rapid automated de novo sequencing, Novor is available as freeware and more easily incorporated within academic software pipelines. Moreover, Novor is fast and accurate, and provides de novo sequencing results at virtually no cost. Not surprisingly, performance is considerably better with data obtained using accurate fragment mass measurements, regardless of whether ion activation employed beam CID or resonance CID. For low mass accuracy MS/MS data, Novor seem to perform better using resonance CID. This may be because of the higher information content resulting from the frequent presence of both b- and y-type fragment ions (beam CID typically has lower intensity b-type fragments at higher mass). More likely, however, is that the low accuracy data that Novor used for model training used resonance CID rather than beam CID. Further, the model available in Novor is based on tryptic peptides, so presumably de novo sequencing of peptides derived from other proteases would give worse results. In our hands, Novor worked well on tryptic peptides where the fragment ions are measured using high accuracy analyzers, and for low accuracy analyzers using resonance CID.
For most proteome samples, evaluation of the data quality typically involves observing that the TIC trace is reasonably abundant and that many MS/MS spectra were acquired for multiply-charged precursors. It is more difficult to make an accurate initial assessment of LCMS data from unusual samples like glacial silt, where the TIC trace may not be very intense and one is not at all certain that the precursor ions are derived from peptides. A better metric for an initial evaluation of LCMS data would be an assessment of the number of MS/MS spectra for which a high scoring de novo sequence can be derived. The next step would be to verify that these peptide spectra are not simply because of keratin and trypsin autolysis, which is usually accomplished by performing a database search against a FASTA file to which has been appended sequences of common contaminant proteins. A list of common contaminant proteins is readily available, but the choice and suitability of the FASTA file to which they are appended may not be obvious.
Here we demonstrate how to use de novo sequencing results to evaluate the suitability of a chosen FASTA file - append de novo sequences to a FASTA file, perform a database search on this modified file, and then see what portion of the results match to the FASTA sequences compared with the de novo sequences. At best, spectra will match to the FASTA-derived sequences about 90% of the time but can match almost none when such FASTA sequences have been scrambled. When a species under study lacks a good FASTA file, one would typically attempt to use a taxonomically related species. For example, human peptides matched to other hominidae family members over 80% of the time, but C. elegans matched to C. briggsae about half the time. Hence, taxonomic relatedness does not guarantee success, and a metric for determining the suitability of a FASTA file is needed.
Although this technique provides a metric, it does not provide information on how to resolve a problem. Matching a low percentage of peptide MS/MS spectra to a given FASTA file can occur for a couple of reasons - the presence of modified peptides or the absence of the correct sequences in the FASTA file. Cave bear bone data did not match well to the giant panda database until the database search was performed with statically modified (i.e. deamidated) glutamine and asparagine. This illustrates one reason for having a poor match - the data itself may be from heavily modified or randomly cleaved (non-tryptic) proteolysis. For example, if the peptides were heavily carbamylated by urea, these would likely produce high scoring de novo sequences that contain sufficient sequence errors to accommodate the mass addition because of carbamylation but would not match to a FASTA-derived sequence. In the case of a proteome sample that had been lying about in a cave for thousands of years, a reasonable hypothesis that the amide side chains had been hydrolyzed could be tested. However, assuming good sample preparation technique, the most likely explanation for low FASTA matches is that the FASTA file is missing the correct sequences. The method described here provides a way to evaluate various FASTA files. For the seawater data where there were three FASTA files to evaluate—env_nr, metagenome, and metapeptide—it was found that the latter was the better choice. Likewise, the brown bear FASTA file was better than the giant panda FASTA file for analyzing the cave bear data, and the FASTA file containing all known jawed cartilaginous fish sequences was better than the FASTA file that only contained ghost shark sequences for analyzing little skate samples. In contrast, the additional sequences added to the FASTA file for analyzing the psyllid data made only a modest improvement, underscoring the importance of high-quality genome annotations for the development of proteomic databases.
Not addressed here is the question of what to do with the cases where the de novo sequences are clearly better than any FASTA-derived sequence. As just described, these are due either to novel sequences or modified peptides (including unexpected proteolysis). One option is to perform homology-based searches (e.g. BLAST) using the de novo sequences; however, given that de novo sequences are usually not completely correct (Fig. 1), such homology searches ideally would be modified to take these sequencing errors into account. CIDentify (18) and OpenSea (19) were two of the early attempts, where the general approach is to match short stretches of de novo sequences before performing mass-based alignments in the surrounding region of sequences. However, these two computer programs are either unavailable or too slow given the volume of data nowadays. PEAKS provides a commercial solution, but this requires a monetary outlay that might be prohibitive. This topic is worth revisiting, given the availability and capabilities of Novor. A second option might employ an open modification search strategy to try to identify these novel sequences or modified peptides (24), and a third option would be to perform a search using an extended FASTA database (25).
Finally, this approach for evaluating FASTA files can also be used on data independent acquisition (DIA) data. One would simply run Novor on the pseudo-MS/MS spectra produced by the DIA-Umpire signal extraction module (26) and proceed in the same manner described here (27).
DATA AVAILABILITY
The mass spectrometry proteomics data have been deposited to the ProteomeXchange Consortium (28) via the PRIDE (29) partner repository with the dataset identifier PXD015083 and 10.6019/PXD015083 (https://www.ebi.ac.uk/pride/archive/).
Supplementary Material
Acknowledgments
We thank Bin Ma for his assistance in using Novor. We also thank Richard E. Green for providing the cave bear bone sample.
Footnotes
* This study was supported by P41 GM103533 and R01 GM121696 to M.J.M. The authors declare that they have no conflicts of interest with the contents of this article.
 This article contains supplemental material.
1 The abbreviations used are:
- MS/MS
- tandem mass spectrometry
- CID
- collision induced dissociation
- ABC
- ammonium bicarbonate
- DDA
- data dependent acquisition
- PSM
- peptide-spectrum match
- FDR
- false discovery rate
- TP
- true positive
- FP
- false positive
- FN
- false negative
- TIC
- total ion current
- DIA
- data independent acquisition.
REFERENCES
- 1. Eng J. K., Searle B. C., Clauser K. R., and Tabb D. L. (2011) A face in the crowd: recognizing peptides through database search. Mol. Cell. Proteomics 10, 1–9 [DOI] [PMC free article] [PubMed] [Google Scholar]
- 2. Timmins-Schiffman E., May D. H., Mikan M., Riffle M., Frazar C., Harvey H. R., Noble W. S., and Nunn B. L. (2017) Critical decisions in metaproteomics: Achieving high confidence protein annotations in a sea of unknowns. ISME J. 11, 309–314 [DOI] [PMC free article] [PubMed] [Google Scholar]
- 3. Cilia M., Tamborindeguy C., Rolland M., Howe K., Thannhauser T. W., and Gray S. (2011) Tangible benefits of the aphid Acyrthosiphon pisum genome sequencing for aphid proteomics: Enhancements in protein identification and data validation for homology-based proteomics. J. Insect Physiol. 57, 179–190 [DOI] [PubMed] [Google Scholar]
- 4. Ruggles K. V., Krug K., Wang X., Clauser K. R., Wang J., Payne S. H., Fenyo D., Zhang B., and Mani D. R. (2017) Methods, tools and current perspectives in proteogenomics. Mol. Cell. Proteomics 16, 959–981 [DOI] [PMC free article] [PubMed] [Google Scholar]
- 5. Ma B., and Johnson R. (2012) De novo sequencing and homology searching. Mol. Cell. Proteomics 11, 1–16 [DOI] [PMC free article] [PubMed] [Google Scholar]
- 6. Ma B. (2015) Novor: Real-time peptide de novo sequencing software. J. Am. Soc. Mass Spectrom. 26, 1885–1894 [DOI] [PMC free article] [PubMed] [Google Scholar]
- 7. Taylor J. A., and Johnson R. S. (2001) Implementation and uses of automated de novo peptide sequencing by tandem mass spectrometry. Anal. Chem. 73, 2594–2604 [DOI] [PubMed] [Google Scholar]
- 8. Merrihew G. E., Davis C., Ewing B., Williams G., Käll L., Frewen B. E., Noble W. S., Green P., Thomas J. H., and MacCoss M. J. (2008) Use of shotgun proteomics for the identification, confirmation, and correction of C. elegans gene annotations. Genome Res. 18, 1660–1669 [DOI] [PMC free article] [PubMed] [Google Scholar]
- 9. Ramsey J. S., Johnson R. S., Hoki J. S., Kruse A., Mahoney J., Hilf M. E., Hunter W. B., Hall D. G., Schroeder F. C., MacCoss M. J., and Cilia M. (2015) Metabolic interplay between the asian citrus psyllid and its profftella symbiont: An achilles' heel of the citrus greening insect vector. PLoS ONE 10, 1–21 [DOI] [PMC free article] [PubMed] [Google Scholar]
- 10. Bon C., Caudy N., de Dieuleveult M., Fosse P., Philippe M., Maksud F., Beraud-Colomb E., Bouzaid E., Kefi R., Laugier C., Rousseau B., Casane D., van der Plicht J., and Elalouf J. M. (2008) Deciphering the complete mitochondrial genome and phylogeny of the extinct cave bear in the Paleolithic painted cave of Chauvet. Proc. Natl. Acad. Sci. 105, 17447–17452 [DOI] [PMC free article] [PubMed] [Google Scholar]
- 11. Noonan J. P., Hofreiter M., Smith D., Priest J. R., Rohland N., Rabeder G., Krause J., Detter J. C., Pääbo S., and Rubin E. M. (2005) Genomic sequencing of Pleistocene cave bears. Science 309, 597–599 [DOI] [PubMed] [Google Scholar]
- 12. Dabney J., Knapp M., Glocke I., Gansauge M.-T., Weihmann A., Nickel B., Valdiosera C., Garcia N., Paabo S., Arsuaga J.-L., and Meyer M. (2013) Complete mitochondrial genome sequence of a Middle Pleistocene cave bear reconstructed from ultrashort DNA fragments. Proc. Natl. Acad. Sci. 110, 15758–15763 [DOI] [PMC free article] [PubMed] [Google Scholar]
- 13. Chambers M. C., Maclean B., Burke R., Amodei D., Ruderman D. L., Neumann S., Gatto L., Fischer B., Pratt B., Egertson J., Hoff K., Kessner D., Tasman N., Shulman N., Frewen B., Baker T. a., Brusniak M.-Y., Paulse C., Creasy D., Flashner L., Kani K., Moulding C., Seymour S. L., Nuwaysir L. M., Lefebvre B., Kuhlmann F., Roark J., Rainer P., Detlev S., Hemenway T., Huhmer A., Langridge J., Connolly B., Chadick T., Holly K., Eckels J., Deutsch E. W., Moritz R. L., Katz J. E., Agus D. B., Maccoss M. J., Tabb D. L., and Mallick P. (2012) A cross-platform toolkit for mass spectrometry and proteomics. Nat. Biotechnol. 30, 918–920 [DOI] [PMC free article] [PubMed] [Google Scholar]
- 14. Eng J. K., Jahan T. a., and Hoopmann M. R. (2012) Comet: an open source tandem mass spectrometry sequence database search tool. Proteomics 13, 1–3 [DOI] [PubMed] [Google Scholar]
- 15. Keller A., Nesvizhskii A. I., Kolker E., and Aebersold R. (2002) Empirical statistical model to estimate the accuracy of peptide identifications made by MS/MS and database search. Anal. Chem. 74, 5383–5392 [DOI] [PubMed] [Google Scholar]
- 16. Deutsch E. W., Mendoza L., Shteynberg D., Farrah T., Lam H., Sun Z., Nilsson E., Pratt B., Prazen B., Eng J. K., Daniel B., Nesvizhskii A. I., and Aebersold R. (2010) A guided tour of the trans-proteomic pipeline Tasman8. Proteomics 10, 1150–1159 [DOI] [PMC free article] [PubMed] [Google Scholar]
- 17. May D. H., Timmins-Schiffman E., Mikan M. P., Harvey H. R., Borenstein E., Nunn B. L., and Noble W. S. (2016) An alignment-free “metapeptide” strategy for metaproteomic characterization of microbiome samples using shotgun metagenomic sequencing. J. Proteome Res. 15, 2697–2705 [DOI] [PMC free article] [PubMed] [Google Scholar]
- 18. Taylor J. A., and Johnson R. S. (1997) Sequence database searches via de novo peptide sequencing by tandem mass spectrometry. Rapid Commun. Mass Spectrom. 11, 1067–1075 [DOI] [PubMed] [Google Scholar]
- 19. Searle B. C., Dasari S., Turner M., Reddy A. P., Choi D., Wilmarth P. A., McCormack A. L., David L. L., and Nagalla S. R. (2004) High-throughput identification of proteins and unanticipated sequence modifications using a mass-based alignment algorithm for MS/MS de novo sequencing results. Anal. Chem. 76, 2220–2230 [DOI] [PubMed] [Google Scholar]
- 20. Saha S., Hosmani P. S., Villalobos-Ayala K., Miller S., Shippy T., Flores M., Rosendale A., Cordola C., Bell T., Mann H., DeAvila G., DeAvila D., Moore Z., Buller K., Ciolkevich K., Nandyal S., Mahoney R., Van Voorhis J., Dunlevy M., Farrow D., Hunter D., Morgan T., Shore K., Guzman V., Izsak A., Dixon D. E., Cridge A., Cano L., Cao X., Jiang H., Leng N., Johnson S., Cantarel B. L., Richards S., English A., Shatters R. G., Childers C., Chen M. J., Hunter W., Cilia M., Mueller L. A., Munoz-Torres M., Nelson D., Poelchau M. F., Benoit J. B., Wiersma-Koch H., D'Elia T., and Brown S. J. (2017) Improved annotation of the insect vector of citrus greening disease: biocuration by a diverse genomics community. Database 2017, 1–20 [DOI] [PMC free article] [PubMed] [Google Scholar]
- 21. Ramsey J. S., Chavez J. D., Johnson R., Hosseinzadeh S., Mahoney J. E., Mohr J. P., Robison F., Zhong X., Hall D. G., MacCoss M. J., Bruce J., and Cilia M. (2017) Protein interaction networks at the host–microbe interface in Diaphorina citri, the insect vector of the citrus greening pathogen. R. Soc. Open Sci. 4, 160545. [DOI] [PMC free article] [PubMed] [Google Scholar]
- 22. Kruse A., Ramsey J. S., Johnson R., Hall D. G., MacCoss M. J., and Heck M. (2018) Candidatus liberibacter asiaticus minimally alters expression of immunity and metabolism proteins in hemolymph of Diaphorina citri, the insect vector of Huanglongbing. J. Proteome Res. 17, 2995–3011 [DOI] [PubMed] [Google Scholar]
- 23. Kruse A., Fattah-Hosseini S., Saha S., Johnson R., Warwick E. R., Sturgeon K., Mueller L., Maccoss M. J., Shatters R. G., and Heck M. C. (2017) Combining'omics and microscopy to visualize interactions between the Asian citrus psyllid vector and the Huanglongbing pathogen Candidatus Liberibacter asiaticus in the insect gut. PLoS ONE 12, 1–28 [DOI] [PMC free article] [PubMed] [Google Scholar]
- 24. Kong A. T., Leprevost F. V., Avtonomov D. M., Mellacheruvu D., and Nesvizhskii A. I. (2017) MSFragger: Ultrafast and comprehensive peptide identification in mass spectrometry-based proteomics. Nat. Methods 14, 513–520 [DOI] [PMC free article] [PubMed] [Google Scholar]
- 25. Binz P. A., Shofstahl J., Vizcaíno J. A., Barsnes H., Chalkley R. J., Menschaert G., Alpi E., Clauser K., Eng J. K., Lane L., Seymour S. L., Sánchez L. F. H., Mayer G., Eisenacher M., Perez-Riverol Y., Kapp E. A., Mendoza L., Baker P. R., Collins A., Van Den Bossche T., and Deutsch E. W. (2019) Proteomics standards initiative extended FASTA format. J. Proteome Res. 18, 2686–2692 [DOI] [PMC free article] [PubMed] [Google Scholar]
- 26. Tsou C.-C., Avtonomov D., Larsen B., Tucholska M., Choi H., Gingras A.-C., and Nesvizhskii A. I. (2015) DIA-Umpire: comprehensive computational framework for data-independent acquisition proteomics. Nat. Methods 12, 258–264 [DOI] [PMC free article] [PubMed] [Google Scholar]
- 27. Johnson R. S., Searle B., Keller A., and MacCoss M. J. (June 4–8, 2017) De novo DIA Analysis (DDA). In Proceedings of the 65th ASMS Conference on Mass Spectrometry and Allied Topics, Indianapolis, Indiana [Google Scholar]
- 28. Deutsch E. W., Csordas A., Sun Z., Jarnuczak A., Perez-Riverol Y., Ternent T., Campbell D. S., Bernal-Llinares M., Okuda S., Kawano S., Moritz R. L., Carver J. J., Wang M., Ishihama Y., Bandeira N., Hermjakob H., and Vizcaíno J. A. (2017) The ProteomeXchange consortium in 2017: Supporting the cultural change in proteomics public data deposition. Nucleic Acids Res. 45, D1100–D1106 [DOI] [PMC free article] [PubMed] [Google Scholar]
- 29. Perez-Riverol Y., Csordas A., Bai J., Bernal-Llinares M., Hewapathirana S., Kundu D. J., Inuganti A., Griss J., Mayer G., Eisenacher M., Pérez E., Uszkoreit J., Pfeuffer J., Sachsenberg T., Yilmaz Ş Tiwary. S, Cox J., Audain E., Walzer M., Jarnuczak A. F., Ternent T., Brazma A., and Vizcaíno J. A. (2019) The PRIDE database and related tools and resources in 2019: Improving support for quantification data. Nucleic Acids Res. 47, D442–D450 [DOI] [PMC free article] [PubMed] [Google Scholar]
Associated Data
This section collects any data citations, data availability statements, or supplementary materials included in this article.
Supplementary Materials
Data Availability Statement
The mass spectrometry proteomics data have been deposited to the ProteomeXchange Consortium (28) via the PRIDE (29) partner repository with the dataset identifier PXD015083 and 10.6019/PXD015083 (https://www.ebi.ac.uk/pride/archive/).