Abstract
We investigate how isotopic labeling of the enzyme lactate dehydrogenase (LDH) affects its function. LDH is of special interest because there exists a line of residues spanning the protein that are involved in the transition state (TS) of the chemical reaction coordinate (so-called promoting vibration). Hence, studies have been carried out on this protein (as well as others) using labeled protein (so-called heavy protein) along with measurements of single turnover kcat yielding a KIE (=kcatlight/kcatheavy) aimed at understanding the effect of labeling generally and more specifically this line of residues. Here, it is shown that 13C, 15N, and 2H atom labeling of hhLDH (human heart) affects its internal structure which in turn affects its dynamics and catalytic mechanism. Spectral studies employing advanced FTIR difference spectroscopy show that the height of the electronic potential surface of the TS is lowered (probably by ground state destabilization) by labeling. Moreover, laserinduced T-jump relaxation kinetic spectroscopy shows that the microsecond to millisecond nuclear motions internal to the protein are affected by labeling. While the effects are small, they are sufficient to contribute to the observed KIE values as well or even more than promoting vibration effects.
Graphical Abstract
INTRODUCTION
An outstanding and important issue in understanding enzymatic catalysis is how atomic motions within the protein–ligand complex affect function. Recently, the expression and purification of “heavy enzymes”, where some or all amino acids are labeled with isotopes like 13C, 15N, and 2H, was devised by the Schramm lab1–8 to study how the mass-induced changes to protein dynamics affect enzyme catalysis. Measurements often entail a determination of kcat (single turnover to capture the chemical event as much as possible) of the light enzyme and that of the heavy enzyme, thereby determining the induced kinetic isotope effect (KIE = kcatlight/kcatheavy). Any differences in the reaction rate between light and heavy enzymes are due to mass-induced changes in enzyme motions and structure, ranging from fs bond vibrations to ms protein domain movements. In this report, we characterize how isotopic labeling affects protein dynamics in LDH.
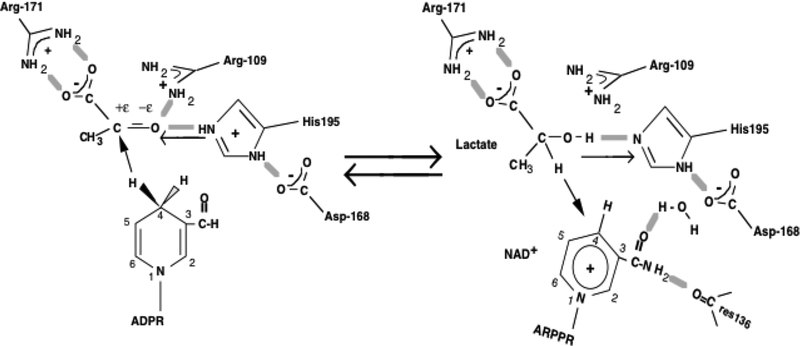
Heavy and light forms of human heart LDH (hhLDH) were investigated via studies involving H/D primary isotope effects (where the hydride transfer NADH hydrogen is stereospecifically labeled with a deuteron; see Figure 1) as well as the solvent isotope effects on kcat.7 LDH is of special interest, since it has been established that a line of protein residues spanning across the enzyme participate in its TS coordinate.8,9 This provides a ca. 50–200 cm−1 (i.e., fs time scale) “squeezing” motion, bringing the two interacting molecules closer together at the TS to carry the system from substrate side to product side.9,10 Since the enzymic mechanism of LDH involves the tight packing of substrates at the active site,11 it is expected that such a squeezing motion affects catalysis in LDH. The fs motion has been termed a “promoting vibration” for obvious reasons. It is also expected that isotopic labeling of the protein would result in a small change in the frequency of the promoting vibration. Single turnover measurement of kcat involving contrasting light and heavy protein found a small light vs heavy KIE in single turnover kcat studies of 1.05 (pH 5.8) for the pyruvate to lactate direction.
Figure 1.
Active site contacts of pyruvate and NADH (left) and lactate and NAD+ (right) bound to LDH with key residues as determined by X-ray crystallography. The chemical reaction catalyzed by LDH from the pyruvate side involves a concerted hydride transfer from NADH to the carbonyl carbon of pyruvate and a proton transfer from a protonated, conserved His residue to the carbonyl oxygen of pyruvate. The arrows indicate hydride or proton transfer as appropriate.
However, there are two other mechanisms other than the fs promoting vibration that could contribute to the measured KIE in LDH. Labeling of the protein could affect the electronic structure of the transition state by changing the barrier height. Pyruvate’s C=O stretch is sensitive to the electric fields at the active site (Figure 1), which contribute to the barrier energy. The C=O stretch can be determined employing isotope difference IR spectroscopy; hence, the barrier height can be appraised. Second, microsecond to millisecond atomic motions within the protein may be modulated by protein isotope substitution. Previously, we developed a comprehensive kinetic model12 for the microsecond to millisecond steps that contribute to the value for LDH’s kcat. Many of these steps can be determined by T-jump relaxation spectroscopy, as developed in our lab. Hence, this factor can be assessed also.
We find that all three mechanisms contribute to the recently measured KIE of heavy versus light hLDH. This result is broadly in accord with the conclusions of ref 7 based on single turnover kcat studies.
MATERIALS AND METHODS
The preparation of both light and heavy forms of human heart (hh) LDH followed the protocol previously described by Wang and colleagues with one minor exception.2 The isotopically labeled hhLDH sample used in the present study was prepared in M63 minimal media in D2O supplemented with [U–13C6H7]glucose and [15N]NH4Cl. Measurement of total mass by ESI mass spectrometry of the labeled protein yielded a mass of 40748 au. This value is very close to the previously reported mass of 40807 au for the hhLDH sample prepared in the M63 D2O media supplemented with [U–13C6D7]glucose and [15N]NH4Cl.7 Hence, our labeled hhLDH sample used in the present study, having a mass difference of less than 0.15%, is nearly identical to the sample prepared by Wang and colleagues and thus is termed heavy hhLDH herein.7 The reason for the mass difference is that the glucose media used to prepare the protein hhLDH was not deuterated, i.e., [U–13C6H7], while Wang et al. employed deuterated glucose [U–13C6D7]. All of the samples used herein were suspended in D2O, while those of Wang et al. were suspended in H2O; hence, the mass difference is essentially due to differences in nonexchangeable protons.
A Nicolet Magna 760 Fourier transform spectrometer was used to obtain FTIR spectra. Samples having 13C2- and 12C2 oxamate were loaded in two IR cells with CaF2 windows and 15 μm Teflon spacers at room temperature. The typical concentration of the enzyme was 4 mN (i.e., 4 mM active sites) with a stoichiometric amount of NADH and oxamate. A difference spectrum is formed whereby the background IR spectra are nulled, leaving positive and negative going IR peaks for any vibrational mode that is frequency shifted by the label. The procedures for isolating isotope edited difference spectra are found in ref 13.
Absorption and fluorescence changes of NADH upon T-jump were recorded on our home-built spectrometer. A detailed setup and procedure could be found in these papers.14,15 In the measurements, the sample was loaded into quartz cuvettes. The light beam for monitoring absorption changes and also for exciting the fluorescence, with a 2 mW incident power in a 10 nm fwhm band centered at a wavelength of 365 nm, was produced by the Black-LED-365 light source (Prizmatix, Southfield, MI), collimated and sharply (~0.7 mm diameter) focused in the center of the heated spot of the sample. The transmitted light was directed to a silicon PIN photodiode (Thorlabs, Newton, NJ) to record absorption changes at the given wavelength. On the other hand, fluorescence from NADH was passed through a 458 nm narrow-band filter with a bandwidth of 40 nm fwhm and detected by a photomultiplier detector (Andover, Salem, NH).16
RESULTS
It is difficult to study enzyme complexes with true bound substrates, and more often than not use is made of substrate mimics. For LDH, an excellent mimic for the substrate pyruvate is oxamate. Nevertheless, we have found that ternary complexes containing oxamate differ modestly in their dynamical behavior from those containing the true substrate pyruvate. As it turns out, it is possible to study the Michaelis complex for many mammalian isozymes of LDH. The reaction of pyruvate with NADH to lactate and NAD+ at neutral pH heavily favors the lactate direction. However, the on enzyme internal equilibrium constant for many mammalian LDHs is close to 1.
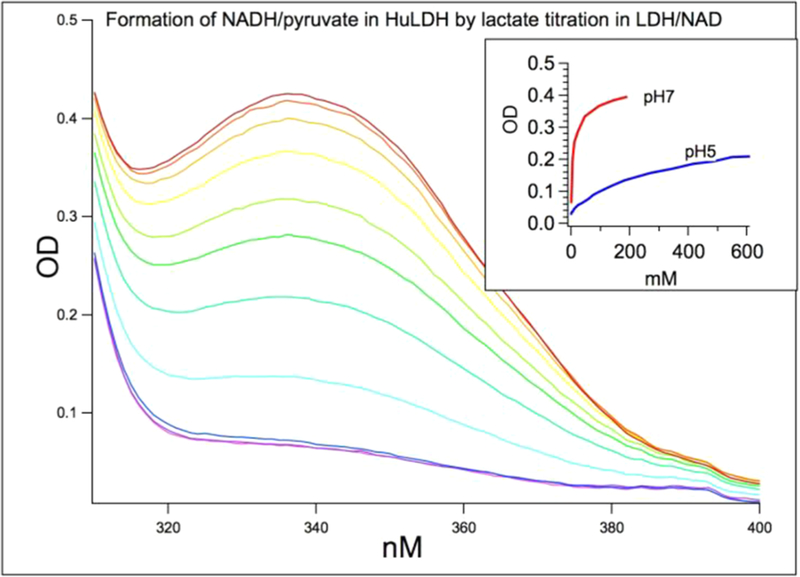
Hence, large lactate concentrations can overcome the enthalpic component of the equilibrium, which favors the lactate side, and will drive the reaction toward pyruvate and NADH. By lactate titration with hhLDH·NAD at pH 7 and pH 5 (Figure 2), using NADH absorbance at 335 nm as the monitor for hhLDH·NADH·pyruvate formation, it is determined that ~35–40% of bound NAD are in the NADH form at pH 7 starting around 80 mM lactate (but only 10–15% are in the NADH form at pH 5). Thus, there is sufficient concentration of the pyruvate Michaelis complex to study pyruvate’s C2=O bond polarization by IR at pH 7.
Figure 2.
By lactate titration with hhLDH and NAD at pH 7 and pH 5, using NADH absorbance at 335 nm as the monitor for hhLDH· NADH·pyruvate ternary complex formation. Shown is the lactate titration at pH 7 from 5 to 191 mM. About 35–40% of bound NAD is in the NADH form at pH 7 when 80 mM lactate is reached. Only 10–15% are in the NADH form at pH 5. Thus, we are only able to study pyruvate C2=O bond polarization in the pyruvate side of the Michaelis complex by IR at pH 7. The initial concentrations of hhLDH and NAD+ were 7 mM each. High enzyme and cofactor concentrations ensure that NADH species are bound within the ternary complex.
IR Difference Spectroscopy Structural Studies.
We are interested in the C2=O stretch of pyruvate bound within the LDH·NADH·pyruvate complex. The spectrum of this vibrational mode can be isolated by employing isotope edited IR difference spectroscopy. The IR spectra of LDH·NADH·[12C2=O]pyruvate and separately LDH·NADH·[13C=O]-pyruvate are taken and differenced. In this way, the background IR spectra, protein modes for example, subtract out and the resulting difference spectrum contains just modes that have been tagged by the 13C2 isotope, chiefly the C2=O stretch. The subtraction must be performed with very high precision; the procedures employed in our difference spectrometer are detailed in ref 17.
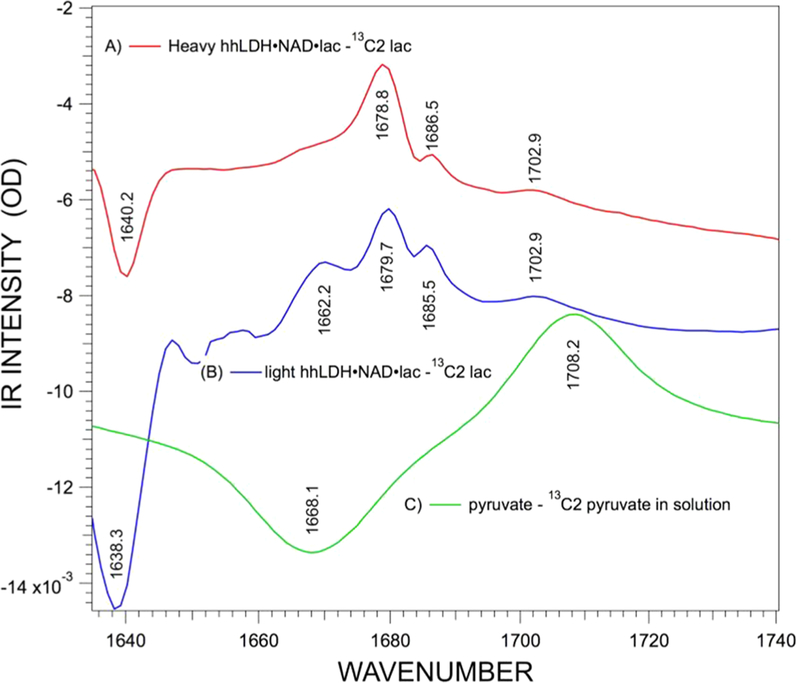
Figure 3 shows the IR difference spectra of human heart LDH and its heavy analogue. The positive bands are from 12C2 pyruvate, and the negative bands are from 13C2 pyruvate. The dominant spectral feature for light and heavy hhLDH is a heterogeneously broadened 12C=O stretch band at, respectively, 1679.7 and 1678.8 cm−1. The 13C2 tag results in a ca. 40 cm−1 downward shift of the C=O stretch and is evident in the figure with negative going bands at 1638.3 cm−1 (light) and 1640.2 cm−1 (heavy). Comparing the protein-bound spectra to the solution spectra of pyruvate, the electrostatic interactions at the active site with the C=O bond downshift the stretch frequency some 28.5 cm−1 (from 1708.2 to 1679.7 cm−1).
Figure 3.
Difference IR spectra of [12C]pyruvate minus [13C]pyruvate in (A) heavy hhLDH·NADH·pyruvate, (B) light hhLDH·NADH· pyruvate, and (C) pyruvate in solution. The starting concentrations of the reactants, enzyme, NAD, and lactate in parts A and B, were 7:7:80 mM. The prominent peak in the difference spectrum (panel B) of light protein at 1662 cm−1 is a subtraction artifact, since (1) its relative intensity varies from run to run while the other bands do not and (2) the band is not present in the heavy protein spectrum. See also the Supporting Information. The protein background spectrum of nonlabeled (light) protein rapidly increases at this point but is downshifted for the labeled (heavy) protein.
We have shown in a study of phLDH that the phLDH·NADH·pyruvate Michaelis complex consists of an ensemble of multiple substates, as each C2=O IR band represents a metastable substate population (see ref 18). The present IR result for hhLDH is much the same as that found in the phLDH protein studies. This is expected, since the active site arrangements of residues are the same. Multiple pyruvate conformations having varying C2=O stretch frequencies lie within the heterogeneously broadened bands at ca. 1679.7 and 1678.8 cm−1. This was shown for phLDH by careful curve fitting. Moreover, varying kinetic responses of C2=O identified species were found due to a rapid T-jump over the broad band with kinetics determined by single frequency IR absorbance changes. Careful kinetic studies showed that the substrates do not interconvert directly among each other but rather through an intermediate protein conformation(s) on the microsecond time scale.12,19 As shown below, the kinetic behavior of the hhLDH Michaelis complex differs somewhat compared to phLDH.
An unusual feature of the difference spectrum of Figure 3 is the peak at 1685.5 cm−1 in the light hhLDH·NADH·pyruvate spectrum; there is a virtually identical band in the pig heart spectrum. Careful analysis shows that this is NOT solely an isolated C2=O stretch.18 Strong interactions between pyruvate and NADH in the Michaelis complex result in mode coupling between pyruvate C2=O (1680 cm−1) and a ring mode of the nicotinamide group of NADH (1685 cm−1) even without a covalent bond between them. The coupling likely comes about from dipole–dipole interactions. Labeling of C2 in pyruvate shifts the C2=O stretch by ca. 40 cm−1 but, very interestingly, also shifts the NADH ring mode by ca. 1 cm−1. Hence, the 12C2=O stretch shows up near 1680 cm−1 in the difference spectrum, while the ring mode shows up at 1686 cm−1 in the 13C2 difference spectrum. This coupling is weakened by 13C/15N/D2O hhLDH protein labeling, as shown by the reduced intensity of the 1685 cm−1 band. The prominent peak in the difference spectrum (Figure 3B) of light protein at 1662 cm−1 is a subtraction artifact, as shown in the Supporting Information.
Labeling hhLDH with 13C/15N/D2O results in small but reproducible changes in the isotope edited spectra of Figure 3. The major 12C=O stretch at 1679.7 cm−1 shifts down 0.9 cm−1 to 1678.8 cm−1 in [13C/15N/D2O]hhLDH. The NADH ring mode shifts up from 1685.5 cm−1 (light) to 1686.5 cm−1 (heavy). Moreover, the ring mode loses some modest, but quite reproducible, relative intensity in the [13C/15N/D2O]hhLDH spectrum. The major 13C=O stretch at 1638.3 cm−1 shifts up 0.9 cm−1 to 1640.2 cm−1 in [13C/15N/D2O]hhLDH protein. There is no shift in the weak band 1708.9 cm−1. This band is due to a small percentage (ca. 5–10%) of pyruvate bound to LDH·NADH at a site removed from the active site.18 It is thereby weakly bound, showing only a small polarization of the 12C=O stretch and concomitant down shift compared to the that found in the solution spectrum.
Pyruvate’s C2=O stretch frequency shift upon pyruvate binding to LDH has been shown to be quantitatively correlated to its reactivity in the LDH catalyzed reaction.20 This is understood on physical grounds. The transition state of the LDH·NADH·pyruvate to LDH·NAD+·lactate conversion is essentially an enolate of the bound substrate. Pyruvate forms strong H-bonds with active site charged residues (see Figure 1), and these electrostatic bonds lower the ground state C2= O stretch in the Michaelis complex. This in turn brings the ternary complex structure closer to the transition state structure, which either stabilizes the transition state or destabilizes the ground state. Either way, this brings about an increase rate in the chemical event. The IR data for the human heart Michaelis complex C2=O stretch in Figure 3 consists of multiple conformations each with a somewhat different catalytic efficacy; this result is quite similar to that found for the pig heart isozyme.18
Due to pyruvate 12C2=O stretch and NADH ring mode coupling, the 13C2=O bands are best used to determine the degree of polarization of the pyruvate C2=O bond in the Michaelis complex and the heavy enzyme isotope effect on this bond polarization. The pyruvate 13C2=O stretch shifts from its solution value by 30 (1668–1638) cm−1 and 28 (1668–1640) cm−1, respectively, in the Michaelis complexes formed with light and heavy LDH. Hence, we can conclude that the TS electronic energy profile is slightly affected by protein labeling. There is an empirical relationship between hydride transfer rate and C=O stretch.20 The relationship given here varies somewhat from that given in ref 20, since we have used only data where the C=O stretch has been downshifted using isotope substitution, thus minimizing the coupling between the C=O moiety stretch and the NADH ring stretch. This yields
where ΔνC=O is the downward shift in C=O stretch from solution in cm−1 and kcat is in s−1. It is easily observed from Figure 3 that the C=O stretch is considerably downshifted comparing pyruvate bound in the Michaelis complex compared to its solution value (from 1708 to 1679 cm−1 for 12C=O stretch).
The basis21 for this relationship is that the stretch frequency is determined by electrostatic interaction between the C=O moiety and surrounding charged and polar residues. Based on this correlation, the heavy-enzyme-induced pyruvate 13C2=O frequency shift of 2 cm−1 would corresponding to a heavyenzyme-induced KIE of 1.37 (37%) which is somewhat larger than the 5–11% HE-KIEs in the pH range observed between 4.3 and 5.8 by single turnover measurements.7 Importantly, this simple calculation shows that the effect of the active site interactions on the electrostatic potential surface is substantial.
Laser-Induced T-Jump Kinetic Studies.
Fast kinetic studies can be performed using relaxation spectroscopy.22 For the experiments here, hhLDH·NADH·pyruvate and hhLDH·NAD+·lactate equilibrium conditions similar to those employed for the IR difference studies above were utilized. In brief, the solution is irradiated with a laser-generated pulse of near IR light at a wavelength that is absorbed by weak water bands. This rapidly, within 100 ns, increases the temperature of the irradiated water by 8–15 °C. The changes in chemical species of the sample are measured as the system comes to a new equilibrium. Measuring the absorption of NADH, a monitor of the total concentration of NADH in its various complexes, and NADH fluorescence was employed to determine the dynamics of the chemical species. Because of the high concentrations of cofactor and protein, there is very little contribution to the signals from transients involving binding of free NADH to LDH and LDH·NADH binding pyruvate.23
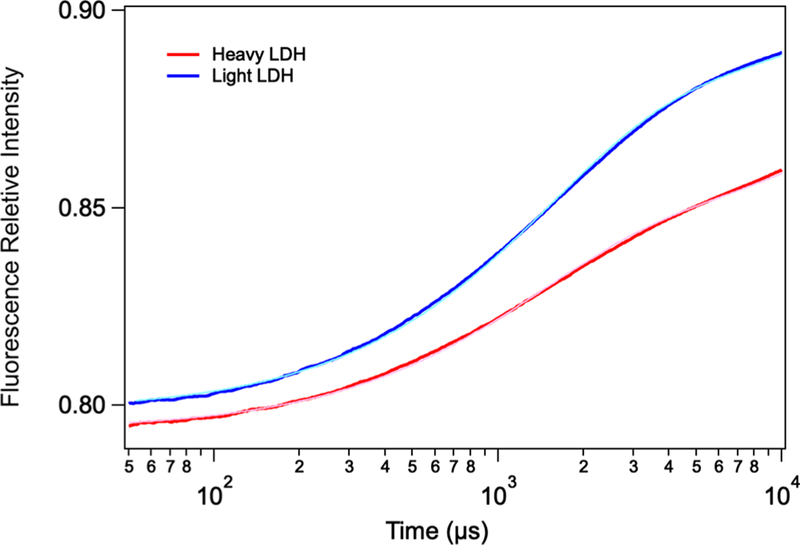
Figure 4 shows the transients from NADH fluorescence taken at a final temperature of 32 °C. NADH fluorescence is affected by two factors. One is that the conversion of LDH· NADH·pyruvate to LDH·NAD+·lactate, or the on-enzyme catalysis, decreases NADH fluorescence. The second is that NADH fluorescence is strongly quenched in the ternary LDH· NADH·pyruvate complex due to electron transfer between NADH and pyruvate that takes place in the active site.24 Hence, the rising intensity of the transient fluorescence is interpreted as pyruvate leaving the tightly packed active site pocket, migrating to a still bound but more remote site.19 The rising transient is fit to a single exponential of 7.1 × 10² and 7.7 × 10² s−1 for light and heavy protein, respectively.
Figure 4.
Kinetics NADH fluorescence of the hhLDH·NADH· pyruvate system described above subjected to a T-jump of about 10 °C and a final temperature of 33 °C. The blue trace corresponds to light hhLDH, while the red trace corresponds to heavy hhLDH. The starting concentration of the reactants, enzyme, NAD+, and lactate, were 0.4:0.4:500 mM. The light blue and pink curves, overlaid almost completely on the experimental curves, are the results of least-squares fits employing a single-exponential function. A second exponential accounting for sample cooling was included in the fit function and fixed at 142 s−1 (7 ms). The rising transient is fit to a single exponential of 7.1 × 10² and 7.7 × 10² s−1 for light and heavy protein, respectively.
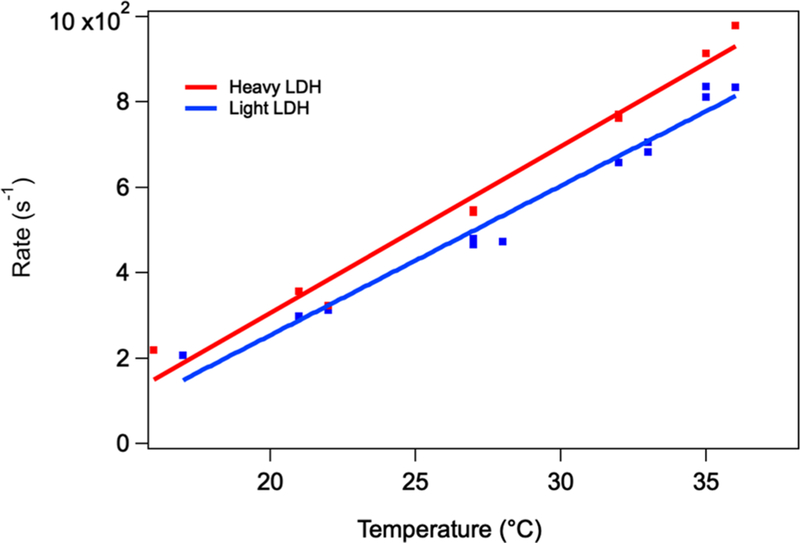
Figure 5 shows the temperature dependence of the heavy and light rates; the dependences are fit to a linear function to aid in error analysis. The heavy enzyme data is consistently somewhat higher than the data from the light protein which would yield a KIE (rates of light over heavy) less than 1. The kinetic data shows quite high signal-to-noise ratio, as seen in Figure 4, and the values of the rates from the fits are very accurate (±0.35%). However, Figure 5 makes it clear that repeatability is less accurate, as can be observed by the small scatter in Figure 5. Taking the scatter as error, the root mean square deviation in the data is calculated to be ±14%. At 32 °C then, KIE = 0.86 (±0.12).
Figure 5.
Temperature dependence of the heavy and light hhLDH rates as measured in studies like Figure 4. The dependences are fit to a linear function to aid in error analysis. The slope and intercept for heavy LDH are 39 ± 2.3 μs−1/°C and −47 ± 6.5 °C; for light LDH, they are 35 ± 1.7 μs−1/°C and −45 ± 4.8 °C, respectively.
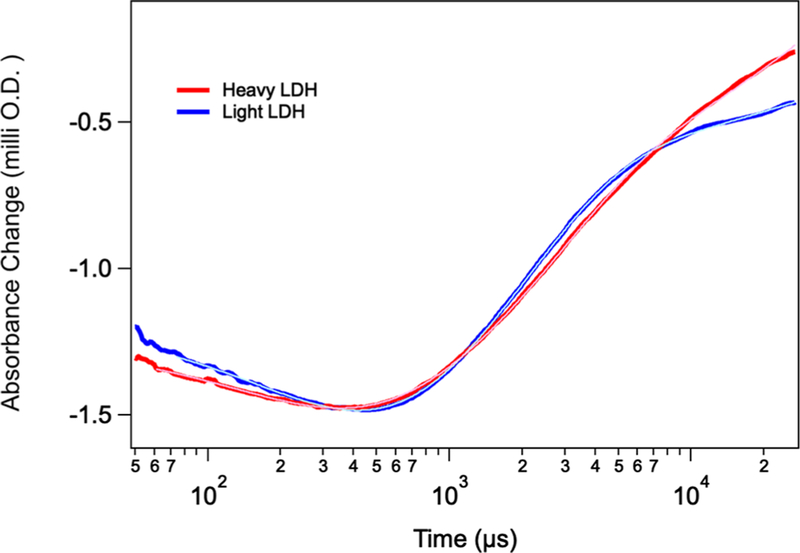
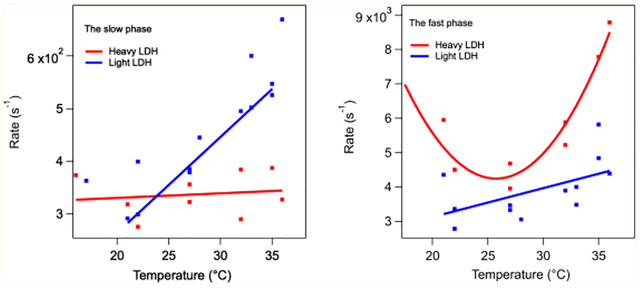
Figure 6 shows the kinetics of NADH absorption as the system relaxes to a final temperature of 32 °C. The kinetics are clearly biexponential: a fast phase at 9.3 × 10³ s−1 and a slow phase at 4.3 × 10² s−1 for light hhLDH. The heavy LDH samples show similar transients at 1.2 × 10⁴ and 3.1 × 10² s−1. The absorption of NADH centered at 340 nm is little affected by whether NADH is complexed as a ternary or binary complex or whether it is in solution (the very large majority consists of the ternary complex under the conditions used here). Hence, the absorption changes monitor the total NADH concentration. An increase in temperature results first in a relatively fast slight decrease at 9.3 × 10³ s−1 for the light sample in total NADH concentration and then a slower but larger amplitude increase at 4.3 × 10² s−1. The slow phase is close to the single turnover kcat for this protein.7 The overall results are similar to those found for phLDH except the fast phase showed an increase in absorption with time.19,25 We have found in previous studies that the LDH·NADH·pyruvate complex consists of multiple species interconverting among each other. This gives rise to multiple pathways to the on-enzyme chemistry. In Figure 6, the optical absorption probe of NADH clearly yields two pathways. Both events are indicative of on-enzyme catalysis taking place with the slow phase resulting in an increase of LDH·NADH·pyruvate and the fast phase indicating loss.
Figure 6.
NADH absorption kinetics of the hhLDH·NADH·pyruvate system described above subjected to a T-jump of about 10 °C and a final temperature of 33 °C. The blue trace corresponds to light hhLDH, while the red trace corresponds to heavy hhLDH. Both the light and heavy data show a fairly strong artifact due to cavitation below 50 μs and thus are not shown. The small transient near 7 ms, especially in the light data, is due to thermal cooling of the sample. The light blue and pink curves, almost completely overlaid on the blue and red curves, respectively, are the results of least-squares fits employing a triple-exponential function, in which one exponent that was due to the cooling effect within the pump laser interaction volume was fixed (142 s−1; 7 ms) by experimental controls. Both kinetic responses are thus well fit by a double exponential: 9.3 × 10³ and 1.2 × 10⁴ s−1 for light versus heavy, respectively, and 4.3 × 10² versus 3.1 × 10² s−1 (light vs heavy). The starting concentrations of the reactants, enzyme, NAD+, and lactate, were 0.4:0.4:500 mM.
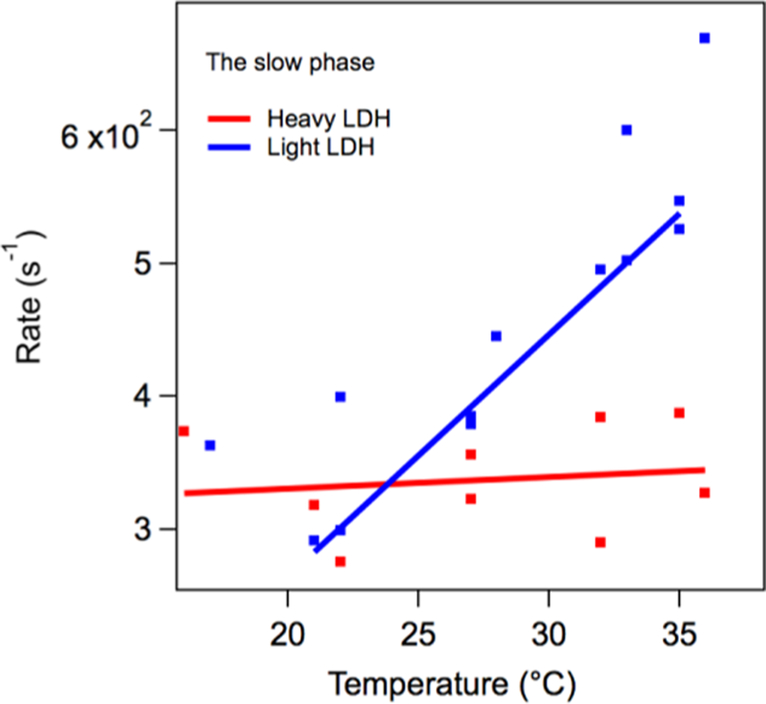
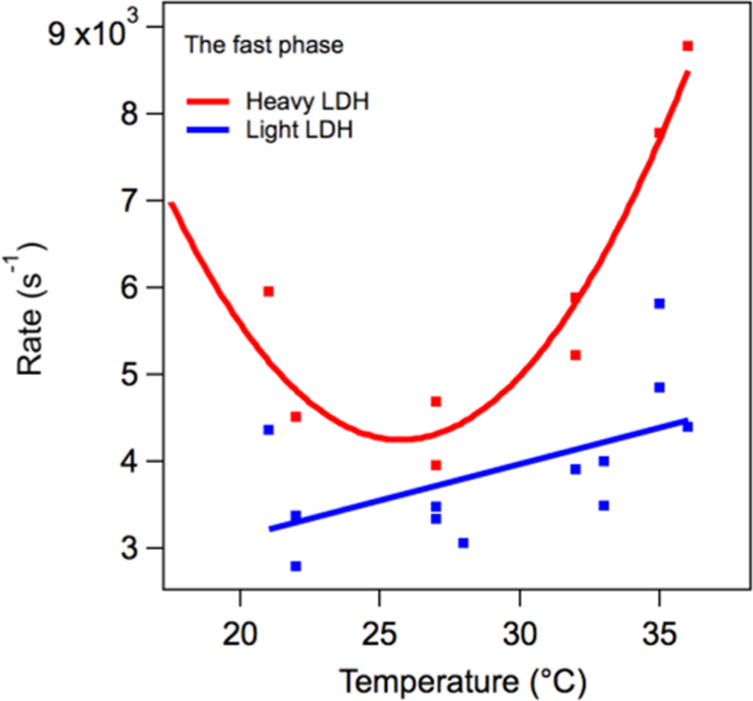
Figure 7 shows the temperature dependence of the relatively slow phase heavy and light rates derived from a series of kinetic studies, as shown in Figure 6. In this case, there is a very clear difference between the heavy and light rates. The heavy samples show a near temperature independent rate, while the light enzyme has a strong temperature dependence. At 32 °C, the measured KIE for the slow rate is KIE = 5.0 × 10²/3.1 × 102 = 1.6 (±30%) with the error estimated from the scatter in the plot. Figure 8 shows the temperature dependence of the relatively fast rate derived from a series of kinetic studies like that of Figure 6. At 32 °C, the measured KIE for the fast rate is 3.9 × 10³/5.9 × 103 = 0.66 (±30%). The shape of the curve for LDH in Figure 8 is surprising. We speculate that this is brought about by the balance of hydrophobic/hydrophilic forces (see refs 23 and 28).
Figure 7.
Temperature dependence of the slow phase in the NADH absorption kinetics of the hhLDH·NADH·pyruvate system described above subjected to a T-jump of about 10 °C. KIE = 1.6 (±30%) at 32 °C.
Figure 8.
Temperature dependence of the “fast” phase in the NADH absorption kinetics of the hhLDH·NADH·pyruvate system described above subjected to a T-jump of about 10 °C. The KIE, light rate divided by heavy rate, for the fast rate is 3.9 × 10³/5.9 × 103 (s−1) = 0.66 (±30%) at 32 °C.
DISCUSSION
The catalytic attributes of so-called “heavy enzymes” are increasingly being used as a structural tool to understand enzyme mechanism. The isotopic labeling of enzymes, the most extreme case being all 13C, 15N, and 2H atom labeling, has been shown to affect catalytic rates. In this paper, we focus on how protein isotopic labeling affects the catalytic mechanism in LDH. LDH is of special interest, since it has been established that a line of protein residues spanning across the enzyme participate in its TS coordinate.8,9 This provides a ca. 50–200 cm−1 (i.e., fs time scale) “squeezing” motion bringing the two interacting molecules closer together at the TS to carry the system from the substrate side to the product side.9,10 However, there are two other mechanisms other than the fs promoting vibration that could contribute to the measured KIE in LDH. We investigate changes in relatively slow (microsecond to millisecond) motions important to on-enzyme chemistry brought about by protein labeling. For LDH, we have shown that microsecond to millisecond motions within the LDH Michaelis complex contribute to the value of its single turnover kcat.12,19 Another factor is whether or not the energy surface of the TS is affected by labeling of protein. In some analyses, the electronic potential surface of the TS is assumed to be unaffected by protein labeling so that light and heavy protein have the same electronic potential surface and the same TS barrier. This is a standard assumption in considering how isotopic substitution affects vibrational frequencies. However, the C=O stretch of bound pyruvate varies between light and heavy protein, as shown in the difference IR spectra of Figure 3 (most cleanly monitored by pyruvate’s 13C=O stretch). This is strong evidence that the TS potential surface barrier is affected by labeling, at least for all 13C, 15N, and 2H atom labeling.
The Schramm group studied the human heart LDH catalytic properties via single turnover measurement of kcat contrasting light and heavy protein.7 They found a small pH dependent kinetic isotope effect of 1.05 (pH 5.8) to 1.11 (pH 4.3) for the pyruvate to lactate direction. One important issue is whether the single turnover measurements reveal the chemical step. Generally, the values of single turnover kcat for mammalian LDHs are dominated by relatively slow (microsecond to millisecond) internal motions of the protein within the Michaelis complex and thus mask the rate of the chemical step, in some cases completely dominating it.
Previously, we developed a detailed kinetic mechanism for phLDH at pH 7.2.12,18,19 Simulations of stopped flow studies based on our kinetic model show that a single turnover study of phLDH, which is very close in structure and mechanism to hhLDH, yields a primary H/D (labeling of C4 of NADH by a deuterium) isotope of about 1.6, compared to around 6 expected of a pure hydride transfer event. The discrepancy is due to internal motions masking the chemical event. Given the kinetic complexity of the reaction pathway in LDH which our studies reveal, this approach to revealing how much of kcat is due to kchem is substantially more accurate than the usual method of deriving “commitment factors” that are dependent on a kinetic model in any case. The overall conclusion from the hhLDH study comparing primary isotope effects with the solvent isotope effect on the light and heavy proteins was that the observed KIE was probably the result of slow protein motions set up by fast fs to ps motions.7 Our studies expand upon all of these ideas in more detail, as discussed herein.
Much of the catalytic mechanism of LDH is well laid out. Perhaps most surprising is its kinetic complexity and dynamical disorder.11,12 It has long been known that protein structure consists of a vast array, or ensemble, of conformational substates. These substates differ in both the positions of the atoms within each member of the ensemble as well as their essential dynamics. It has been established that each substate (as defined by a different C=O stretch of bound pyruvate) within the Michaelis complex of LDH has specific functional differences from the others.12 In addition, the collection of substates can exhibit different dynamics, interconverting among themselves on a broad range of time scales (from picoseconds to minutes or longer). For LDH, we have shown that three aspects of the Michaelis complex are needed to describe its mechanism: (1) the distribution of substates, (2) the interconversion dynamics among the substates, and (3) the propensity toward catalysis of each substate.11,25 For example, the C=O stretch of pyruvate bound within the LDH·NADH· pyruvate Michaelis complex is heterogeneously broadened (see, e.g., Figure 3 and discussion) consisting of several conformations with each having a somewhat different stretch frequency.18 It has been shown that each conformation associated with a specific C=O stretch undergoes on-enzyme chemistry with a different rate.12
Quite some time ago, Holbrook et al.26,27 showed that the kinetic scheme for LDH catalysis is complicated (see, e.g., Figure 6). Our recent work developed a kinetic model that is more intricate than Holbrook’s but is the simplest one in agreement with all available data.12,19 To briefly summarize our model, after the binding of the pyruvate substrate to the LDH· NADH, the complex undergoes a stochastic hunt though phase space, leading to conformations that can undergo efficient chemistry and, from there, to the actual on-enzyme chemical event. The ligand is shuttled to the active site via first forming a weakly bound enzyme·ligand complex, probably consisting of several heterogeneous species. This encounter complex (ensemble of complexes) undergoes numerous conformational changes that shuttle the enzyme·substrate complex to a range of conformations where the substrate is tightly bound.16
It has been shown that the structure and/or dynamics of LDH’s substate ensemble can be modulated by osmolytes (i.e., urea and TMAO) which in turn results in different kcat and/or Km.28 Thermal adaptation of LDH thermophiles (from psychrophilics to mesophiles to extreme thermophiles) involves tuning the dynamical properties of the substate ensemble,25 which tunes kcat and Km as appropriate. Most recently, we found that temperature affects the profile and architecture of the phLDH substate population, tuning both kcat and Km.28 The slow protein motions that contribute to kcat differ in kind from 20 °C to physiological temperature (37 °C).
The results herein show that the profile of hhLDH substate structure and dynamics are dependent on mass labeling of the protein. The C=O stretch frequency of bound pyruvate within hhLDH·NADH·pyruvate shows a difference in frequency comparing heavy and light hhLDH (Figure 3). Moreover, the internal dynamics are also dependent on the isotope composition of the protein and lead to functional differences. This is clearly shown in the T-jump studies of the Michaelis complex measuring NADH absorption (Figure 6). These studies measure in part the kinetics of the on-enzyme conversion from the pyruvate side to the lactate side.12,19 Figures 7 and 8 show the rates depend on protein isotope composition, particularly at temperatures closer to physiological. Clearly, mass labeling of hhLDH affects the profile of its ensemble of interconverting protein substates.
The makeup of the TS of LDHs consists largely of two factors.11,29–31 One is electrostatic interactions between the bound substrate and surrounding polar protein residues, chiefly between pyruvate’s C=O moiety and active site polar protein residues, e.g., His195 and Arg109 (see Figure 1). The other major structural factor is that the protein binding brings the two interacting substrates, NADH and pyruvate, in very close proximity and with correct alignment of key bonds for hydride transfer. Stronger active site packing of light protein compared to heavy at the active site is observed in the data of Figure 3. The ground state stretch frequency of pyruvate’s C=O bond is a sensitive monitor of its electrostatic environment. For LDH, the electrostatics at the active site bring about a significant downshift in the C=O stretch.20 In turn, catalysis rates are affected by this electrostatic environment.20,21,31 The size of the interaction is determined by the packing at the active site, and this shows up in the C=O stretch frequency with larger interactions yielding a larger downward shift in the stretch. Analysis of this suggests that a larger downward shift of the C=O stretch is concomitant with a smaller TS barrier, probably mostly through destabilizing the ground state.20,32 The intensity variation between light versus heavy of the NADH ring mode at ca. 1685 cm−1 is consistent with this. Packing at the active site for light protein is tighter than heavy protein, shown both by C=O stretch and the NADH ring mode.
CONCLUSION
Our results show that all 13C, 15N, and 2H atom labeling of hhLDH affects its internal structure which in turn affects its dynamics and kinetic mechanism. Our results allow some semiquantitative and qualitative discussion of accounting for a measured KIE (=kcatlight/kcatheavy) arising from labeling of protein nuclear coordinates. It is clear from the results that the active site arrangement of substrate and key residues is modified by protein labeling. In other words, labeling affects protein packing. The effect is fairly small but has sizable effects on kcat given the exponential dependence of kcat on the TS energy barrier. This factor alone is sufficient to account for the measured value of the KIE in kcat, as discussed in the Results. Part of the packing almost certainly comes about from the line of residues through the protein that are part of the TS coordinate that yield a “squeezing” motion on the substrates referred to as the promoting vibration. The motion has a frequency of about 200 cm−1 in the light protein and has therefore been called a promoting vibration, given that it should promote on-enzyme chemistry.9,10 It seems that this line of residues should also be viewed as a “promoting structure” in part responsible for the packing at the active site.31
The labeling also affects microsecond to millisecond internal motions in the protein. Figure 7 shows the temperature dependence of the “slow” phase in the T-jump kinetics of NADH absorption kinetics of the hhLDH·NADH·pyruvate system. The kinetics of this transient represents the millisecond protein motion most coupled to single turnover measurements of kcat. At low temperature (ca. 20 °C), there is substantial scatter in the data, the average exhibiting very little contribution to light vs heavy KIE. The scatter makes it difficult to come to a definitive conclusion. However, there is much less scatter at physiological temperature, and there is a clear KIE of about 1.6 at 32 °C. Hence, the results suggest that the structure of the protein is modified by labeling away from the active site also in such a way that affects these important slower motions. Therefore, this factor would also contribute to a noticeable KIE in kcat at physiological temperature if not lower (temperature dependence was not performed in ref 7).
It is perhaps not unexpected that the internal structure of LDH is affected by 13C, 15N, and 2H atom labeling. The folded structure of proteins is known to be determined by a large number of small interactions between molecular groups. The heavy protein labeling could well affect the overall free energy of a folded protein through small disruptions to many of these interactions.
Supplementary Material
ACKNOWLEDGMENTS
This work was supported by a grant from the National Institutes of Health General Medical Sciences 5P01GM068036. Research by E.C. reported in this publication was supported in part by the National Institute of General Medical Sciences of the National Institutes of Health, K12GM1102779. The content is solely the responsibility of the authors and does not necessarily represent the official views of the National Institutes of Health.
Footnotes
Supporting Information
The Supporting Information is available free of charge on the ACS Publications website at DOI: 10.1021/acs.jpcb.9b08656.
A brief description of the methods for accurate subtraction of two IR spectra, resolution, and band assignments (PDF)
The authors declare no competing financial interest.
REFERENCES
- (1).Schwartz SD; Schramm V Enzymatic Transition States and Dynamic Motion in Barrier Crossing. Nat. Chem. Biol 2009, 5, 551–558. [DOI] [PMC free article] [PubMed] [Google Scholar]
- (2).Kipp DR; Silva R; Schramm VL Mass-dependent Bond Vibrational Dynamics Influence Catalysis by HIV-1 Protease. J. Am. Chem. Soc 2011, 133, 19358–61. [DOI] [PMC free article] [PubMed] [Google Scholar]
- (3).Silva RG; Murkin AS; Schramm VL Femtosecond Dynamics Coupled to Chemical Barrier Crossing in a BornOppenheimer Enzyme. Proc. Natl. Acad. Sci. U. S. A 2011, 108, 18661–18665. [DOI] [PMC free article] [PubMed] [Google Scholar]
- (4).Antoniou D; Ge X; Schramm VL; Schwartz SD Mass Modulation of Protein Dynamics Associated with Barrier Crossing in Purine Nucleoside Phosphorylase. J. Phys. Chem. Lett 2012, 3, 3538–3544. [DOI] [PMC free article] [PubMed] [Google Scholar]
- (5).Wang Z; Singh P; Czekster CM; Kohen A; Schramm BVL Protein Mass-Modulated Effects in the Catalytic Mechanism of Dihydrofolate Reductase: Beyond Promoting Vibrations. J. Am. Chem. Soc 2014, 136, 8333–8341. [DOI] [PMC free article] [PubMed] [Google Scholar]
- (6).Suarez J; Schramm VL Isotope-specific and Amino Acidspecific Heavy Atom Substitutions Alter Barrier Crossing in Human Purine Nucleoside Phosphorylase. Proc. Natl. Acad. Sci. U. S. A 2015, 112, 11247–11251. [DOI] [PMC free article] [PubMed] [Google Scholar]
- (7).Wang Z; Chang EP; Schramm VL Triple Isotope Effects Support Concerted Hydride and Proton Transfer and Promoting Vibrations inHuman Heart Lactate Dehydrogenase. J. Am. Chem. Soc 2016, 138, 15004–15010. [DOI] [PMC free article] [PubMed] [Google Scholar]
- (8).Schramm VL; Schwartz SD Promoting Vibrations and the Function of Enzymes. Emerging Theoretical and Experimental Convergence. Biochemistry 2018, 57, 3299–3308. [DOI] [PMC free article] [PubMed] [Google Scholar]
- (9).Basner JE; Schwartz SD Donor-Acceptor Distance and Protein Promoting Vibration Coupling to Hydride Transfer: A possible Mechanism for Kinetic Control in Isozymes of Human Lactate Dehydrogenase. J. Phys. Chem. B 2004, 108, 444–451. [Google Scholar]
- (10).Basner JE; Schwartz SD How Enzyme Dynamics Helps Catalyze a Chemical Reaction in Atomic Detail: A Transition Path Sampling Study. J. Am. Chem. Soc 2005, 127, 13822–13831. [DOI] [PubMed] [Google Scholar]
- (11).Callender R; Dyer RB The Dynamical Nature of Enzymatic Catalysis. Acc. Chem. Res 2015, 48, 407–413. [DOI] [PMC free article] [PubMed] [Google Scholar]
- (12).Reddish M; Peng H-L; Deng H; Panwar KS; Callender R; Dyer RB Direct Evidence of Catalytic Heterogeneity in Lactate Dehydrogenase by Temperature Jump Infrared Spectroscopy. J. Phys. Chem. B 2014, 118, 10854–10862. [DOI] [PMC free article] [PubMed] [Google Scholar]
- (13).Deng H; Brewer SH; Vu DV; Clinch K; Callender R; Dyer RB On the Pathway of Forming Enzymatically Productive Ligand-Protein Complexes in Lactate Dehydrogenase. Biophys. J 2008, 95, 804–813. [DOI] [PMC free article] [PubMed] [Google Scholar]
- (14).Zhadin N; Gulotta M; Callender R Probing the Role of Dynamics in Hydride Transfer Catalyzed by Lactate Dehydrogenase. Biophys. J 2008, 95, 1974–1984. [DOI] [PMC free article] [PubMed] [Google Scholar]
- (15).Callender RH; Dyer RB Advances in Time-Resolved Approaches to Characterize the Dynamical Nature of Enzymatic Catalysis. Chem. Rev 2006, 106, 3031–3042. [DOI] [PubMed] [Google Scholar]
- (16).Nie B; Deng H; Desamero R; Callender R Large Scale Dynamics of the Michaelis Complex of B. Stearothermophilus Lactate Dehydrogenase revealed by Single Tryptophan Mutants Study. Biochemistry 2013, 52, 1886–1892. [DOI] [PMC free article] [PubMed] [Google Scholar]
- (17).Deng H; Vu DV; Clinch K; Desamero R; Dyer RB; Callender R Conformational heterogeneity within the Michaelis complex of lactate dehydrogenase. J. Phys. Chem. B 2011, 115, 7670–6778. [DOI] [PMC free article] [PubMed] [Google Scholar]
- (18).Peng H-L; Deng H; Dyer RB; Callender R The Energy Landscape of the Michaelis Complex of Lactate Dehydrogenase: Relationship to Catalytic Mechanism. Biochemistry 2014, 53, 1849–1857. [DOI] [PMC free article] [PubMed] [Google Scholar]
- (19).Reddish M; Callender RH; Dyer RB Resolution of Submillisecond Kinetics of Multiple Reaction Pathways for Lactate Dehydrogenase. Biophys. J 2017, 112 (9), 1852–1862. [DOI] [PMC free article] [PubMed] [Google Scholar]
- (20).Deng H; Zheng J; Clarke A; Holbrook JJ; Callender R; Burgner JW Source of Catalysis in the Lactate Dehydrogenase System: Ground State Interactions in the Enzyme·Substrate Complex. Biochemistry 1994, 33, 2297–2305. [DOI] [PubMed] [Google Scholar]
- (21).Fried SD; Boxer SG Electric Fields and Enzyme Catalysis. Annu. Rev. Biochem 2017, 86, 387–415. [DOI] [PMC free article] [PubMed] [Google Scholar]
- (22).Callender R; Dyer RB Protein Dynamics: Time-Resolved Spectroscopic Studies In Encyclopedia of Biophysics; Roberts GCK, Ed.; Springer-Verlag: Berlin, Heidelberg, 2012; pp 2007–2014; DOI: 10.1007/978-3-642-16712-6. [DOI] [Google Scholar]
- (23).Qiu L; Gulotta M; Callender R Lactate Dehydrogenase Undergoes a Substantial Structural Change to Bind its Substrate. Biophys. J 2007, 93, 1677–1686. [DOI] [PMC free article] [PubMed] [Google Scholar]
- (24).Peng H-L; Callender RH Mechanism for Fluorescence Quenching of Tryptophan by Oxamate and Pyruvate: Conjugation and Solvation In-duced Photoinduced Electron Transfer. J. Phys. Chem. B 2018, 122, 6483–6490. [DOI] [PMC free article] [PubMed] [Google Scholar]
- (25).Peng H-L; Egawa T; Chang E; Deng H; Callender RH Mechanisms of Thermal Adaptation in the Lactate Dehydrogenases. J. Phys. Chem. B 2015, 119, 15256–15262. [DOI] [PMC free article] [PubMed] [Google Scholar]
- (26).Parker DM; Jeckel D; Holbrook JJ Slow structural changes shown by the 3-nitrotyrosine-237 Residue in Pig Heart[Try(3NO2)237] Lactate Dehydrogenase. Biochem. J 1982, 201, 465–471. [DOI] [PMC free article] [PubMed] [Google Scholar]
- (27).Clarke AR; Waldman ADB; Hart KW; Holbrook JJ The Rates of Defined Changes in Protein Structure During the Catalytic Cycle of Lactate Dehydrogenase. Biochim. Biophys. Acta, Protein Struct. Mol. Enzymol 1985, 829, 397–407. [DOI] [PubMed] [Google Scholar]
- (28).Khrapunov S; Chang E; Callender RH Thermodynamic and Structural Adaptation Differences between Mesophilic and Psychrophilic Lactate Dehydrogenases. Biochemistry 2017, 56, 3587–3595. [DOI] [PMC free article] [PubMed] [Google Scholar]
- (29).Holbrook JJ; Liljas A; Steindel SJ; Rossmann MG Lactate Dehydrogenase In The Enzymes, 3rd ed.; Boyer PD, Ed.; Academic Press: New York, 1975; pp 191–293. [Google Scholar]
- (30).Burgner JW; Ray WJ On the Origin of Lactate Dehydrogenase Induced Rate Effect. Biochemistry 1984, 23, 3636–3648. [DOI] [PubMed] [Google Scholar]
- (31).Zoi I; Antoniou D; Schwartz SD Electric Fields and Fast Protein Dynamics in Enzymes. J. Phys. Chem. Lett 2017, 8, 6165–6170. [DOI] [PMC free article] [PubMed] [Google Scholar]
- (32).Cheng H; Nikolic-Hughes I; Wang JHW; Deng H; O’Brian PJ; Wu L; Zhang Z-Y; Herschlag D; Callender R Environmental Effects on Phosphoryl Group Bonding Probed by Vibrational Spectroscopy: Implications for Understanding Phosphoryl Transfer and Enzymatic Catalysis. J. Am. Chem. Soc 2002, 124, 11295–11306. [DOI] [PubMed] [Google Scholar]
Associated Data
This section collects any data citations, data availability statements, or supplementary materials included in this article.


