Abstract
Pancreatic ductal adenocarcinoma (PDAC) shows great cellular heterogeneity, with pronounced epithelial and mesenchymal cancer cell populations. However, the cellular hierarchy underlying PDAC cell diversity is unknown. Here we identify the tetraspanin CD9 as a marker of PDAC tumour-initiating cells. CD9high cells had increased organoid formation capability, and generated tumour grafts in vivo at limiting dilutions. Tumours initiated from CD9high cells recapitulated the cellular heterogeneity of primary PDAC, whereas CD9low cells only produced duct-like epithelial progeny. CD9 knockdown decreased the growth of PDAC organoids, and heterozygous CD9 deletion in Pdx1-Cre; LSL-KRasG12D; p53F/F mice prolonged overall survival. Mechanistically, CD9 promoted the plasma membrane localisation of the glutamine transporter ASCT2, enhancing glutamine uptake in PDAC cells. Thus, our study identifies a PDAC subpopulation capable of initiating PDAC and giving rise to PDAC heterogeneity, suggesting that the cellular diversity of PDAC is generated by PDAC stem cell differentiation.
Pancreatic ductal adenocarcinoma (PDAC) is the fourth most common cause of cancer-related deaths in the US1, with even resectable tumours conferring a five-year survival rate of only 30%2. Cancer cell heterogeneity is believed to be one of the main causes of tumour aggressiveness and resistance to therapy3; therefore, understanding the sources of intratumoural PDAC diversity is a key aim.
Differentially tumourigenic cell subpopulations have been proposed to originate PDAC heterogeneity4; however, these subpopulations are still poorly characterised. Tumour cells with enhanced proliferative capacity, metastatic potential, resistance to therapy, and the ability to generate cellular heterogeneity are classified as tumour-initiating cells (TICs) or cancer stem cells (CSCs)5. Although TICs are functionally distinct from the tumour bulk, their identification is hampered by the need for specific markers that can be used for isolation and clinical targeting. Various CSC markers have been proposed for PDAC6–11, but a CSC population that can recapitulate PDAC cellular heterogeneity has not been identified.
Here, we identify and characterise a TIC population in PDAC marked by high cell surface levels of the tetraspanin CD9. CD9 is amplified in almost 10% of human PDAC samples and high CD9 expression correlates with poorer survival. By prospective isolation of CD9-expressing PDAC cells, we demonstrate that CD9 identifies TICs that re-initiate tumour formation and recapitulate the cellular heterogeneity of primary PDAC. Knockdown and overexpression experiments revealed that CD9 not only marks TICs, but also promotes PDAC development. Mechanistically, we show that CD9 expression augments glutamine uptake by interacting with, and increasing the cell surface expression of, the glutamine transporter ASCT2, thereby enhancing PDAC growth.
Results
Identification of potential TIC markers in PDAC
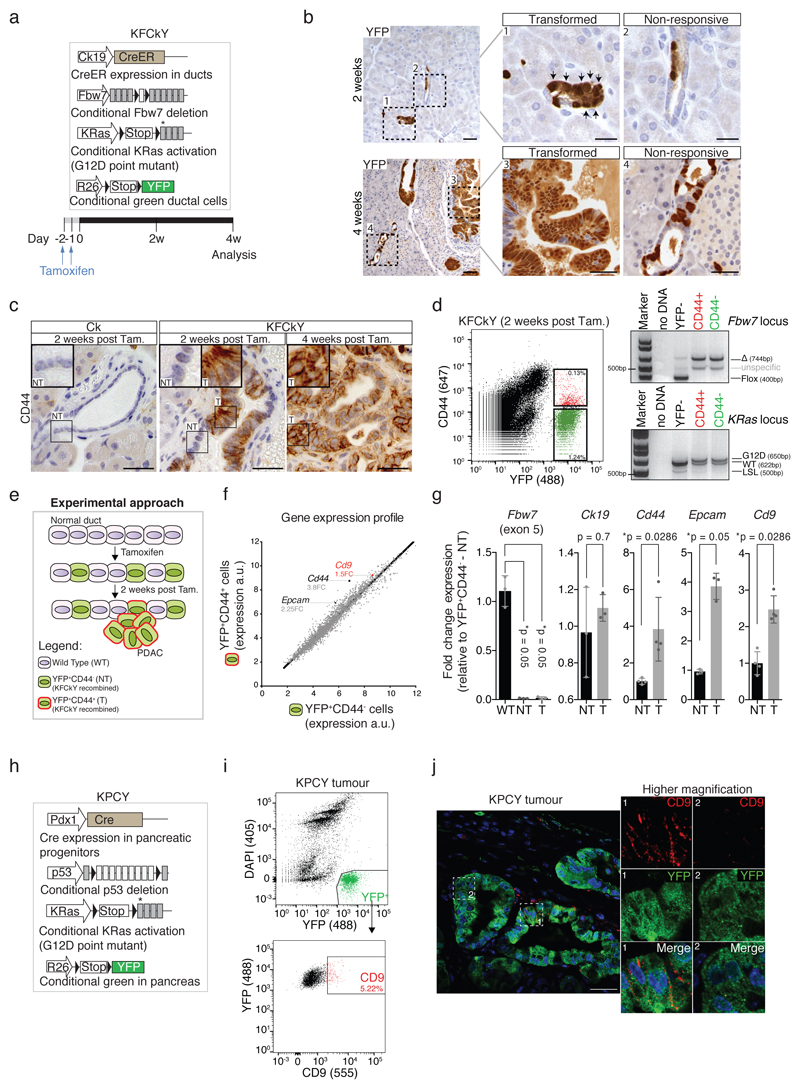
TICs have previously been identified using markers of their normal tissue stem cell counterparts12, but adult pancreas stem cells have not been clearly defined. To enrich for TIC function in vivo, we analysed very early stages of tumourigenesis, where cells of high tumourigenic potential presumably constitute a larger fraction of the tumour. Commonly used PDAC mouse models induce tumourigenesis during embryonic development, preventing the analysis of PDAC initiation. Therefore, we used the LSL-KRasG12D ; Fbw7F/F; Ck19-CreER; R26-LSL-YFP (KFCkY) model, which triggers rapid PDAC development in adult animals upon tamoxifen treatment (Fig. 1a)13.
Figure 1. CD9 identification.
a) Scheme depicting the KFCkY mouse (Fbw7F/F; LSL-KRasG12D; R26-LSL-YFP; Ck19-CreER) and experimental approach. Black triangles, loxP sites; asterisk, G12D mutated exon. 8-week-old mice were used for injection.
b) YFP stain of pancreatic sections of KFCkY mice 2 and 4 weeks post-tamoxifen. Transformed (1, 3) and non-responsive ducts (2, 4) are magnified on the right. Black arrows, transformed cells. Scale bar, 100 μm (left), 50 μm (right).
c) CD44 stain of pancreatic sections of Ck19-CreER control mice 2 weeks post-tamoxifen, KFCkY mice 2 and 4 weeks post-tamoxifen. NT, non-transformed; T, transformed. Scale bar, 50 μm.
d) Flow cytometry analysis of DAPI-negative KFCkY pancreas 2 weeks post-tamoxifen. Secondary antibody only was used to define CD44- gate. Sorted YFP+CD44+ and YFP+CD44- cells were used for PCR genotyping. Expected bands and fragment sizes (in base pairs) are indicated; see Source Data for uncropped gels.
e) Scheme depicting experimental approach. T (YFP+CD44+) and NT (YFP+CD44-) cells from KFCkY pancreases (n = 15) were sorted and their RNA used for gene expression profiling.
f) Gene expression profiles of T and NT cells from an RNA microarray. Normalised expression values (arbitrary units, a.u.) for each identified gene were plotted; each dot represents one gene. Cd44, Cd9, and Epcam are indicated with their fold change (FC) relative to NT cells.
g) Validation of selected hits by RT-qPCR, from independently sorted T and NT cells. WT: non-recombined pancreatic cells (YFP-). Gene expression values were normalised to α-tubulin and fold changes were calculated relative to NT, or WT in the case of Fbw7. Bar chart shows mean, s.d. (n = at least 3 biologically independent animals), two-sided Mann-Whitney tests.
h) Scheme depicting the KPCY mouse (p53F/F; LSL-KRasG12D; R26-LSL-YFP; Pdx1-Cre).
i) Flow cytometry analysis of DAPI-YFP+ population from KPCY tumours at 5 weeks. Secondary antibody only was used to set CD9 gate.
j) CD9 and YFP immunofluorescence staining of KPCY tumour at 5 weeks. Scale bar, 50 μm, inset 40 μm by 40 μm. All flow cytometry plots and immuno-staining data shown in Fig. 1 are representative of at least three biologically independent animals/experiments.
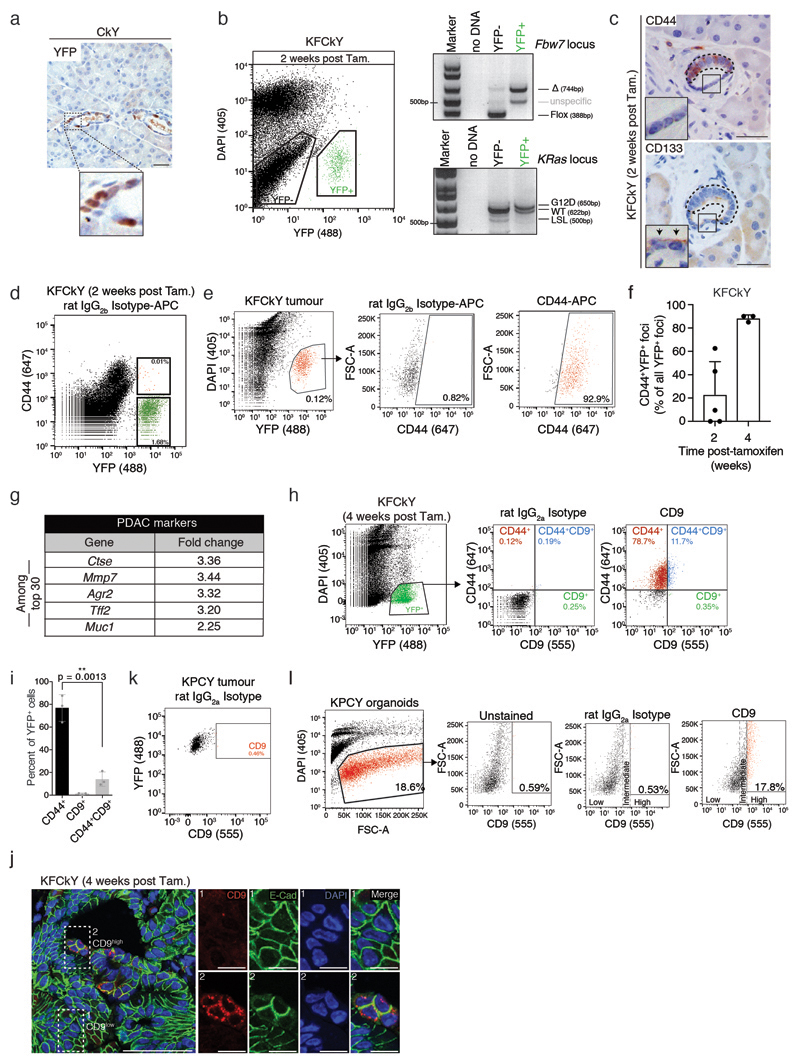
Two weeks post-tamoxifen, some KFCkY ductal cells remained histologically normal, indistinguishable from those in CkY ducts (Fig. 1b, Extended Data Fig. 1a), but others showed cellular and nuclear enlargement, features of transformed cells (Fig. 1b). Both transformed and non-responsive ducts showed recombination of tumour-inducing alleles, highlighted by YFP expression and confirmed by genotyping PCR (Extended Data Fig. 1b). Four weeks post-tamoxifen, we still observed non-responsive YFP+ duct cells (Fig. 1b), suggesting that different transformation potentials were not due to asynchronous recombination.
To look for differences between transformed and non-responsive cells, we analysed previously described CSC markers6, 8. CD133 surface expression was detected in transformed and non-responsive cells (Extended Data Fig. 1c), excluding it as a specific TIC marker. CD44 was expressed in transformed KFCkY duct cells at two weeks post-tamoxifen but not in non-responsive, traced KFCkY duct cells, despite complete recombination of KRas and Fbw7 alleles (Fig. 1c,d, Extended Data Fig. 1c,d). At later stages, almost all tumour cells (i.e. not only cells of high tumourigenic potential) expressed CD44 (Fig. 1c, Extended Data Fig. 1e,f). However, CD44 expression discriminated transformed from non-responsive cells and provided us with a tool to isolate these two populations.
Genome-wide expression analysis of sorted YFP+CD44+ and YFP+CD44- pancreatic cells from fifteen KFCkY mice at the earliest stages of transformation (two weeks post-tamoxifen) found several genes overexpressed in the transformed population known to be upregulated in PDAC, including Epcam14, Ctse15, Agr213 and Cd44, serving as an internal positive control (Fig. 1e,f, Extended Data Fig. 1g). To identify markers that might also distinguish TICs in established PDAC, we selected candidates that were overexpressed at least 1.5-fold in transformed versus non-responsive cells, contained at least one extracellular domain, were lowly expressed in normal pancreas, and were expressed in PDAC cells according to The Human Protein Atlas16. The tetraspanin CD9 met these criteria and its overexpression in transformed KFCkY cells was validated by RT-qPCR (Fig. 1g). Unlike CD44, high CD9 expression remained restricted to a subpopulation of KFCkY tumour cells at later stages of PDAC (Extended Data Fig. 1h-j).
To examine CD9 expression in developed PDAC, we used the Pdx1-Cre; LSL-KRasG12D; p53F/F; Rosa26-LSL-YFP (KPCY) model (Fig. 1h)17. While all PDAC cells expressed the CD9 protein, a small subpopulation of around 5% of YFP+ tumour cells presented increased surface expression of CD9 in late-stage PDAC (Fig. 1i,j, Extended Data Fig. 1k). CD9 localised predominantly to the plasma membrane, with punctate staining characteristic of tetraspanin-enriched microdomains, in both KPCY and KFCkY models (Fig. 1j, Extended Data Fig. 1j)18. CD9 surface expression also remained restricted to a subpopulation of cells in KPCY tumour organoids (Extended Data Fig. 1l).
CD9 surface expression marks PDAC TICs
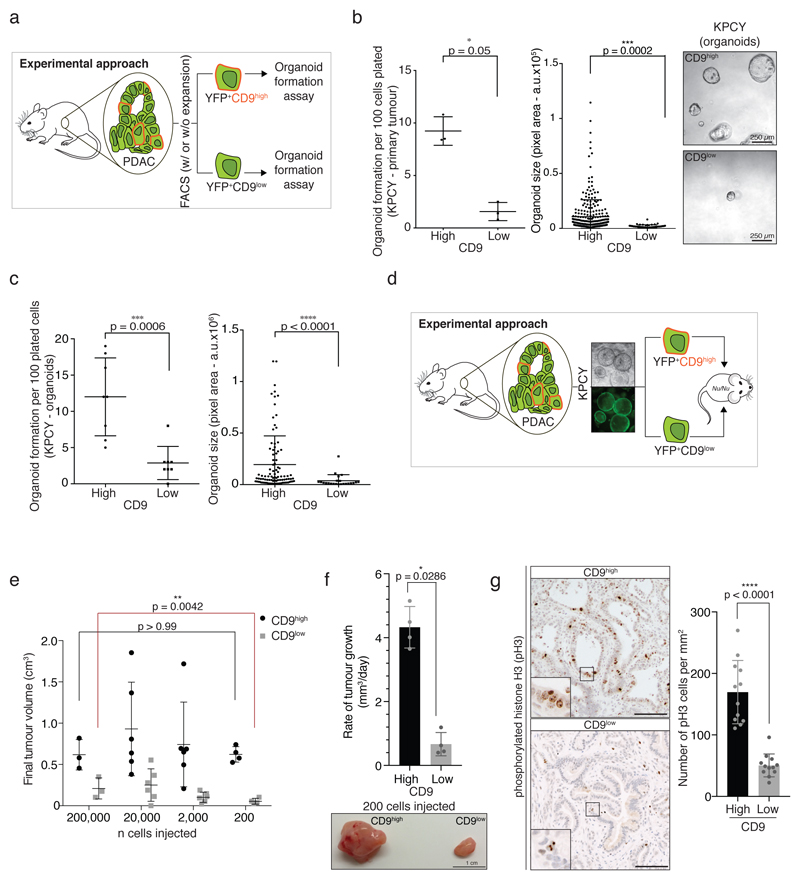
Tumour organoid cultures enrich for pancreatic stem-like cells19 and reflect tumour initiation properties. YFP+CD9high cells sorted from freshly isolated KPCY PDAC demonstrated higher organoid-forming capacity than YFP+CD9low cells (Fig. 2a,b), a result replicated in the ductal KFCkY model and therefore independent of p53 or Fbw7 status (Extended Data Fig. 2a). When cultured as organoids for several passages, the CD9high population retained higher organoid formation capacity (Fig. 2c).
Figure 2. CD9 marks TICs.
a) Scheme depicting experimental approach. Tumour cells (YFP+) from KPCY PDAC were isolated and sorted according to CD9 expression. YFP+CD9high and YFP+CD9low cells were plated in Matrigel for the organoid formation assay.
b) Organoid formation assay of YFP+CD9high and YFP+CD9low cells freshly isolated from KPCY PDAC showing number and size of organoids formed (n = 3 biologically independent animals). Pixel area (arbitrary units, a.u.) was quantified for each organoid using ImageJ. Right, representative brightfield images of organoids 10 days after plating. Scale bar, 250 μm.
c) Organoid formation assay of CD9high and CD9low tumour cells sorted from established KPCY organoids showing number and size of organoids formed (n = 8 biologically independent experiments). Size calculated as in (b). Dot plots in (b) and (c) show mean, s.d., p values from two-sided Mann-Whitney test.
d) Scheme depicting experimental approach. KPCY organoids were grown for several passages. YFP+CD9high and YFP+CD9low cells were sorted and serial dilutions were injected into contralateral flanks of Nu/Nu mice.
e) Final tumour volumes (cm3) from the experiment in (d); n = 3, 6, 6 and 4 biologically independent animals for 200,000-, 20,000-, 2,000- and 200-cell injections, respectively; mean, s.d., p values from two-sided Mann-Whitney test.
f) Rate of tumour growth (mm3/day) of CD9high- and CD9low-derived grafts at highest dilution (n = 4 biologically independent animals, 200 cells). Below, representative image of tumours. Scale bar, 1 cm.
g) Phosphorylated histone H3 (pH3) staining and quantification of CD9high- and CD9low-derived grafts (n = 3 biologically independent animals, from 2000-cell injection). Scale bar, 100 μm. Bar charts in (f) and (g) show mean, s.d., p values from two-sided Mann-Whitney test.
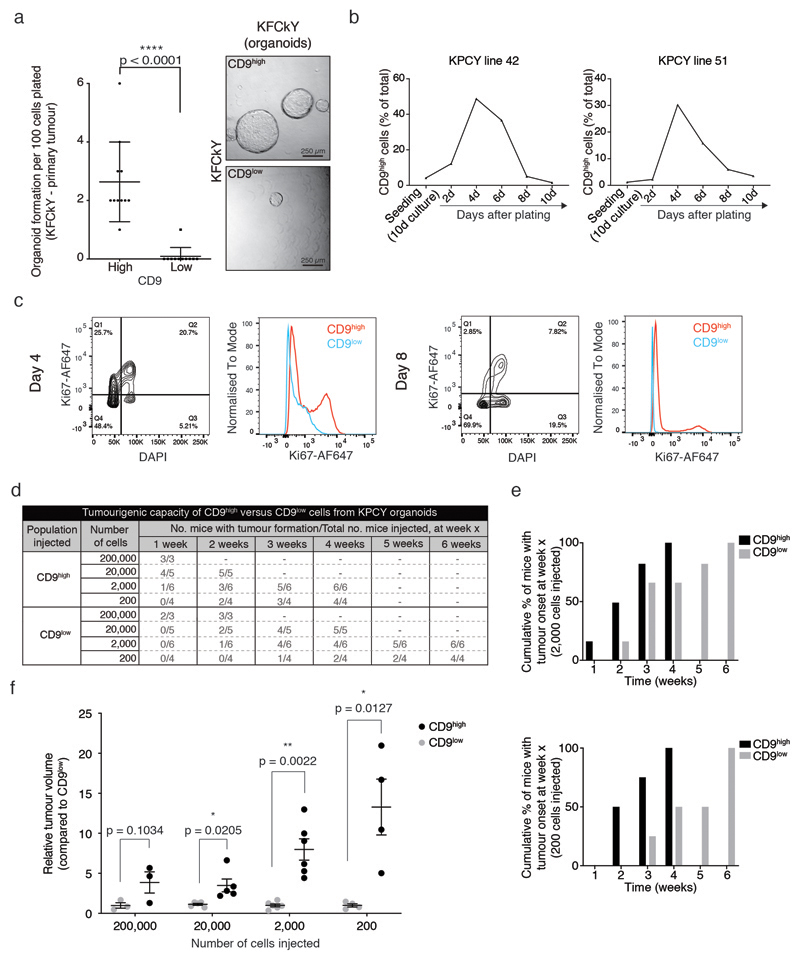
CSC pools are dynamic and vary with the stage of tumour development. While both CSCs and non-CSCs survive seeding, CSCs are enriched at tumour initiation followed by a proportional reduction during tumour expansion20. In accordance with a TIC phenotype, the proportion of CD9high tumour cells was low (~5%) at confluency, but increased as the organoids established after seeding, peaking (~50%) after four days, and returning to baseline as the culture became denser (Extended Data Fig. 2b). More CD9high than CD9low cells were positive for the cell proliferation marker Ki67, with overall proliferation highest at day 4 (Extended Data Fig. 2c). These dynamics suggest that, even though the majority of tumour cells seeded were CD9low, the organoid cultures are initiated and propagated by CD9high cells, which can then give rise to CD9low cells.
To assess the ability of CD9 to mark PDAC TICs in vivo, CD9high and CD9low KPCY organoid cells were sorted and injected subcutaneously in contralateral flanks of immunocompromised mice, at serial dilutions ranging from 200,000 to 200 cells (Fig. 2d). At all dilutions, CD9high cells formed tumour nodules (4 mm3) before CD9low cells (Extended Data Fig. 2d,e), demonstrating that CD9high tumour cells are more capable of initiating tumours upon transplantation.
Whereas ‘non-tumour-initiating cells’ harbour limited proliferative potential that could enable nodule formation21, TICs can sustain the growth of the initiated tumour. Even at limiting cell dilutions, tumours initiated from CD9high cells grew larger and faster. In contrast, CD9low cells failed to maintain tumour growth at limiting dilutions, with two of the four nodules initially formed from 200 cells completely regressing (Fig. 2e,f, Extended Data Fig. 2f). Furthermore, CD9high tumour grafts contained more proliferating cells than CD9low grafts, as measured by phosphorylated histone H3 staining (Fig. 2g).
CD9high cells recapitulate primary tumour heterogeneity
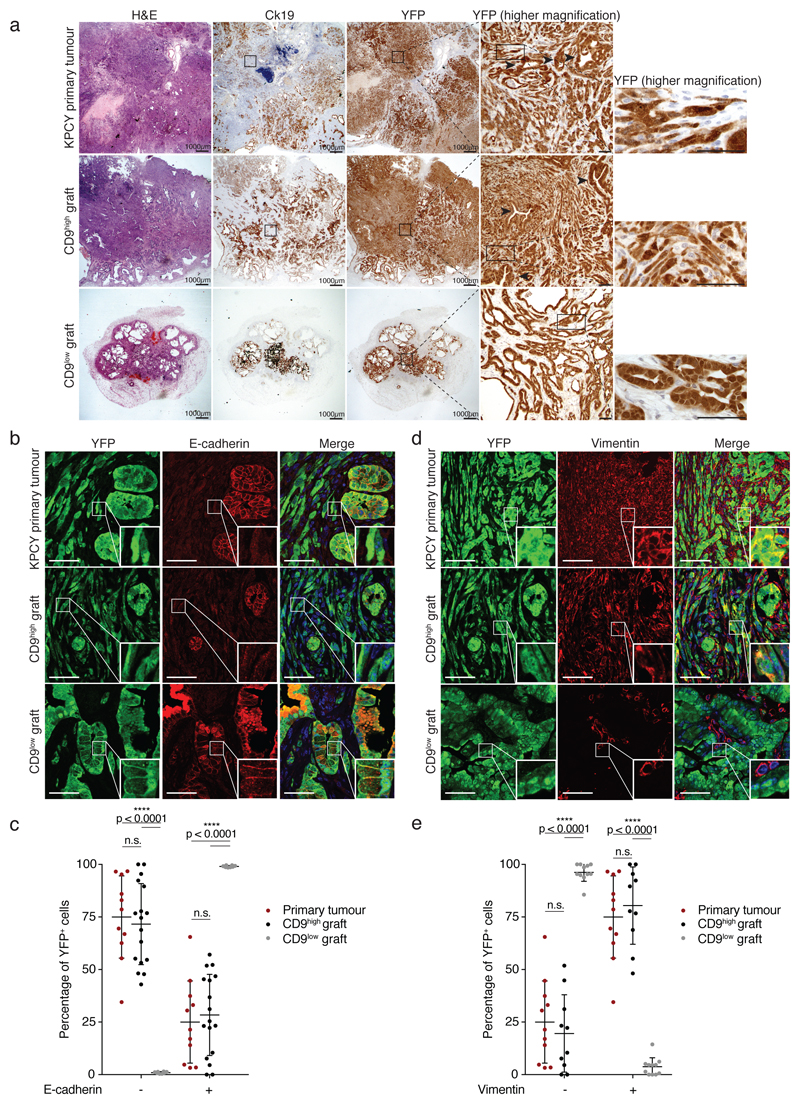
As described for the KPC model17, KPCY tumours contained regions of both ductal epithelial morphology (YFP+CK19+) and mesenchymal (sarcomatoid) morphology (YFP+CK19-; Fig. 3a, top). Similar to the primary tumour, subcutaneous tumours from transplanted CD9high cells also developed a mixed histology, comprising both ductal-like (CK19+) and spindle-shaped (CK19-) tumour cells (Fig. 3a, middle). Tumour grafts from CD9low cells, however, formed cystic structures of exclusively CK19+ cuboidal epithelial cells, with no evidence of spindle-shaped tumour cells (Fig. 3a, bottom).
Figure 3. CD9high cells recapitulate tumour heterogeneity.
a) Histological and immunological analysis of KPCY primary tumour, and CD9high- and CD9low-derived tumour grafts (n = 3 biologically independent animals, from 2000-cell injection). Black arrowheads indicate ductal differentiation in primary and CD9high-derived tumours. All regions in CD9low-derived tumours exhibit ductal differentiation. Scale bar, 1000 μm; 100 μm (YFP high magnification images).
b) Immunofluorescence staining for the epithelial marker E-cadherin and the YFP lineage tracer in KPCY primary tumours, and CD9high- and CD9low-derived tumour grafts. Scale bars, 30 μm.
c) Quantification of YFP-traced tumour cells with and without E-cadherin co-expression for the tumours in (b), plotted as percentage of total YFP+ cells.
d) Immunofluorescence staining for the mesenchymal marker vimentin and the YFP lineage tracer in KPCY primary tumours, and CD9high- and CD9low-derived tumour grafts. Scale bars, 30 μm.
e) Quantification of YFP-traced tumour cells with and without vimentin co-expression for the tumours in (d), plotted as percentage of total YFP+ cells. Dot plots in (c) and (e) include data from n = 3 biologically independent animals, show mean, s.d., p values from two-sided Mann Whitney test.
The sarcomatoid morphology of PDAC cells, also seen in human samples, is thought to be due to epithelial-to-mesenchymal transition, implicated in tumour aggressiveness and chemoresistance22–24. Mirroring primary PDAC, the CD9high-derived tumour grafts contained both epithelial (E-cadherin+) and mesenchymal (vimentin+) cells. In contrast, CD9low-derived tumour nodules contained exclusively E-cadherin+ and almost no vimentin+ cells, consistent with the absence of spindle-shaped cells in these tumours (Fig. 3b-e). Together, these data indicate that CD9high KPCY tumour cells can efficiently initiate the growth of tumours that recapitulate the morphological and cellular heterogeneity of primary KPCY tumours.
CD9 is required for efficient PDAC development
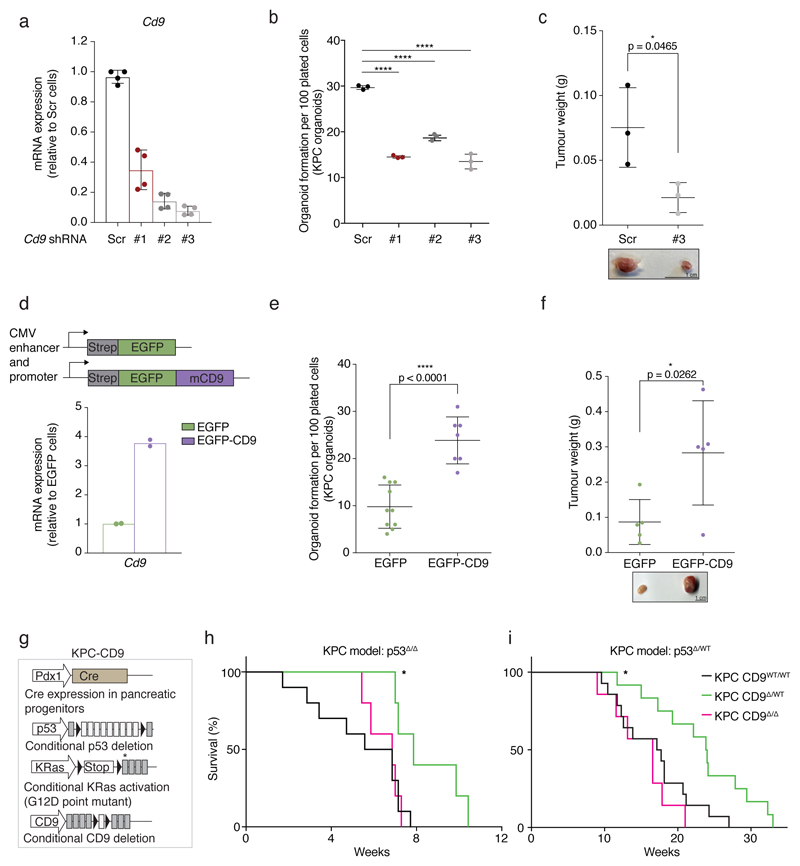
To determine whether CD9 is of functional importance in PDAC, we manipulated CD9 levels in KPC organoids. Stable knockdown of CD9 using three different lentiviral shRNAs compromised organoid-forming capacity (Fig. 4a,b, Extended Data Fig. 3a). When injected subcutaneously into the flanks of immunocompromised mice, CD9 knockdown cells formed smaller tumour grafts, confirming that CD9 expression is required for efficient tumourigenesis (Fig. 4c).
Figure 4. CD9 is required for efficient PDAC development.
a) Cd9 mRNA levels measured by RT-qPCR upon stable lentiviral knockdown in KPC organoids using three different shRNAs (#1-3) in pLKO.1 vector. Values were normalised to Actb; fold changes calculated relative to Scr (n = 4 biologically independent experiments). Bar chart shows mean, s.d.; Scr, scrambled shRNA control.
b) Organoid formation assay (organoid number) of KPC organoids upon CD9 knockdown using shRNAs #1-3 (representative of n = 3 biologically independent experiments). ****p < 0.0001, two-sided t test.
c) Weight of subcutaneous grafts at endpoint after injection of 2,000 Scr or sh#3 KPC cells (n = 3 biologically independent animals). Below, representative image of tumours. Scale bar, 1 cm. p = 0.0465, two-sided t test. Dot plots in (b) and (c) show mean, s.d.
d) Schematic of the EGFP control and EGFP-mCD9 overexpression system using a CMV enhancer/promoter. Cd9 mRNA levels measured by RT-qPCR upon stable lentiviral overexpression of CD9. Values were normalised to Pol2ra; fold changes calculated relative to EGFP (n = 2 biologically independent experiments).
e) Organoid formation assay (organoid number) of KPC organoids upon CD9 overexpression (n = 3 biologically independent experiments). p < 0.0001, two-sided t test.
f) Weight of subcutaneous grafts at endpoint after injection of 10,000 EGFP or EGFP-mCD9 KPC cells (n = 5 biologically independent animals). Below, representative image of tumours. Scale bar, 1 cm. p = 0.0262, two-sided t test. Dot plots in (e) and (f) show mean, s.d.
g) Schematic of the KPC mouse model incorporating the conditional deletion of CD9. Black triangles, loxP sites; asterisk, G12D mutated exon.
h) Kaplan-Meier survival plots of KPC (p53Δ/Δ) mice with wild-type CD9 (black, n = 10), heterozygous (green, n = 5) and homozygous (magenta, n = 5 biologically independent animals) CD9 deletion. p = 0.0113, two-sided log-rank test KPC CD9WT/WT versus KPC CD9Δ/WT.
i) Kaplan-Meier survival plots of KPC (p53Δ/WT) mice with wild-type CD9 (black, n = 14), heterozygous (green, n = 12) and homozygous (magenta, n = 7 biologically independent animals) CD9 deletion. p = 0.0114, two-sided log-rank test KPC CD9WT/WT versus KPC CD9Δ/WT.
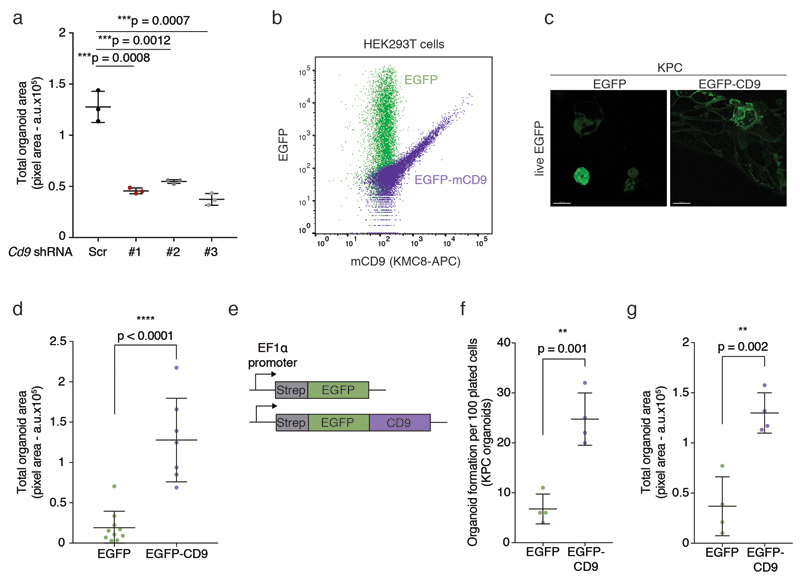
A CMV-driven lentiviral EGFP-mCD9 fusion construct, previously shown to maintain CD9 function25, yielded equal expression of EGFP and CD9 protein and showed EGFP-mCD9 localising to the plasma membrane, whereas EGFP localised to the cytoplasm of KPC cells (Extended Data Fig. 3b,c). EGFP-mCD9-expressing cells, which expressed four times the endogenous levels of Cd9 (Fig. 4d), showed enhanced KPC organoid formation compared to EGFP control cells (Fig. 4e, Extended Data 3d), indicating that CD9 abundance may be limiting for tumour initiation. These findings were confirmed using an EF1α-driven CD9 overexpression construct (Extended Data Fig. 3e-g). EGFP-mCD9 cells also formed larger tumour grafts compared to EGFP control cells when injected subcutaneously into the flanks of immunocompromised mice (Fig. 4f).
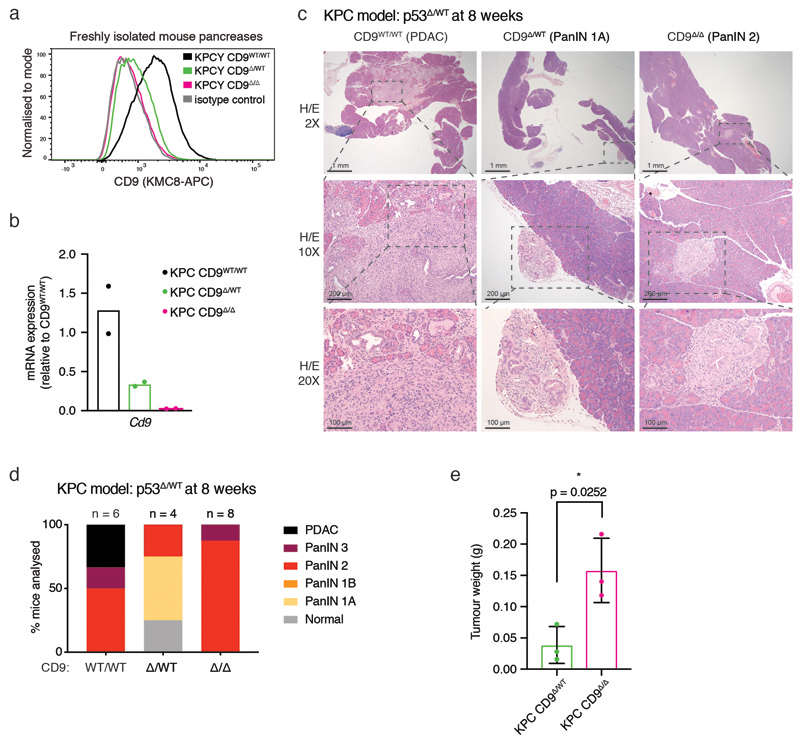
To test the role of CD9 in an aggressive autochthonous model of PDAC, we crossed a Cd9 conditional allele26 into the KPCY background (Fig. 4g). Complete CD9 deletion in YFP+ cells was confirmed by flow cytometry and qPCR of primary pancreatic samples (Extended Data Fig. 4a,b). Strikingly, heterozygous CD9 deletion in the pancreas significantly extended the lifespan of KPCY mice harbouring either homozygous or heterozygous deletion of p53, suggesting that CD9 contributes to PDAC progression in vivo (Fig. 4h,i). At 8 weeks in the p53 heterozygous KPCY model, developing tumours had already progressed to PDAC in the CD9WT/WT mice but only reached PanIN stages in CD9 heterozygous or homozygous mice (Extended Data Fig. 4c,d). Surprisingly, homozygous CD9 deletion did not extend lifespan and pancreatic lesions were more advanced at 8 weeks than those in CD9 heterozygous mice (Fig. 4h,i, Extended Data Fig. 4c,d). We hypothesised that completely deleting CD9 during embryogenesis activates compensatory mechanisms, whereas heterozygous deletion does not. In line with this hypothesis, KPC CD9Δ/Δ cells formed subcutaneous tumour grafts more efficiently than their CD9Δ/WT counterparts (Extended Data Fig. 4e). The slower tumour progression and increase in survival of CD9 heterozygous KPC mice are consistent with the decrease in TIC properties observed upon CD9 knockdown. Overall, these experiments demonstrate that, in addition to marking TICs in PDAC, CD9 also drives in vitro organoid formation and is involved in PDAC tumour formation in vivo.
CD9 facilitates glutamine import into TICs
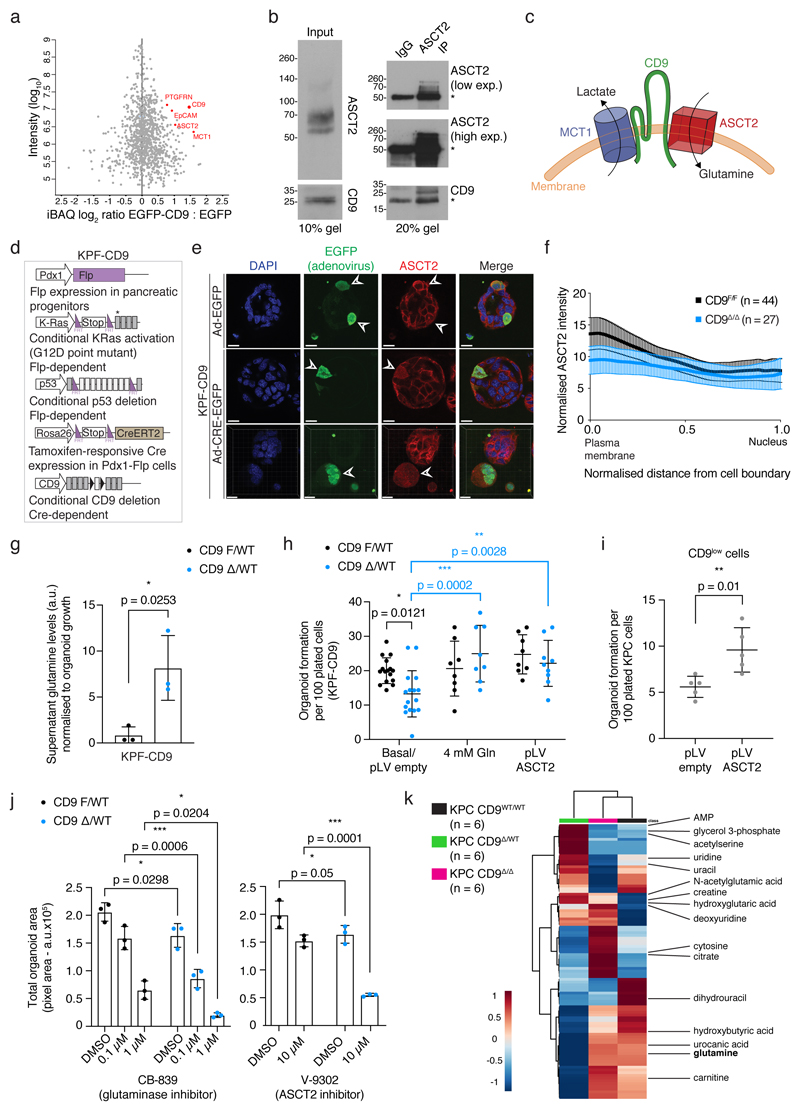
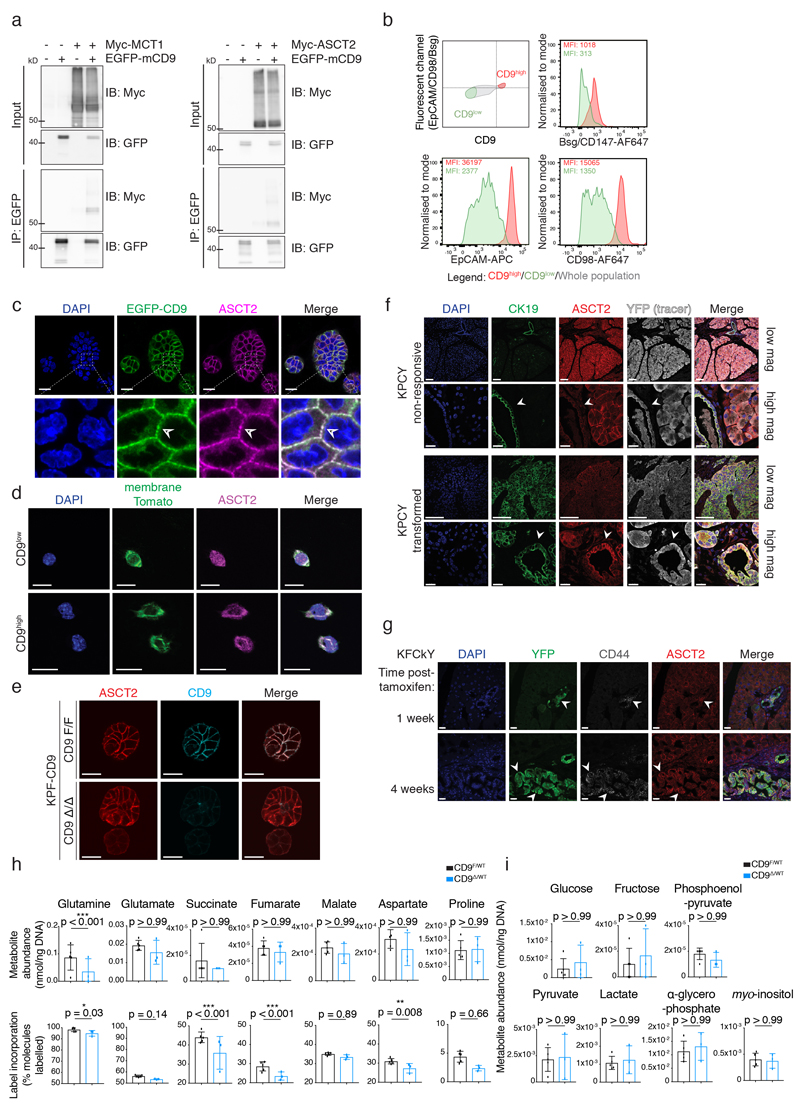
As a member of the tetraspanin protein family, CD9 has previously been described as a scaffolding protein interacting with a variety of other cell surface proteins, including PTGFRN27, EpCAM28, and other tetraspanins including CD9 itself29 and CD8127. Since CD9 function is highly context-dependent18, we used an immunoprecipitation-mass spectrometry (IP-MS) approach in KPC cells to uncover relevant CD9 interactors in PDAC and investigate how CD9 contributes to TIC function. Following intensity-based absolute quantification (iBAQ) of EGFP and EGFP-mCD9 binding partners, CD9 was the most enriched protein in the EGFP-mCD9 condition, and PTGFRN and EpCAM were identified as interactors, validating our approach (Fig. 5a). Among the top hits were the glutamine transporter ASCT2 (encoded by Slc1a5) and the lactate transporter MCT1 (encoded by Slc16a1), neither of which have previously been reported to interact with tetraspanins (Fig. 5a). The interactions of CD9 with ASCT2 and MCT1 were confirmed by co-IP (Fig. 5b, Extended Data Fig. 5a). Since ASCT2 and MCT1 have been reported to associate in protein complexes (Fig. 5c) also containing EpCAM30, we tested whether CD9 cell surface expression correlates with expression of these proteins. Indeed, CD9high cells also showed higher surface levels of EpCAM, basigin (an MCT1 chaperone) and CD98hc (obligate binding partner of amino acid transporter LAT1) compared to CD9low cells (Extended Data Fig. 5b).
Figure 5. CD9 facilitates glutamine import into TICs.
a) Intensity-based absolute quantification of mass spectrometry results upon EGFP pull-down in EGFP versus EGFP-mCD9 KPC cells from one experiment.
b) Co-IP of endogenous ASCT2 with CD9 in KPC cells. Input, left; Co-IP, right, asterisks indicate IgG heavy and light chains. Blot representative of 2 independent experiments; see Source Data for uncropped blots.
c) Model of membrane complex containing CD9 and metabolite transporters, MCT1 and ASCT2.
d) Schematic of KPF-CD9 dual-recombinase cells: KRasG12D activation and p53 deletion – Flp-dependent; CD9 deletion – Cre-dependent.
e) Immunofluorescence of KPF-CD9 organoids after control Adeno-EGFP or Adeno-CRE-EGFP infection. Arrowheads indicate adeno-infected cells with ASCT2 localisation. Images represent 2 biologically independent experiments. Scale bars, 20 μm.
f) Quantification of ASCT2 localisation from (e). Adeno-EGFP cells (black; n = 44 organoids) versus Adeno-CRE-EGFP cells (blue; n = 27 organoids; representative of 2 biologically independent experiments). Graph shows mean, 95% CI.
g) Supernatant glutamine levels of KPF-CD9F/WT and heterozygous KPF-CD9Δ/WT organoids, normalised to organoid growth (n = 3 biologically independent experiments). p = 0.0253, two-sided t test.
h) Organoid formation assay (organoid number) of KPF-CD9F/WT and KPF-CD9Δ/WT organoids, with basal or elevated glutamine; with control pLV or pLV ASCT2 overexpression (n = 3 biologically independent experiments). Black p values (CD9F/WT versus CD9Δ/WT) calculated using two-way ANOVA corrected for multiple comparisons, Holm-Sidak method, α = 0.05. Blue p values (within CD9Δ/WT) calculated using two-way ANOVA corrected for multiple comparisons, Dunnett’s test, α = 0.05.
i) Organoid formation assay (organoid number) of CD9low KPC cells with control pLV or pLV ASCT2 overexpression (n = 3 biologically independent experiments). p = 0.01, two-sided t test.
j) Organoid formation assay (total organoid area) of KPF-CD9F/WT and KPF-CD9Δ/WT organoids, with DMSO and CB-839 or V-9302 drug treatments (n = 3 biologically independent experiments). Statistics calculated using two-way ANOVA corrected for multiple comparisons, Holm-Sidak method, α = 0.05. Dot plots in Fig. 5g-j show mean, s.d.
k) Unsupervised clustering heatmap of top 100 metabolic features in 4-week pancreatic tissue from KPC CD9WT/WT, KPC CD9Δ/WT and KPC CD9Δ/Δ mice (n = 6 per genotype); 16 identified metabolites indicated.
Given that KRas-driven pancreatic cancer relies on glutamine metabolism31, we focussed on the interaction between ASCT2 and CD9. ASCT2 localised to CD9-enriched puncta on the plasma membrane of KPC organoids (Extended Data Fig. 5c). ASCT2 colocalisation with membrane tdTomato staining was higher in CD9high cells than CD9low cells sorted from organoid cultures (Pearson’s correlation coefficient 0.68–0.80 vs. 0.51–0.63, p < 0.0001, Extended Data Fig. 5d). To test the effect of CD9 deletion on ASCT2, we employed a dual-recombinase system (Fig. 5d, designated KPF-CD9) that allows acute deletion of CD9 in established tumour organoids32. In this system, PDAC is initiated by embryonic KRasG12D activation and p53 deletion using Pdx1-Flp recombinase, and CD9 is then deleted in tumour organoids using adenoviral Cre or 4-hydroxytamoxifen (4-OHT). When the Cd9 gene was acutely deleted in growing KPF-CD9 organoids, ASCT2 also shifted its membrane localisation to a more diffuse staining pattern throughout the cell (Fig. 5e, Extended Data Fig. 5e), quantified using a cell segmentation algorithm (Fig. 5f, see Methods). High expression of ASCT2 correlates with poorer outcome for pancreatic cancer patients33, suggesting that controlling ASCT2 localisation could contribute to CD9 function in PDAC. In line with this idea, ASCT2 was upregulated on transformed CK19+ tumour cells compared to non-responsive CK19+ ductal cells, as well as in transformed YFP+CD44+ lesions in the KFCkY model (Extended Data Fig. 5f,g). Since ASCT2 is an important glutamine importer in pancreatic cancer cells33, we analysed glutamine uptake in KPF-CD9 organoids. Compared to control cells (KPF CD9F/WT), acute genetic inactivation of one allele of Cd9 (KPF CD9Δ/WT) led to significantly lower glutamine uptake and intracellular glutamine abundance as well as lower incorporation of 13C-glutamine into metabolites of the Krebs cycle (Fig. 5g, Extended Data Fig. 5h). This defect was not due to an overall decrease in metabolite abundance in KPF CD9Δ/WT cells, as other metabolites were equally abundant under both conditions (Extended Data Fig. 5i).
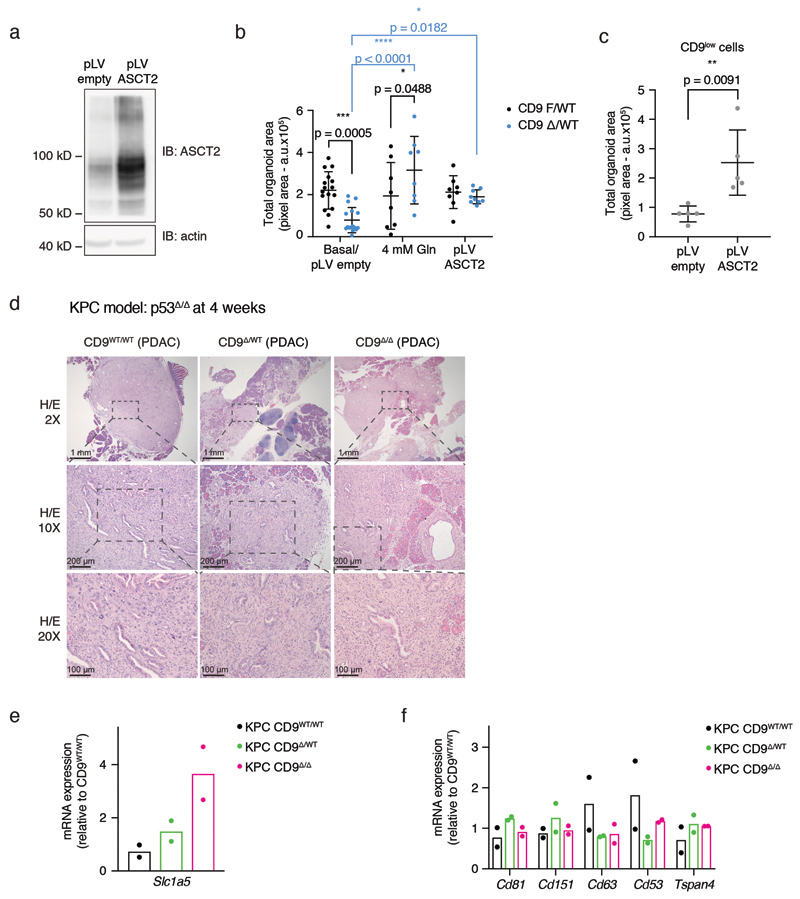
To determine whether decreased glutamine uptake in CD9-deficient tumour cells affects their tumour initiation, we assayed organoid formation in response to modulation of glutamine availability or overexpression of ASCT2 (Extended Data Fig. 6a). As expected, KPF-CD9Δ/WT organoids displayed reduced organoid formation in medium containing basal levels of glutamine. Importantly, this phenotype could be ameliorated either by glutamine supplementation, or by ASCT2 overexpression (Fig. 5h, Extended Data Fig. 6b). ASCT2 overexpression also increased organoid formation in CD9low KPC cells (Fig. 5i, Extended Data Fig. 6c), indicating that a key function of CD9 in PDAC TICs is to facilitate glutamine uptake. Restriction of glutamine metabolism by treatment with glutaminase inhibitors has previously been proposed as a potential therapeutic strategy for PDAC31, 34, and ASCT2 inhibitors have also been developed35. Acute CD9 deletion in PDAC organoids increased the response to both glutaminase and ASCT2 inhibitors (Fig. 5j), suggesting that combined targeting of CD9 and glutamine metabolism might be a valuable therapeutic strategy.
Since CD9 affected glutamine uptake in PDAC, we tested whether KPC CD9Δ/Δ tumours change their metabolism to compensate for CD9 loss, given that homozygous CD9 deletion did not provide a survival benefit. We analysed the total metabolome of pancreatic tissues of KPC (p53Δ/Δ) mice at 4 weeks when all animals, irrespective of CD9 status, had already progressed to PDAC (Extended Data Fig. 6d). Unsupervised clustering of the top 100 significantly changing metabolic features, as measured by LC-MS and subsequent ANOVA analysis, revealed that CD9WT/WT and CD9Δ/Δ tissues clustered together, and separately from CD9Δ/WT tissues (Fig. 5k). The identified metabolites fell into several metabolic pathways, including glutamine/glutamate metabolism and related pathways (Supplementary Table 3). Strikingly, CD9WT/WT and CD9Δ/Δ tissues contained higher levels of glutamine than CD9Δ/WT tissues (Fig. 5k). Furthermore, the gene encoding ASCT2, Slc1a5, was upregulated in CD9Δ/Δ cells (Extended Data Fig. 6e), while no other tetraspanins tested were upregulated (Extended Data Fig. 6f). Thus, complete inactivation of CD9 in KPC CD9Δ/Δ tumours leads to compensatory metabolic rewiring, allowing rapid tumour progression.
CD9 expression correlates with poorer outcome for patients
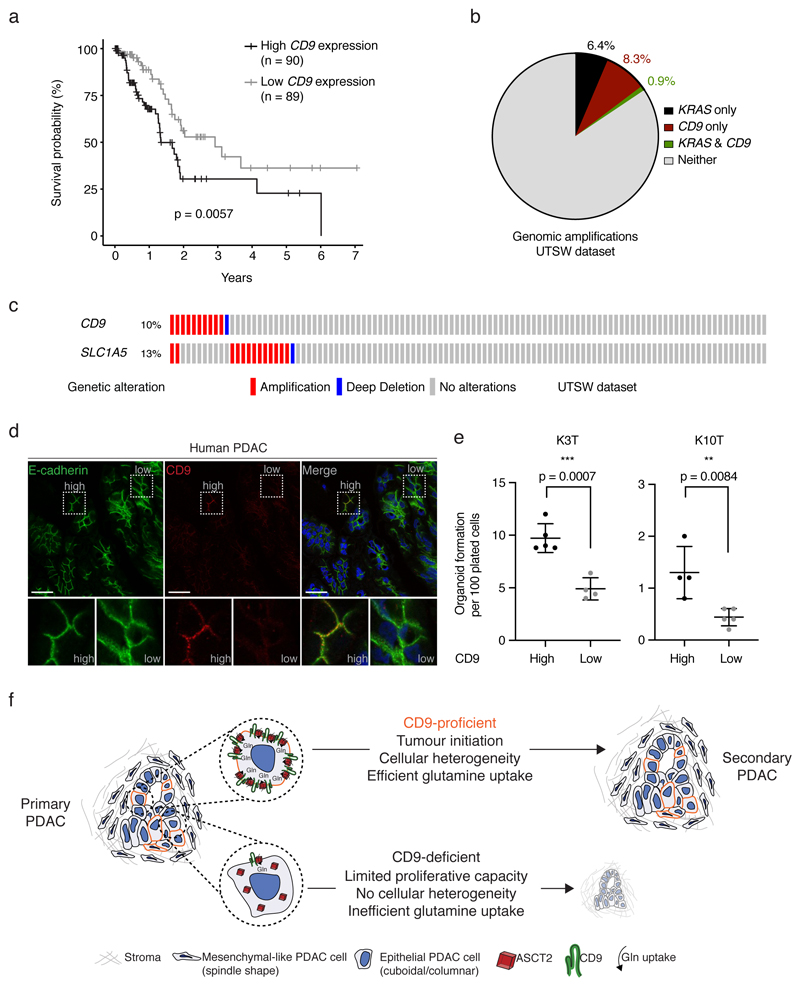
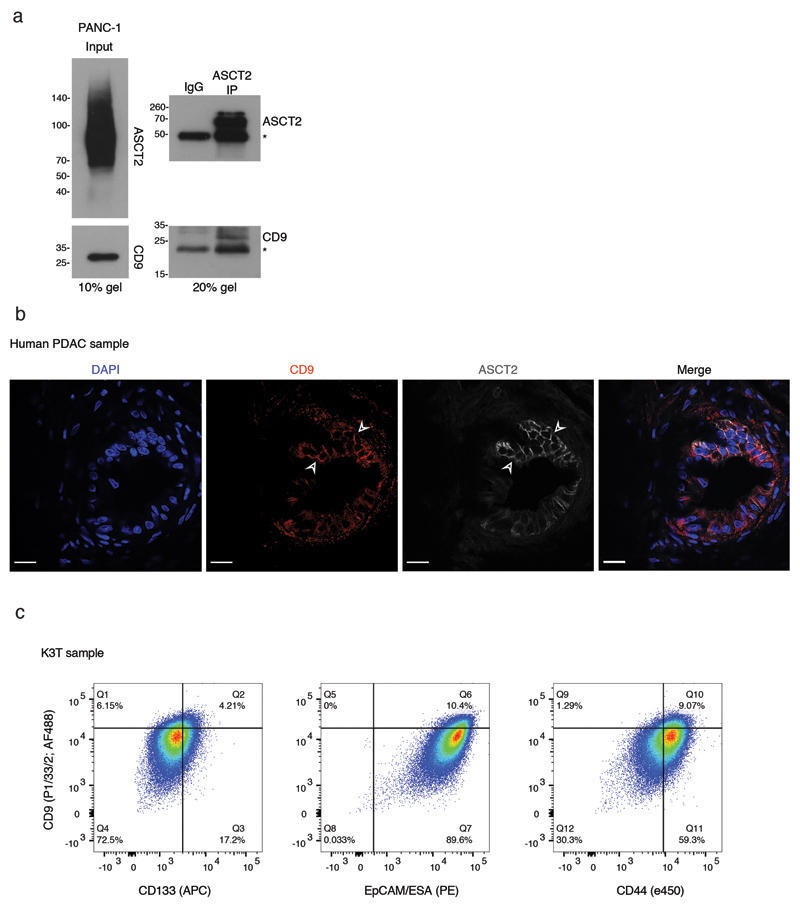
To determine whether CD9 is also a functional TIC marker in human PDAC, we first analysed public datasets. High CD9 mRNA expression was associated with shorter overall survival (n = 179, TCGA dataset36; Fig. 6a), and approximately 10% of micro-dissected human PDAC samples exhibited genomic amplifications of CD9 (UTSW dataset37; Fig. 6b). CD9 is located on the short arm of chromosome 12 together with KRAS, a gene commonly amplified in human PDAC38. However, we observed that KRAS and CD9 are rarely co-amplified, suggesting that CD9 amplification is not a passenger event and may drive human PDAC independently (Fig. 6b). A further subset of samples, mainly those without CD9 amplification, showed amplification of SLC1A5 (Fig. 6c). We also confirmed the interaction of CD9 with ASCT2 in the human pancreatic cancer cell line PANC-1 (Extended Data Fig. 7a).
Figure 6. CD9 expression in human PDAC and overall model.
a) Kaplan-Meier survival plot of PDAC patients in the TCGA dataset expressing above (n = 90 patients, black) or below (n = 89 patients, grey) median levels of CD9. p = 0.0057, two-sided log-rank test.
b) Pie chart showing largely independent genomic amplifications of CD9 and KRAS genes on chromosome 12 in micro-dissected PDAC samples (n = 109) of the UTSW dataset 37.
c) Oncoprint of CD9 and SLC1A5 (encoding ASCT2) genes showing largely independent genomic amplifications in the UTSW dataset, visualised using cBioportal (http://www.cbioportal.org/)36.
d) Immunofluorescence of a human PDAC, showing rare and punctate CD9 membrane staining in E-cadherin+ tumour cells (representative of 5 independent patient samples). Scale bars, 20 μm, insets 20 μm by 20 μm.
e) Organoid formation assay (organoid number) of CD9high and CD9low tumour cells sorted from primary human PDAC organoid cultures (KRAS mutant; n = 2 biologically independent patients samples). Dot plots show mean, s.d., p values from two-sided t tests.
f) Model contrasting the properties of CD9-proficient and CD9-deficient cells in PDAC. Primary PDAC tumours are heterogeneous, containing some tumour cells with high surface levels of CD9 (outlined in red). These cells are highly tumourigenic and, upon transplantation, can recapitulate the heterogeneity of primary tumours (“Secondary PDAC”, right). CD9low or heterozygous cells, in contrast, cannot recapitulate the primary tumour upon transplantation. See text for details.
Furthermore, resected human PDAC tumours showed a subpopulation of CD9high cells (Fig. 6d), which also exhibited high levels of ASCT2 at the cell surface (Extended Data Fig. 7b). Thus, regulation of ASCT2 by CD9 may also be important in human PDAC. A substantial percentage of CD9high cells was CD44low and CD133low, indicating that CD9 marks a population that partially overlaps, but is distinct from, previously described CSC populations (Extended Data Fig. 7c). Importantly, sorted CD9high cells from primary human PDAC organoid cultures (KRAS mutant) formed significantly more organoids compared to CD9low cells (Fig. 6e), suggesting that, as in mice, human CD9high cells have enhanced tumour-initiating properties.
Discussion
In seeking to define and understand the biology of TICs in PDAC, we made use of the heterogeneity in tumour-initiating capacity at early stages of tumourigenesis to identify upregulation of the tetraspanin CD9 in TICs. CD9high, but not CD9low, cells gave rise to heterogeneous and highly proliferative tumours that histologically resembled primary PDAC. Alteration of CD9 levels in PDAC organoids affected their tumour-initiating capacity, and heterozygous deletion of Cd9 in an autochthonous model of PDAC increased overall survival in mice. Mechanistically, CD9 was linked to altered tumour cell metabolism by interacting with the glutamine transporter ASCT2 and enhancing glutamine uptake. Thus, we identified CD9 as a functionally significant marker of TICs in PDAC (Fig. 7).
Although several CSC markers have been proposed for PDAC, including CD44, c-Met and CD133, as well as autofluorescence/ABCG2 expression and ALDH1 activity6–8, 39, 40, the functional relevance and overlap of these markers in putative TIC populations is still debated41. However, the cell surface localisation of CD9, together with its functional link to TIC metabolism, make it particularly useful as a marker of TIC biology, as well as a potential target of antibody-based therapies. Accumulating evidence hints at the importance of tetraspanins in stem cells more generally, from the recent discovery of TSPAN-1 as a marker of totipotent adult stem cells in the planarian Schmidtea mediterranea42, to Tspan3 as a marker of murine leukaemia-initiating cells43.
CD9 has previously been described to have both pro- and anti-tumour functions18, including restraining glioblastoma cell proliferation44, prostate cancer metastasis45, and surface EGFR expression in pancreatic cancer cell lines46. However, in support of our findings, CD9 expression was found to be increased in pancreatic cancer versus normal pancreatic tissue47. CD9 has also been described as a marker of CSCs in glioblastoma48, 49 and B-cell acute lymphoblastic leukaemia50. Our data indicate that CD9high cells can initiate and sustain PDAC growth, and that the CD9 protein itself has an important function in PDAC.
Since CD9 overexpression enhanced organoid and tumour formation, the levels of CD9 may be rate-limiting for PDAC cells during tumourigenesis. Glutamine is the most highly metabolised amino acid in human PDAC tumours. Serum glutamine levels decrease during PDAC progression, and glutamine metabolism is essential in KRas-driven PDAC31, 51, 52. Since the PDAC microenvironment is poorly perfused and nutrient poor, PDAC cells use glutamine transporters as well as macropinocytosis for glutamine uptake53, 54. Our data suggest that TICs have a mechanism for maximising glutamine uptake. We speculate that due to their high surface levels of ASCT2 and glutamine metabolism, CD9high TICs show reduced sensitivity to glutaminase and ASCT2 inhibition. KPC tumours have previously been shown to continue growing and metabolically rewire in the presence of a glutaminase inhibitor34. Given that CD9 heterozygosity results in a significant lifespan extension in KPC mice, a partial interference with CD9 function may be sufficient to gain therapeutic benefit. Alternatively, simultaneous targeting of CD9 and glutamine metabolism could anticipate potential compensatory mechanisms and improve long-term response. In conclusion, our findings open up several potential approaches to inhibit PDAC growth by targeting TICs via CD9.
Extended Data
Extended Data Fig. 1. CD9 identification.
a) YFP stain of pancreatic ducts of R26-LSL-YFP; Ck19-CreER mice 2 weeks post-tamoxifen. Scale bar, 50 μm, inset 50 μm x 50 μm.
b) Flow cytometry analysis and genotyping of unrecombined and recombined cells from KFCkY pancreas 2 weeks post-tamoxifen. Expected band sizes (base pairs) are indicated; see Source Data for uncropped gels.
c) CD44 and CD133 stain in consecutive pancreatic sections of KFCkY mice 2 weeks post-tamoxifen. Non-responsive regions magnified. Black arrows show apical expression of CD133 in non-responsive cells. Scale bar, 50 μm.
d) CD44 gating strategy using rat IgG2b isotype control on KFCkY pancreas 2 weeks post-tamoxifen. Related to Fig. 1d.
e) Validation of the CD44 antibody using rat IgG2b isotype control on KFCkY tumours; quantification of CD44+ cells.
f) Quantification of transformed/CD44+ YFP+ foci in pancreatic tissues of KFCkY mice two (n = 5) and four (n = 3 biologically independent animals) weeks post-tamoxifen. Dot plot shows mean, s.d.
g) Human PDAC markers among upregulated genes in microarray. Fold changes relative to NT cells.
h) Flow cytometry analysis of CD44 and CD9 expression on live, YFP+ cells from KFCkY pancreas 4 weeks post-tamoxifen.
i) Quantification of live tumour cells (DAPI-YFP+, n = 3 biologically independent animals) from (h). Bar chart shows mean, s.d., p = 0.0013, two-sided t test.
j) CD9, E-cadherin and DAPI staining on pancreatic tissues of KFCkY mice 4 weeks post-tamoxifen. Scale bar, 50 μm, 10 μm (inset).
k) CD9 gating strategy using rat IgG2a isotype control on live KPCY tumour cells. Related to Fig. 1i.
l) Validation of the CD9 antibody using rat IgG2a isotype control in live KPCY PDAC organoids; quantification of CD9+ cells. All flow cytometry plots and immuno-staining data shown in Extended Data Fig. 1 are representative of at least three biologically independent animals/experiments.
Extended Data Fig. 2. CD9 marks TICs.
a) Organoid formation assay (organoid number) of CD9high and CD9low YFP+ tumour cells freshly isolated from KFCkY PDAC (n = 4 biologically independent animals). Dot plot shows mean, s.d., p value from two-sided Mann-Whitney test. Right, representative brightfield images of generated organoids 10 days after plating. Scale bar, 250 μm.
b) CD9 expression dynamics of two representative KPCY organoid cultures. Organoid cultures were dissociated at confluency and replated. The percentage of CD9high cells was measured by flow cytometry over time as the cultures grew.
c) Flow cytometry analysis of a representative KPCY organoid culture at 4 and 8 days of culture, stained for CD9 and the proliferation marker Ki67. Proliferation is higher at 4 than 8 days, and only CD9high cells actively proliferate in the culture at both timepoints. Flow cytometry plots shown in (b) and (c) are representative of at least three biologically independent samples.
d) Tumourigenic capacity of CD9high versus CD9low tumour cells from KPCY PDAC-derived organoids. 200,000, 20,000, 2,000 or 200 sorted tumour cells were injected into the flanks of Nu/Nu mice and the number of weeks to nodule detection (4 mm3) was registered.
e) Bar charts of percentage of mice injected with 2,000 (above) or 200 (below) sorted CD9high or CD9low tumour cells that developed tumours by the given week. Each bar shows cumulative data of all mice harbouring tumours at a given week (n = 6 for 2,000 cells, n = 4 for 200 cells).
f) Fold difference in tumour volumes between the CD9low- and CD9high-derived tumours at each dilution; n = 3, 5, 6 and 4 biologically independent animals for 200,000-, 20,000-, 2,000- and 200-cell injections, respectively. Dot plot shows mean, s.d., p values from two-sided t tests.
Extended Data Fig. 3. CD9 is required for efficient PDAC formation.
a) Organoid formation assay (total organoid area) of KPC organoids upon CD9 knockdown (representative of n = 3 biologically independent experiments). Dot plot shows mean, s.d., p values from two-sided t test. Related to Fig. 4b.
b) Flow cytometry plot of HEK293T cells transiently transfected with EGFP control and EGFP-mCD9 vectors. The KMC8 antibody was used to specifically recognise murine CD9.
c) Live confocal microscopy images showing cytoplasmic EGFP and predominantly plasma membrane EGFP-mCD9 localisation in primary KPC cells. Scale bar, 20 μm. Flow cytometry plots and fluorescence imaging shown in (b) and (c) are representative of three biologically independent samples.
d) Organoid formation assay (total organoid area) of KPC organoids upon CD9 overexpression (n = 3 biologically independent experiments). Related to Fig. 4e. Dot plot shows mean, s.d., p < 0.0001, two-sided t test.
e) Schematic of the EGFP control and EGFP-mCD9 overexpression system using an EF1α promoter.
f) Organoid formation assay (organoid number) of KPC organoids upon CD9 overexpression using the EF1α vector (n = 2 biologically independent experiments). p = 0.001, two-sided t test.
g) Organoid formation assay (total organoid area) of KPC organoids upon CD9 overexpression using the EF1α vector (n = 2 biologically independent experiments). p = 0.002, two-sided t test. Dot plots in (f) and (g) show mean, s.d.
Extended Data Fig. 4. Characterisation of KPC CD9 knock-out model.
a) Flow cytometry histogram of cells isolated directly from mouse pancreas of the indicated genotypes after gating on YFP+ cells. CD9 staining confirms heterozygous and complete knockout in CD9Δ/WT and CD9Δ/Δ cells, respectively. Flow cytometry plot is representative of three biologically independent samples.
b) Cd9 mRNA levels measured by RT-qPCR in early passage (<5) KPC organoids of the indicated genotypes (n = 2 biologically independent animals per genotype); cells were isolated from endpoint tumours. Values were normalised to Gapdh and Actb, and fold changes calculated relative to CD9WT/WT cells.
c) Representative histology of KPC pancreases at 8 weeks with indicated CD9 status (in the p53Δ/WT model, median survival of CD9WT/WT mice 17.4 weeks; n = 6, 4 and 8 biologically independent animals for CD9WT/WT, CD9Δ/WT and CD9Δ/Δ, respectively).
d) Stacked bar graph showing quantification of precursor PanIN and PDAC lesions in KPC pancreases at 8 weeks from (c). KPC CD9Δ/WT mice exhibit later onset and/or slower tumour progression.
e) Weight of subcutaneous grafts at endpoint after initial injection of 10,000 KPC CD9Δ/WT or KPC CD9Δ/Δ cells (n = 3 biologically independent animals, from organoid cultures derived from the p53Δ/Δ model at 4 weeks). p = 0.0252, two-sided t test. Dot plot shows mean, s.d.
Extended Data Fig. 5. CD9 facilitates glutamine import into TICs.
a) Co-IP of transiently transfected Myc-MCT1 (left) or Myc-mASCT2 (right) with EGFP-mCD9 after EGFP pull-down in HEK293T cells. Blots are representative of 3 independent experiments. See Source Data for uncropped blots.
b) Flow cytometry plots co-staining CD9 with cell surface proteins involved in metabolism in KPC organoids. Representative of 3 independent experiments.
c) Membrane co-localisation (arrowheads) of ASCT2 and EGFP-CD9 in KPC organoids by co-immunofluorescence. Scale bar, 20 μm; insert 20 by 20 μm.
d) Immunofluorescence of ASCT on sorted CD9low and CD9high KPC cells. Scale bars, 20 μm. Representative of 3 independent experiments.
e) Immunofluorescence of KPF-CD9 organoids after control vehicle or 4-OHT treatment. Representative of 2 independent experiments. Scale bars, 20 μm. Related to Fig. 5e.
f) Immunofluorescence of ASCT2 in a KPCY mouse pancreas: non-transformed area (top) and transformed areas (bottom). Scale bars, 100 μm low mag, 20 μm high mag. Representative of at least 3 biologically independent animals.
g) YFP, CD44, ASCT2 and DAPI staining on pancreatic tissue of a KFCkY mice 1 week (top) and 4 weeks (bottom) post-tamoxifen. Scale bars, 20 μm. Representative of at least 3 biologically independent animals.
h) Metabolic profiles of KPF-CD9 organoids (after control Adeno-EGFP (CD9F/WT) or Adeno-CRE-EGFP (CD9Δ/WT) infection) grown in organoid media containing 4 mM 13C-glutamine for 4 h.
i) Some metabolites, including glycolytic intermediates, are equally abundant under the conditions in (h), but did not contain any detectable 13C label. Data in (h) and (i) represent one experiment carried out with six technical replicates. Due to technical limitations, statistics for metabolite abundance and label incorporation were performed on technical replicates separately using a two-way ANOVA corrected for multiple comparisons using the Holm-Sidak method, α = 0.05; bar charts show mean, s.d.
Extended Data Fig. 6. CD9 facilitates glutamine import into TICs and metabolic compensation in KPC mice.
a) Western blot showing overexpression of ASCT2 in organoids. Blot shown is representative of 2 independent experiments. See Source Data for uncropped blots.
b) Organoid formation assay (total organoid area) of KPF-CD9 organoids after vehicle/Adeno-EGFP or 4-OHT/Adeno-CRE-EGFP treatment in the presence of basal or elevated (4 mM) levels of glutamine, and with control pLV or pLV ASCT2 overexpression (n = 3 biologically independent experiments). Related to Fig. 5h. Black p values (CD9F/WT versus CD9Δ/WT) calculated using two-way ANOVA corrected for multiple comparisons, Holm-Sidak method, α = 0.05. Blue p values (within CD9Δ/WT conditions) calculated using two-way ANOVA corrected for multiple comparisons, Dunnett’s test, α = 0.05. Dot plot shows mean, s.d.
c) Organoid formation assay (total organoid area) of CD9low KPC cells with control pLV or pLV ASCT2 overexpression (n = 3 biologically independent experiments). Related to Fig. 5i. p = 0.0091, two-sided t test. Dot plot shows mean, s.d.
d) Histology of KPC pancreases at 4 weeks with indicated CD9 status (in the p53Δ/Δ model, median survival of CD9WT/WT mice 6.2 weeks). At this timepoint, all mice present with PDAC, regardless of CD9 status. Images are representative of at least 3 biologically independent animals.
e) Slc1a5 mRNA levels measured by RT-qPCR in early passage (<5) KPC organoids of the indicated genotypes (n = 2 biologically independent animals per genotype); cells were isolated from endpoint tumours. Values normalised to Gapdh and Actb; fold changes calculated relative to CD9WT/WT cells.
f) Indicated tetraspanin mRNA levels measured by RT-qPCR in early passage (<5) KPC organoids of the indicated genotypes (n = 2 biologically independent animals per genotype); cells were isolated from endpoint tumours. Values normalised to Gapdh and Actb; fold changes calculated relative to CD9WT/WT cells.
Extended Data Fig. 7. CD9 expression in human PDAC.
a) Co-IP of endogenous CD9 with endogenous ASCT2 after ASCT2 pull-down in the human pancreatic cancer cell line PANC-1. Input, left, 10% polyacrylamide gel; Co-IP, right, 20% polyacrylamide gel to separate bands from IgG heavy and light chains (asterisks). Blot representative of 2 independent experiments. See Source Data for uncropped blots.
b) Co-immunofluorescence for CD9 and ASCT2 on human PDAC, showing punctate CD9 at the plasma membrane, with high levels of ASCT2 in CD9high cells; scale bars, 20 μm. Data are representative of 3 biologically independent human samples.
c) Flow cytometry plots co-staining CD9 with other PDAC CSC cell surface proteins in primary human PDAC organoid culture. CD9 gate separates CD9high cells from bulk; gates on the x-axis separate marker-positive from marker-negative cells (based on fluorescence minus one controls). Plots are representative of 3 biologically independent primary organoid lines.
Supplementary Material
Acknowledgements
We would like to thank D. Saur for providing the Pdx1-Flp, Trp53 FRT and FSF-KRasG12D mice, I. Malanchi and M. Yuneva for comments on the manuscript, C. Cremona for help in preparing the manuscript, the Yuneva lab for advice on organoid metabolomics and the V-9302 inhibitor, R. Mitter and S. Boeing from the Bioinformatics and Statistics Service at the Francis Crick Institute, K. Miyado for the EGFP-mCD9 fusion construct, A. Prachalias, C. Cotoi, Y. Zen and A. Zamalloa for coordinating and providing the human samples used in this study, technicians from the Biological Research Facility at the Francis Crick Institute, and all other Behrens lab members for their feedback. T.E. was supported by a doctoral clinical fellowship from a CRUK Accelerator Award (C422/A23614). This work was supported by the Francis Crick Institute, which receives its core funding from Cancer Research UK (FC001039), the UK Medical Research Council (FC001039), and the Wellcome Trust (FC001039).
Footnotes
Author contributions
Conceptualization: R.M.M.F., V.M-Y.W., A.B.; Methodology: R.M.M.F., V.M-Y.W., A.B.; Software: D.J.B.; Formal Analysis: R.M.M.F., V.M-Y.W., N.L., A.P.S., E.H., E.L.N., J.I.M.; Investigation: R.M.M.F., V.M-Y.W., J.A., T.E., M.Z.T., N.L., D.F., J.C.; Writing – original draft: R.M.M.F., V.M-Y.W.; Writing – review and editing: R.M.M.F., V.M-Y.W., A.P.S., J.I.M., A.B.; Visualization: R.M.M.F., V.M-Y.W., N.L., D.F., D.J.B.; Supervision: A.B.; Funding Acquisition: A.B. All authors approved the content of the manuscript. J.A., T.E., M.Z.T. and N.L. contributed equally.
Competing interests
The authors declare no competing interests.
References
- 1.Cronin KA, et al. Annual Report to the Nation on the Status of Cancer, part I: National cancer statistics. Cancer. 2018;124:2785–2800. doi: 10.1002/cncr.31551. [DOI] [PMC free article] [PubMed] [Google Scholar]
- 2.Neoptolemos JP, et al. Therapeutic developments in pancreatic cancer: current and future perspectives. Nature Reviews Gastroenterology & Hepatology. 2018;15:333–348. doi: 10.1038/s41575-018-0005-x. [DOI] [PubMed] [Google Scholar]
- 3.Dagogo-Jack I, Shaw AT. Tumour heterogeneity and resistance to cancer therapies. Nature Reviews Clinical Oncology. 2017;15:81. doi: 10.1038/nrclinonc.2017.166. [DOI] [PubMed] [Google Scholar]
- 4.Maddipati R, Stanger BZ. Pancreatic Cancer Metastases Harbor Evidence of Polyclonality. Cancer Discovery. 2015;5:1086–1097. doi: 10.1158/2159-8290.CD-15-0120. [DOI] [PMC free article] [PubMed] [Google Scholar]
- 5.Kreso A, Dick JE. Evolution of the cancer stem cell model. Cell Stem Cell. 2014;14 doi: 10.1016/j.stem.2014.02.006. [DOI] [PubMed] [Google Scholar]
- 6.Li C, et al. Identification of Pancreatic Cancer Stem Cells. Cancer Research. 2007;67:1030–1037. doi: 10.1158/0008-5472.CAN-06-2030. [DOI] [PubMed] [Google Scholar]
- 7.Li C, et al. c-Met Is a Marker of Pancreatic Cancer Stem Cells and Therapeutic Target. Gastroenterology. 2011;141:2218–2227. doi: 10.1053/j.gastro.2011.08.009. [DOI] [PubMed] [Google Scholar]
- 8.Hermann PC, et al. Distinct Populations of Cancer Stem Cells Determine Tumor Growth and Metastatic Activity in Human Pancreatic Cancer. Cell Stem Cell. 2007;1:313–323. doi: 10.1016/j.stem.2007.06.002. [DOI] [PubMed] [Google Scholar]
- 9.Fox RG, et al. Image-based detection and targeting of therapy resistance in pancreatic adenocarcinoma. Nature. 2016;534:407–411. doi: 10.1038/nature17988. [DOI] [PMC free article] [PubMed] [Google Scholar]
- 10.Bailey JM, et al. DCLK1 Marks a Morphologically Distinct Subpopulation of Cells With Stem Cell Properties in Preinvasive Pancreatic Cancer. Gastroenterology. 2014;146:245–256. doi: 10.1053/j.gastro.2013.09.050. [DOI] [PMC free article] [PubMed] [Google Scholar]
- 11.Abel EV, et al. HNF1A is a novel oncogene that regulates human pancreatic cancer stem cell properties. eLife. 2018;7:e33947. doi: 10.7554/eLife.33947. [DOI] [PMC free article] [PubMed] [Google Scholar]
- 12.Barker N, et al. Crypt stem cells as the cells-of-origin of intestinal cancer. Nature. 2009;457:608–611. doi: 10.1038/nature07602. [DOI] [PubMed] [Google Scholar]
- 13.Ferreira RMM, et al. Duct- and Acinar-Derived Pancreatic Ductal Adenocarcinomas Show Distinct Tumor Progression and Marker Expression. Cell Reports. 2017;21:966–978. doi: 10.1016/j.celrep.2017.09.093. [DOI] [PMC free article] [PubMed] [Google Scholar]
- 14.Went PT, et al. Frequent EpCam protein expression in human carcinomas. Human pathology. 2004;35:122–128. doi: 10.1016/j.humpath.2003.08.026. [DOI] [PubMed] [Google Scholar]
- 15.Cruz-Monserrate Z, et al. Detection of pancreatic cancer tumours and precursor lesions by cathepsin E activity in mouse models. Gut. 2012;61:1315–1322. doi: 10.1136/gutjnl-2011-300544. [DOI] [PMC free article] [PubMed] [Google Scholar]
- 16.Uhlen M, et al. Proteomics. Tissue-based map of the human proteome. Science. 2015;347 doi: 10.1126/science.1260419. 1260419. [DOI] [PubMed] [Google Scholar]
- 17.Bardeesy N, et al. Both p16-Ink4a and the p19-Arf-p53-pathway constrain progression of pancreatic adenocarcinoma in the mouse. Proceedings of the National Academy of Sciences. 2006;103:5947–5952. doi: 10.1073/pnas.0601273103. [DOI] [PMC free article] [PubMed] [Google Scholar]
- 18.Hemler ME. Tetraspanin proteins promote multiple cancer stages. Nature Reviews Cancer. 2014;14:49–60. doi: 10.1038/nrc3640. [DOI] [PubMed] [Google Scholar]
- 19.Huch M, et al. Unlimited in vitro expansion of adult bi-potent pancreas progenitors through the Lgr5/R-spondin axis. The EMBO Journal. 2013;32:2708–2721. doi: 10.1038/emboj.2013.204. [DOI] [PMC free article] [PubMed] [Google Scholar]
- 20.Malanchi I, et al. Interactions between cancer stem cells and their niche govern metastatic colonization. Nature. 2012;481:85–U95. doi: 10.1038/nature10694. [DOI] [PubMed] [Google Scholar]
- 21.Reya T, Morrison SJ, Clarke MF, Weissman IL. Stem cells, cancer, and cancer stem cells. Nature. 2001;414:105–111. doi: 10.1038/35102167. [DOI] [PubMed] [Google Scholar]
- 22.Hotz B, et al. Epithelial to Mesenchymal Transition: Expression of the Regulators Snail, Slug, and Twist in Pancreatic Cancer. Clinical Cancer Research. 2007;13:4769–4776. doi: 10.1158/1078-0432.CCR-06-2926. [DOI] [PubMed] [Google Scholar]
- 23.Zheng X, et al. Epithelial-to-mesenchymal transition is dispensable for metastasis but induces chemoresistance in pancreatic cancer. Nature. 2015;527:525. doi: 10.1038/nature16064. [DOI] [PMC free article] [PubMed] [Google Scholar]
- 24.Rhim AD, et al. EMT and dissemination precede pancreatic tumor formation. Cell. 2012;148:349–361. doi: 10.1016/j.cell.2011.11.025. [DOI] [PMC free article] [PubMed] [Google Scholar]
- 25.Miyado K, et al. The fusing ability of sperm is bestowed by CD9-containing vesicles released from eggs in mice. Proceedings of the National Academy of Sciences. 2008;105:12921–12926. doi: 10.1073/pnas.0710608105. [DOI] [PMC free article] [PubMed] [Google Scholar]
- 26.Skarnes WC et al. A conditional knockout resource for the genome-wide study of mouse gene function. Nature. 2011;474:337–342. doi: 10.1038/nature10163. [DOI] [PMC free article] [PubMed] [Google Scholar]
- 27.Charrin S, et al. The Major CD9 and CD81 Molecular Partner: Identification and Characterization of the Complexes. Journal of Biological Chemistry. 2001;276:14329–14337. doi: 10.1074/jbc.M011297200. [DOI] [PubMed] [Google Scholar]
- 28.Le Naour F, et al. Profiling of the tetraspanin web of human colon cancer cells. Molecular & Cellular Proteomics. 2006;5:845–857. doi: 10.1074/mcp.M500330-MCP200. [DOI] [PubMed] [Google Scholar]
- 29.Kovalenko OV, Yang X, Kolesnikova TV, Hemler ME. Evidence for specific tetraspanin homodimers: inhibition of palmitoylation makes cysteine residues available for cross-linking. Biochemical Journal. 2004;377:407–417. doi: 10.1042/BJ20031037. [DOI] [PMC free article] [PubMed] [Google Scholar]
- 30.Xu D, Hemler ME. Metabolic activation-related CD147-CD98 complex. Molecular & Cellular Proteomics. 2005;4:1061–1071. doi: 10.1074/mcp.M400207-MCP200. [DOI] [PMC free article] [PubMed] [Google Scholar]
- 31.Son J, et al. Glutamine supports pancreatic cancer growth through a KRAS-regulated metabolic pathway. Nature. 2013;496:101–105. doi: 10.1038/nature12040. [DOI] [PMC free article] [PubMed] [Google Scholar]
- 32.Schonhuber N, et al. A next-generation dual-recombinase system for time- and host-specific targeting of pancreatic cancer. Nature medicine. 2014;20:1340–1347. doi: 10.1038/nm.3646. [DOI] [PMC free article] [PubMed] [Google Scholar]
- 33.Kaira K, et al. Clinicopathological significance of ASC amino acid transporter-2 expression in pancreatic ductal carcinoma. Histopathology. 2015;66:234–243. doi: 10.1111/his.12464. [DOI] [PubMed] [Google Scholar]
- 34.Biancur DE, et al. Compensatory metabolic networks in pancreatic cancers upon perturbation of glutamine metabolism. Nature Communications. 2017;8 doi: 10.1038/ncomms15965. 15965. [DOI] [PMC free article] [PubMed] [Google Scholar]
- 35.Schulte ML, et al. Pharmacological blockade of ASCT2-dependent glutamine transport leads to antitumor efficacy in preclinical models. Nature Medicine. 2018;24:194. doi: 10.1038/nm.4464. [DOI] [PMC free article] [PubMed] [Google Scholar]
- 36.Cerami E, et al. The cBio cancer genomics portal: an open platform for exploring multidimensional cancer genomics data. Cancer Discov. 2012;2:401–404. doi: 10.1158/2159-8290.CD-12-0095. [DOI] [PMC free article] [PubMed] [Google Scholar]
- 37.Witkiewicz AK, et al. Whole-exome sequencing of pancreatic cancer defines genetic diversity and therapeutic targets. Nat Commun. 2015;6 doi: 10.1038/ncomms7744. 6744. [DOI] [PMC free article] [PubMed] [Google Scholar]
- 38.Mueller S, et al. Evolutionary routes and KRAS dosage define pancreatic cancer phenotypes. Nature. 2018;554:62–68. doi: 10.1038/nature25459. [DOI] [PMC free article] [PubMed] [Google Scholar]
- 39.Kim MP, et al. ALDH Activity Selectively Defines an Enhanced Tumor-Initiating Cell Population Relative to CD133 Expression in Human Pancreatic Adenocarcinoma. PLOS ONE. 2011;6:e20636. doi: 10.1371/journal.pone.0020636. [DOI] [PMC free article] [PubMed] [Google Scholar]
- 40.Miranda-Lorenzo I, et al. Intracellular autofluorescence: a biomarker for epithelial cancer stem cells. Nature Methods. 2014;11:1161–1169. doi: 10.1038/nmeth.3112. [DOI] [PubMed] [Google Scholar]
- 41.Dosch JS, Ziemke EK, Shettigar A, Rehemtulla A, Sebolt-Leopold JS. Cancer Stem Cell Marker Phenotypes Are Reversible and Functionally Homogeneous in a Preclinical Model of Pancreatic Cancer. Cancer Research. 2015;75:4582–4592. doi: 10.1158/0008-5472.CAN-14-2793. [DOI] [PMC free article] [PubMed] [Google Scholar]
- 42.Zeng A, et al. Prospectively Isolated Tetraspanin-Positive Neoblasts Are Adult Pluripotent Stem Cells Underlying Planaria Regeneration. Cell. 2018;173:1593–1608. doi: 10.1016/j.cell.2018.05.006. [DOI] [PMC free article] [PubMed] [Google Scholar]
- 43.Kwon Hyog Y, et al. Tetraspanin 3 Is Required for the Development and Propagation of Acute Myelogenous Leukemia. Cell Stem Cell. 2015;17:152–164. doi: 10.1016/j.stem.2015.06.006. [DOI] [PMC free article] [PubMed] [Google Scholar]
- 44.Wang GP, Han XF. CD9 modulates proliferation of human glioblastoma cells via epidermal growth factor receptor signaling. Molecular Medicine Reports. 2015;12:1381–1386. doi: 10.3892/mmr.2015.3466. [DOI] [PubMed] [Google Scholar]
- 45.Copeland BT, Bowman MJ, Boucheix C, Ashman LK. Knockout of the tetraspanin Cd9 in the TRAMP model of de novo prostate cancer increases spontaneous metastases in an organ-specific manner. International Journal of Cancer. 2013;133:1803–1812. doi: 10.1002/ijc.28204. [DOI] [PubMed] [Google Scholar]
- 46.Tang M, et al. Downregulation of CD9 promotes pancreatic cancer growth and metastasis through upregulation of epidermal growth factor on the cell surface. Oncology Reports. 2015;34:350–358. doi: 10.3892/or.2015.3960. [DOI] [PubMed] [Google Scholar]
- 47.Grønborg M, et al. Biomarker Discovery from Pancreatic Cancer Secretome Using a Differential Proteomic Approach. Molecular & Cellular Proteomics. 2006;5:157–171. doi: 10.1074/mcp.M500178-MCP200. [DOI] [PubMed] [Google Scholar]
- 48.Shi Y, et al. Tetraspanin CD9 stabilizes gp130 by preventing its ubiquitin-dependent lysosomal degradation to promote STAT3 activation in glioma stem cells. Cell death and differentiation. 2017;24:167–180. doi: 10.1038/cdd.2016.110. [DOI] [PMC free article] [PubMed] [Google Scholar]
- 49.Podergajs N, et al. Transmembrane protein CD9 is glioblastoma biomarker, relevant for maintenance of glioblastoma stem cells. Oncotarget. 2016;7:593–609. doi: 10.18632/oncotarget.5477. [DOI] [PMC free article] [PubMed] [Google Scholar]
- 50.Yamazaki H, et al. Regulation of cancer stem cell properties by CD9 in human B-acute lymphoblastic leukemia. Biochemical and Biophysical Research Communications. 2011;409:14–21. doi: 10.1016/j.bbrc.2011.04.098. [DOI] [PubMed] [Google Scholar]
- 51.Kamphorst JJ, et al. Human Pancreatic Cancer Tumors Are Nutrient Poor and Tumor Cells Actively Scavenge Extracellular Protein. Cancer Research. 2015;75:544–553. doi: 10.1158/0008-5472.CAN-14-2211. [DOI] [PMC free article] [PubMed] [Google Scholar]
- 52.Roux C, et al. Endogenous glutamine decrease is associated with pancreatic cancer progression. Oncotarget. 2017;8:95361–95376. doi: 10.18632/oncotarget.20545. [DOI] [PMC free article] [PubMed] [Google Scholar]
- 53.Seo J-W, et al. Autophagy is required for PDAC glutamine metabolism. Scientific Reports. 2016;6 doi: 10.1038/srep37594. 37594. [DOI] [PMC free article] [PubMed] [Google Scholar]
- 54.Commisso C, et al. Macropinocytosis of protein is an amino acid supply route in Ras-transformed cells. Nature. 2013;497:633. doi: 10.1038/nature12138. [DOI] [PMC free article] [PubMed] [Google Scholar]
Associated Data
This section collects any data citations, data availability statements, or supplementary materials included in this article.


