

ABSTRACT
Background
Mediterranean diets limit red meat consumption and increase intakes of high-phytate foods, a combination that could reduce iron status. Conversely, higher intakes of fish, a good source of selenium, could increase selenium status.
Objectives
A 1-y randomized controlled trial [New Dietary Strategies Addressing the Specific Needs of the Elderly Population for Healthy Aging in Europe (NU-AGE)] was carried out in older Europeans to investigate the effects of consuming a Mediterranean-style diet on indices of inflammation and changes in nutritional status.
Methods
Selenium and iron intakes and status biomarkers were measured at baseline and after 1 y in 1294 people aged 65–79 y from 5 European countries (France, Italy, the Netherlands, Poland, and the United Kingdom) who had been randomly allocated either to a Mediterranean-style diet or to remain on their habitual, Western diet.
Results
Estimated selenium intakes increased significantly with the intervention group (P < 0.01), but were not accompanied by changes in serum selenium concentrations. Iron intakes also increased (P < 0.001), but there was no change in iron status. However, when stratified by study center, there were positive effects of the intervention on iron status for serum ferritin for participants in Italy (P = 0.04) and France (P = 0.04) and on soluble transferrin receptor (sTfR) for participants in Poland (P < 0.01). Meat intake decreased and fish intake increased to a greater degree in the intervention group, relative to the controls (P < 0.01 for both), but the overall effects of the intervention on meat and fish intakes were mainly driven by data from Poland and France. Changes in serum selenium in the intervention group were associated with greater changes in serum ferritin (P = 0.01) and body iron (P = 0.01), but not sTfR (P = 0.73); there were no study center × selenium status interactions for the iron biomarkers.
Conclusions
Consuming a Mediterranean-style diet for 1 y had no overall effect on iron or selenium status, although there were positive effects on biomarkers of iron status in some countries. The NU-AGE trial was registered at clinicaltrials.gov as NCT01754012.
Keywords: Mediterranean-style diet, randomized controlled trial, iron, selenium, meat, fish, elderly, Europeans
Introduction
A Mediterranean dietary pattern (MD) is widely recommended for the prevention of chronic diseases (1, 2). Although only a few studies have estimated the nutritional value of the Mediterranean diet, they consistently report that higher adherence results in higher iron intakes (3–5). However, serum ferritin concentrations, a marker of body iron stores, were reported to be 2-fold lower in Crete (Southern Europe) than Zutphen (Northern Europe) (6), suggesting that higher iron intakes from a Mediterranean diet do not necessarily result in higher iron statuses. In elderly Spanish people consuming a Mediterranean (Atlantic) diet, there was a positive association between meat intake and hemoglobin concentration, indicating a key role for meat in iron nutrition (7).
In the United States, it has been estimated that approximately 11% of men and 10% of women aged 65 and above are anemic (8). Although physiological iron requirements do not differ between adults and the elderly, chronic low-grade inflammation, common in old age, reduces iron absorption through hepcidin regulation. The soluble transferrin receptor (sTfR)-ferritin index appears to be the most useful method for identifying iron deficiencies in older people (9).
The Mediterranean diet is associated with higher intakes of fish, among the richest sources of dietary selenium, and it has been reported that 15% of the variance in plasma selenium in subjects aged 69 y or over was explained by fish consumption (10). Low selenium intakes have been implicated in the development of sarcopenia (11), and selenium may modulate susceptibility to pathogens and provide immune defenses against microbes (12), both of which are especially important for elderly people.
We hypothesized that a Mediterranean diet with limited intakes of red and processed meat, an important supply of bioavailable iron (13), together with a higher consumption of whole-grain cereals and nuts containing phytate, which inhibits iron absorption (14, 15), would result in lower iron status. Conversely, higher intakes of fish, a good source of selenium (16, 17), could increase selenium status. It has been reported that lower serum selenium concentrations are associated with anemia in older women (18); therefore, we examined associations between iron and selenium status. We tested these hypotheses using dietary and biochemical data from the New Dietary Strategies Addressing the Specific Needs of the Elderly (NU-AGE) study, whose primary aim was to test the effects of consuming an MD for 1 y on inflammatory responses in elderly Europeans, with 15 prespecified secondary outcomes, including the effects of the intervention on nutritional status. In this 1-y randomized controlled trial (RCT), a total of 1294 people aged 65–79 y from 5 European countries (France, Italy, the Netherlands, Poland, and the United Kingdom) were randomly allocated to an intervention (MD) or control group (19, 20).
Methods
The NU-AGE trial was conducted in 5 European centers (Bologna in Italy, Norwich in the United Kingdom, Wageningen in the Netherlands, Warsaw in Poland, and Clermont Ferrand in France). A detailed description of the European Commission–funded NU-AGE project has been reported elsewhere (19, 20). In summary, 1294 participants aged 65–79 y were recruited through local advertisements, media publicity, and general practitioner surgeries between April 2012 and January 2014 to a 1-y dietary RCT. Study participants were free-living and responsible for their own dietary choices. Ineligibility criteria included any clinically diagnosed chronic disease; the use of corticosteroids or insulin medications; the recent use of antibiotics or vaccinations; a recent change in habitual medication; the presence of a food allergy or intolerance, necessitating a special diet; the presence of frailty, according to the Fried criteria (21); or malnutrition (defined as a BMI <18.5 kg/m2 or a >10% weight loss in the previous 6 mo). Using a computer program, participants were randomly allocated to the intervention or control group (1:1 allocation ratio) after stratification by gender, age, frailty status (pre-frail or non-frail), and BMI. Technicians performing laboratory analyses were blinded to the group assignment, but researchers carrying out dietary assessments were not, due to practical impossibilities, including the fact that the participants themselves knew to which group they were assigned.
Dietary intervention
Participants randomly assigned to the intervention group received individually tailored dietary advice in order to meet the study dietary requirements, as has been described previously (20, 22). This individually tailored dietary advice, either given face-to-face or by telephone by a trained dietitian/research nutritionist, was administered 9 times during the year and supported by mail or e-mail. To enhance compliance and meet the dietary guidelines, participants in the intervention group received commercially available foods, including whole-grain pasta; extra virgin olive oil; low-fat, low-salt cheese; high–polyunsaturated fat margarine; and vitamin D supplements (10 µg/d). Adherence was monitored at Months 4 and 8 with the use of 3-d food diaries and the return of unused vitamin D supplements. Participants randomly assigned to the control group were requested to continue with their usual diet for the year and provided with a generally available leaflet that outlined current dietary guidance.
Dietary assessment
Dietary intake and compliance to the intervention were evaluated by means of 7-d food records at the start and end of the 1-y intervention. Participants received face-to-face training in keeping complete and accurate food records, as well as written instructions regarding the level of detail required to describe foods and amounts consumed, including the name of the food, preparation methods, recipes for mixed foods, and portion sizes. At baseline and follow-up, food records were reviewed during a 1-h interview with a trained dietitian/research nutritionist. Nutrient intake was estimated by the use of local food composition tables from France (23), Italy (24), the Netherlands (25), Poland (26), and the United Kingdom (27). Data for selenium intakes were not available for participants from Poland and France.
Blood sampling and storage
Blood samples were obtained after participants had fasted (at least 8 h) and had avoided heavy exercise and alcohol in the prior 24 h. Samples were centrifuged after sitting for 30 min at room temperature, then were aliquoted and stored at −80°C until analysis.
Biochemical analysis
Serum iron, ferritin, sTfR, and α1 acid glycoprotein (AGP) were measured using the COBAS system (Roche Diagnostics). We measured sTfR and AGP by immunoturbidimetric assay, performed on the c501 analyzer. The inter-assay CV for sTfR was <6.0% across the range between 0.5–40.0 mg/L and the inter-assay CV for AGP was <2.7% across the range between 0.1–4.0 g/L. Ferritin was measured by electro-chemiluminescence immunoassay on the c601 analyzer. The inter-assay CV for ferritin was <4.2% across the range between 0.5–2000 µg/L. C-reactive protein (CRP) was measured by ProcartaPlexTM Immunoassay (eBioscience), performed using Luminex 200 instrumentation (Luminex Corporation), according to the manufacturer's instructions.
Serum selenium was measured using a Platform XS Inductively Coupled Plasma Mass Spectrometer (ICP-MS; Micromass), with a plasma gas (argon) nebulizer flow rate of 1.0 L/min. Helium (flow 10 mL/min) and hydrogen (flow 1.0 mL/min) were used as hexapole/reaction cell gases, to facilitate the in-cell reaction and minimize spectral interferences from argon-based molecular ions (28). Elemental selenium was monitored at a mass-to-charge ratio of 80. Prior to analysis, 50 µL of serum samples, standards, and quality controls were diluted with 2450 µL of a pre-treatment solution consisting of rhodium internal standard (Fisher Scientific) in 2% nitric acid: water (v/v). Rhodium was monitored at a mass-to-charge ratio of 103. The pre-treated samples were infused into the ICP-MS at 1 mL/min, using a Gilson Minipuls 3 peristaltic pump (Villiers le Bel). Matrix-matched selenium calibrators were prepared by spiking certified, National Institute of Standards and Technology traceable, pure selenium standard (SPEX CertiPrep) into fetal calf serum, to produce a 4-point calibration curve over the analytical range of 0.1–3.17 µmol/L. Assay performance was assessed with the use of internal quality controls (Trace Elements Serum Controls NR and HR, UTAK Laboratories) included in each batch of analysis. The inter- and intra-assay CVs were ≤2.0% and ≤9.4%, respectively.
Ethics approval
Local ethical approval was provided by the Independent Ethics Committee of the Sant'Orsola-Malpighi Hospital Bologna (Italy), the National Research Ethics Committee–East of England (United Kingdom), the Wageningen University Medical Ethics Committee (Netherlands), the Bioethics Committee of the Polish National Food and Nutrition Institute (Poland), and the South-East 6 Person Protection Committee (France). All study procedures were in accordance with the ethical standards of the Helsinki Declaration. All participants gave informed consent before participating. The trial was registered at clinicaltrials.gov (NCT01754012).
Statistical analysis
We used a linear regression approach to adjust ferritin concentrations by CRP, AGP, and sTfR by AGP, following the recommendations of the Biomarkers Reflecting Inflammation and Nutritional Determinants of Anemia (BRINDA) project, using the maximum value of the lowest CRP (0.2 mg/L) or AGP (0.5 g/L) decile at baseline as the reference value (29). Body iron was calculated using the adjusted values of ferritin and sTfR.
In cross-sectional analyses of baseline data, we used regression models to assess differences in biomarkers of iron status, selenium status, and dietary intake, by study center. If an overall significant difference between study centers was found, we tested the individual associations between each center, adjusting for multiple testing using the Benjamini and Hochberg method for false discovery rate. We also examined the associations between biomarkers of iron and selenium status and dietary intakes, and between selenium and iron biomarkers. All models were adjusted for sex, age, BMI, and smoking status.
Between-intervention group differences in participant characteristics were assessed using independent sample t-tests. The effect of the intervention on biomarkers of iron and selenium status and dietary intake were assessed using linear mixed-effect models, with participant included as a random effect, time, treatment group, time x treatment group interaction, and the explanatory variables study center, age, sex, baseline BMI, and smoking status. For each variable, we tested for an interaction with sex; where we found a significant interaction, we conducted a stratified analysis. In a sensitivity analysis, we performed multiple imputations of missing data using Markov-chain Monte Carlo methods with 17 imputations (equal to the maximum percentage of incomplete cases), in order to conduct an intention-to-treat analysis. We examined the 1-y change in iron status by each quintile of change in serum selenium using an ANCOVA adjusted for intervention group, study center, age, sex, baseline BMI, and smoking status. All analyses were performed using STATA (version 15; StataCorp).
Results
Cross-sectional analysis of baseline data
Of the 1294 participants recruited to the NU-AGE study, 1142 completed the study (11.7% drop-out rate; Figure 1; Table 1). Participants in the United Kingdom (44 mg/d) and the Netherlands (45 mg/d) had significantly higher selenium intakes, compared to those in Italy (38 mg/d), at baseline; data were not available for participants in Poland or France (Figure 2). Meat intakes were significantly higher for participants in Poland (111 g/d) and France (111 g/d), in comparison to those at the other study centers (P < 0.01), but there were no between-center differences in fish intakes (P = 0.79) at baseline (Figure 2). A comparison of the standardized β coefficients representing the relationship between selenium intake and foods rich in selenium showed that meat, poultry, fish, and cereals had the greatest associations with selenium intake; there was no significant association between the intake of nuts and selenium intake (Table 2). Fish intake explained 18.3% of the variation in selenium intakes, with red meat, poultry, cereals, and dairy each contributing ≤3% (Table 2).
FIGURE 1.

Flow chart of participants in the New Dietary Strategies Addressing the Specific Needs of the Elderly Population for Healthy Aging in Europe (NU-AGE) trial. AGP, ɑ1 acid glycoprotein; CRP, C-reactive protein; sTfR, soluble transferrin receptor.
TABLE 1.
Baseline characteristics of the NU-AGE study participants, according to intervention group1
| Intervention group | Control group | ||||
|---|---|---|---|---|---|
| n | Mean ± SD or n (%) | n | Mean ± SD or n (%) | P | |
| Sex, female | 568 | 321 ± 56.5 | 574 | 312 ± 54.4 | 0.463 |
| Age, y | 568 | 70.7 ± 4.0 | 574 | 71.0 ± 3.9 | 0.100 |
| BMI, kg/m2 | 568 | 26.7 ± 4.1 | 574 | 26.6 ± 3.7 | 0.712 |
| Serum ferritin, μg/L | 557 | 139 ± 139 | 561 | 134 ± 104 | 0.433 |
| Soluble transferrin receptor, mg/L | 561 | 5.4 ± 1.6 | 566 | 5.4 ± 1.3 | 0.916 |
| Body iron, mg/kg | 557 | 9.4 ± 3.1 | 561 | 9.2 ± 3.1 | 0.339 |
| Serum selenium, μmol/L | 534 | 1.2 ± 0.3 | 542 | 1.1 ± 0.3 | 0.022 |
| CRP, mg/L | 563 | 1.7 ± 2.3 | 566 | 1.8 ± 2.4 | 0.539 |
| AGP, g/L | 561 | 0.7 ± 0.2 | 566 | 0.7 ± 0.2 | 0.464 |
| Iron deficiency,2 yes | 563 | 7 (1.2) | 569 | 6 (1.1) | 0.766 |
| Inflammation,3 yes | 567 | 58 (10.2) | 573 | 66 (11.5) | 0.485 |
| Iron intake, mg/d | 565 | 11.9 ± 3.6 | 572 | 12.5 ± 3.9 | 0.009 |
| Selenium intake,4 μg/d | 365 | 42.0 ± 15.3 | 365 | 43.1 ± 16.7 | 0.349 |
| Meat intake, g/d | 565 | 86.2 ± 48.5 | 572 | 88.0 ± 52.0 | 0.532 |
| Fish intake, g/d | 565 | 35.8 ± 29.7 | 572 | 36.0 ± 33.0 | 0.937 |
n = 1142. P values were calculated using independent sample t-tests or chi-squared test for categorical data. AGP, ɑ1 acid glycoprotein; CRP, C-reactive protein; NU-AGE, New Dietary Strategies Addressing the Specific Needs of the Elderly Population for Healthy Aging in Europe.
Defined as serum ferritin <15 μg/L.
Defined as a CRP concentration >5 mg/L and/or AGP concentration >1 g/L.
Selenium intakes were not available for the Polish and French cohorts.
FIGURE 2.
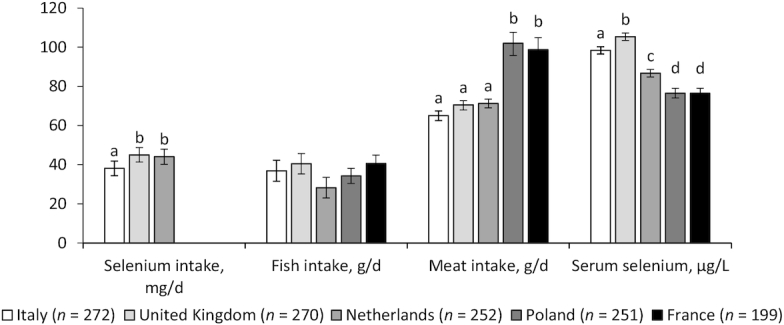
Baseline biomarkers of selenium intake and status by study center in 1244 men and women aged 65–79 y. Values are means (error bars show 95% CIs), adjusted for age, sex, baseline BMI, and smoking status. Data were missing for 449 selenium intake and 65 serum selenium values. Bars sharing a letter were not significantly different after adjustment for multiple testing (q > 0.05), and were only tested where there was an overall significant difference between countries (P < 0.05, ANCOVA).
TABLE 2.
Standardized associations between intake of foods rich in selenium, selenium intakes, and selenium status at baseline1
| n | β (95% CI) | P | R 2 | |
|---|---|---|---|---|
| Selenium intake, μg/d | ||||
| Meat, g/d | 794 | 0.13 (0.06–0.20) | <0.01 | 1.6% |
| Red and processed meat, g/d | 794 | 0.04 (−0.03 to 0.11) | 0.32 | 0.2% |
| Poultry, g/d | 794 | 0.17 (0.10–0.24) | <0.01 | 2.2% |
| Fish, g/d | 794 | 0.45 (0.39–0.52) | <0.01 | 18.3% |
| Cereal, g/d | 794 | 0.15 (0.08–0.22) | <0.01 | 2.4% |
| Nuts and seeds, g/d | 794 | 0.06 (−0.01 to 0.13) | 0.08 | 0.2% |
| Dairy, g/d | 794 | 0.07 (0.00–0.14) | 0.05 | 1.1% |
| Serum selenium, μmol/L | ||||
| Selenium intakes, μg/d | 767 | 0.20 (0.13–0.27) | <0.01 | 2.8% |
| Meat, g/d | 1176 | 0.03 (−0.02 to 0.09) | 0.27 | 1.4% |
| Red and processed meat, g/d | 1176 | −0.01 (−0.06 to 0.05) | 0.78 | 2.3% |
| Poultry, g/d | 1176 | 0.07 (0.02–0.12) | 0.01 | 0.1% |
| Fish, g/d | 1176 | 0.16 (0.11–0.21) | <0.01 | 2.6% |
| Cereal, g/d | 1176 | −0.14 (−0.20 and −0.08) | <0.01 | 5.7% |
| Nuts and seeds, g/d | 1176 | 0.06 (0.01–0.11) | 0.02 | 0.6% |
| Dairy, g/d | 1176 | 0.11 (0.06–0.16) | <0.01 | 1.2% |
Values are the standardized β coefficients (95% CIs) relating to the difference in selenium intake or status per 1 SD difference in the intake of foods rich in selenium, after adjustment for study center, age, sex, baseline BMI, and smoking status, n = 1176. The R2 values represent the variance in selenium intakes or status explained by each variable. P values were calculated using linear regression models. Selenium intakes were not available for the Polish and French cohorts.
There were significant differences in baseline serum selenium concentrations between study centers (Figure 2). The highest serum selenium concentrations were found in participants in the United Kingdom (1.33 μmol/L, 95% CI: 1.31–1.36) and the lowest concentrations were in participants in Poland (0.97 μmol/L, 95% CI: 0.94–1.00) and France (0.97 μmol/L, 95% CI: 0.94–1.00). There was a significant association between selenium intake and serum selenium (P < 0.01), although selenium intake only explained 3% of the variation in serum selenium concentrations (Table 2). There was a significant intake × study center interaction (P < 0.01, data not shown) for selenium intakes, with significant positive associations at baseline in participants in the United Kingdom (P < 0.01) and the Netherlands (P = 0.01), but not those in Italy (P = 0.18), after adjustment for sex, age, smoking status, and BMI (Figure 3). Intakes of poultry, fish, cereals, and dairy were significantly associated with selenium status, although they explained a relatively small amount of the variation (0.1%, 2.6%, 5.7%, and 1.2%, respectively; Table 2).
FIGURE 3.

Associations between selenium intake and serum selenium status at baseline in 767 men and women aged 65–79 y, by study center. The scatter plots represent the association of selenium intake with serum selenium status. The regression lines and P values were calculated from linear regression, and r indicates a partial correlation coefficient. All models were adjusted for age, sex, baseline BMI, and smoking status.
Baseline serum ferritin concentrations (P < 0.01) and calculated body iron (P < 0.01) were highest in participants in France and lowest in those in the United Kingdom (Figure 4). No significant differences between countries were observed for sTfR (P = 0.86). Estimated mean dietary intakes of iron were highest in participants in France (13.7 mg/d) and lowest in those in the Netherlands (10.8 mg/d; P < 0.01; Figure 4). There was no association between total iron intake and body iron (Table 3). Higher meat intake was associated with higher concentrations of serum ferritin (P < 0.01) and body iron (P < 0.01), but explained only 1.5 to 2.5% of the variation.
FIGURE 4.
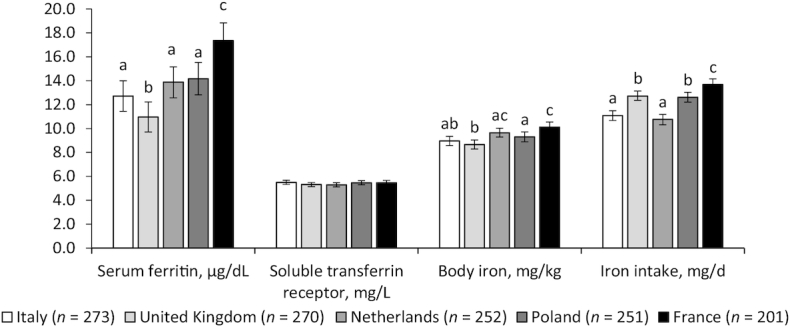
Baseline biomarkers of iron intake and status by study center in 1247 men and women aged 65–79 y. Values are means (error bars indicate 95% CIs), adjusted for age, sex, baseline BMI, and smoking status. Serum ferritin values were adjusted for CRP, AGP, and sTfR for AGP, using a regression correction. Body iron was calculated using inflammation-adjusted values for ferritin and sTfR. Data were missing for 118 serum ferritin and body iron and 15 sTfR values. Bars sharing a letter were not significantly different after adjustment for multiple testing (q > 0.05), and were only tested where there was an overall significant difference between countries (P < 0.05, ANCOVA). AGP, ɑ1 acid glycoprotein; CRP, C-reactive protein; sTfR, soluble transferrin receptor.
TABLE 3.
Standardized associations between intake of foods rich in iron, iron intakes, and biomarkers of iron status at baseline1
| n | β (95% CI) | P | R 2 | |
|---|---|---|---|---|
| Iron intake, mg/d | ||||
| Meat, g/d | 1244 | 0.20 (0.14–0.25) | <0.01 | 5.0% |
| Red and processed meat, g/d | 1244 | 0.18 (0.13–0.24) | <0.01 | 4.5% |
| Poultry, g/d | 1244 | 0.07 (0.01–0.12) | 0.01 | 0.6% |
| Fish, g/d | 1244 | 0.15 (0.10–0.20) | <0.01 | 2.2% |
| Serum ferritin, μg/L | ||||
| Meat, g/d | 1127 | 0.12 (0.06–0.18) | <0.01 | 2.5% |
| Red and processed meat, g/d | 1127 | 0.13 (0.07–0.19) | <0.01 | 2.6% |
| Poultry, g/d | 1127 | 0.03 (−0.03 to 0.09) | 0.31 | 0.2% |
| Fish, g/d | 1127 | 0.04 (−0.01 to 0.10) | 0.14 | 0.2% |
| Iron, mg/d | 1129 | −0.01 (−0.07 to 0.05) | 0.83 | 0.1% |
| Body iron, mg/kg | ||||
| Meat, g/d | 1127 | 0.09 (0.03–0.15) | <0.01 | 1.5% |
| Red and processed meat, g/d | 1127 | 0.09 (0.03–0.16) | <0.01 | 1.5% |
| Poultry, g/d | 1127 | 0.03 (−0.03 to 0.08) | 0.37 | 0.1% |
| Fish, g/d | 1127 | 0.06 (0.00–0.12) | 0.04 | 0.4% |
| Iron, mg/d | 1129 | −0.06 (−0.12 to 0.01) | 0.08 | 0.1% |
Values are the standardized β coefficients (95% CIs) relating to the change in iron intake or status per 1 SD difference in the intake of foods rich in iron, after adjustment for study center, age, sex, baseline BMI, and smoking status, n = 1244. The R2 values represent the variance in iron intakes or status explained by each variable. P values were calculated using linear regression models. Serum ferritin values were adjusted for CRP and AGP and body iron was calculated using the inflammation-adjusted values for ferritin and soluble transferrin receptor. AGP, ɑ1 acid glycoprotein; CRP, C-reactive protein.
At baseline, higher serum selenium concentrations were associated with higher serum ferritin concentrations (r = 0.11; P < 0.01) and higher body iron (r = 0.10; P < 0.01), but not sTfR (r = −0.03; P = 0.38; Figure 5). There were no significant interactions by study center (data not shown).
FIGURE 5.

Associations between serum selenium and biomarkers of iron status at baseline in 1173 men and women aged 65–79 y. The scatter plots represent the association of selenium status with biomarkers of iron status. The regression lines and P values were calculated from linear regression, and r indicates a partial correlation coefficient. Serum ferritin values were adjusted for CRP, AGP, and sTfR for AGP using a regression correction. Body iron was calculated using the inflammation-adjusted values for ferritin and sTfR. All models were adjusted for study center, age, sex, baseline BMI, and smoking status. Data were missing for 94 serum ferritin and body iron values. AGP, ɑ1 acid glycoprotein; CRP, C-reactive protein; sTfR, soluble transferrin receptor.
Effects of intervention
Selenium intakes and biomarkers of selenium or iron status did not differ between the control and intervention groups at baseline, but iron intakes were higher in the controls (12.5 mg/d), compared to the intervention group (11.9 mg/d; Table 1). Although calculated selenium intakes increased significantly in the intervention (P < 0.01), there was no effect on selenium status in a complete case analysis (P = 0.91; Table 4) or when missing data were imputed (P = 0.83; Supplemental Table 1).
TABLE 4.
Iron and selenium status and dietary intakes after 1 y of follow-up in the intervention and control diet groups1
| Control group | Intervention group | ||||||
|---|---|---|---|---|---|---|---|
| Variable | n | Baseline | 1-y follow-up | n | Baseline | 1-y follow-up | P |
| Serum selenium, µmol/L | 542 | 1.11 (1.09–1.12) | 1.11 (1.09–1.13) | 534 | 1.13 (1.11–1.15) | 1.13 (1.11–1.15) | 0.91 |
| Selenium intake, μg/d | 365 | 42.0 (40.4–43.7) | 41.0 (39.4–42.7) | 365 | 40.4 (38.8–42.0) | 51.6 (49.8–53.4) | <0.01 |
| Serum ferritin, μg/L | 561 | 106 (100–112) | 108 (102–114) | 557 | 113 (107–119) | 114 (107–120) | 0.41 |
| Soluble transferrin receptor, mg/L | 566 | 5.23 (5.12–5.35) | 5.25 (5.13–5.36) | 561 | 5.19 (5.07–5.30) | 5.33 (5.21–5.44) | 0.06 |
| Body iron, mg/kg | 561 | 8.67 (8.40–8.95) | 8.74 (8.47–9.02) | 557 | 8.96 (8.68–9.24) | 8.99 (8.70–9.27) | 0.62 |
| Iron intake, mg/d | 572 | 12.0 (11.8–12.3) | 11.9 (11.6–12.1) | 565 | 11.6 (11.4–11.9) | 12.7 (12.4–13.0) | <0.01 |
| Meat, g/d | 572 | 80.4 (77.1–83.7) | 79.0 (75.7–82.3) | 565 | 80.6 (77.2–83.9) | 67.0 (63.9–70.1) | <0.01 |
| Red and processed meat, g/d | 572 | 59.0 (56.1–61.8) | 59.9 (57.0–62.8) | 565 | 59.6 (56.6–62.5) | 47.2 (44.5–49.8) | <0.01 |
| Poultry, g/d | 572 | 16.7 (15.1–18.3) | 14.5 (13.0–16.0) | 565 | 16.5 (14.9–18.1) | 15.3 (13.8–16.9) | 0.28 |
| Fish, g/d | 572 | 33.2 (31.0–35.4) | 27.2 (25.1–29.3) | 565 | 31.8 (29.6–34.0) | 38.6 (36.1–41.0) | <0.01 |
Values are means (95% CIs), adjusted for study center, age, sex, baseline BMI, and smoking status, n = 1137. P values are for the time × treatment interaction, calculated from linear mixed effect models. Serum ferritin values were adjusted for CRP, AGP, and sTfR for AGP using a regression correction. Body iron was calculated using the inflammation-adjusted values for ferritin and sTfR. Selenium intakes were not available for the Polish and French cohorts. AGP, ɑ1 acid glycoprotein; CRP, C-reactive protein; sTfR, soluble transferrin receptor.
When data from all study sites were combined, there was an increase in iron intake resulting from the intervention (P < 0.001), but there were no changes in iron status in the complete case or imputed analyses (Table 4; Supplementary Table 1). There was a significant interaction with sex for sTfR only (P = 0002). When stratified by sex, we found a significant time × treatment interaction for women (P < 0.01), but not men (P = 0.18), with an increase in sTfR in the intervention group (data not shown). Meat intake decreased and fish intake increased to a greater degree in the intervention group, relative to the controls (P < 0.01 for both; Table 4). We examined the main food sources of iron intake in the intervention group at baseline and at the 1-y follow-up (data available for UK cohort only; Supplemental Table 2). The greatest differences were for refined and whole-grain cereals; at baseline, 14.1% of the iron intake came from refined cereals, compared to only 5.3% of the iron at follow-up. Conversely, at baseline 19.3% of iron intake came from whole-grain cereals, compared to 30.9% at follow-up. Other notable differences were for sugar and confectionary, which contributed 7.4% to the total intake at baseline, compared to 5.3% at follow-up. There were no clear changes observed in the foods that contributed to iron intake in the control group over the 1-y intervention (Supplemental Table 2).
The change in selenium status over the 1-y intervention was associated with greater changes in serum ferritin (P < 0.01) and body iron (P = 0.01), but not sTfR (P = 0.68; Figure 6). There were no study center × selenium status interactions for the iron biomarkers (P > 0.05 for all; data not shown).
FIGURE 6.

The 1-y change in biomarkers of iron status, by quintile of change in serum selenium, in 1077 men and women aged 65–79 y. Values are means (error bars indicate 95% CIs), adjusted for study center, age, sex, baseline BMI, smoking status, and group status. Serum ferritin values were adjusted for CRP, AGP, and sTfR for AGP, using a regression correction. Body iron was calculated using the inflammation-adjusted values for ferritin and sTfR. P values are for trends calculated using an ANCOVA. AGP, ɑ1 acid glycoprotein; CRP, C-reactive protein; Q, quintile; sTfR, soluble transferrin receptor.
Discussion
The main finding of this study was that consuming an MD for 1 y had no effect on iron and selenium statuses, despite significant changes in iron and selenium intakes. The decrease in meat intake (from 80.6 to 67.0 g/d) when changing from a habitual diet to an MD, did not result in a lower iron status, and an increase in fish intake (from 31.8 to 38.6 g/d) was not accompanied by a higher serum selenium concentration. However, there were differences between the study sites; serum ferritin increased significantly in participants in Italy, the Netherlands, and France, but not in those in the United Kingdom or Poland. This could be related to the differences in iron or meat intake (Supplemental Table 1). In all sites except Poland, participants’ iron intakes were significantly higher as a result of the intervention (P < 0.01), and there were also differences in mean baseline serum ferritin values (P < 0.05), which might have affected the sensitivity of responses to a change in iron intake. The meat intake was lower than that reported for people aged 65 y and over in the UK National Diet and Nutrition Survey (30).
Serum ferritin is a quantitative measure of the amount of iron in body stores (13). However, with infection or inflammation, serum ferritin is raised (13), so we adjusted serum ferritin values for infection/inflammation, using the approach recommended from the BRINDA project (29), to obtain values that reflected iron stores. Body iron, the ratio of serum transferrin receptor to serum ferritin (31), has been shown to be the most sensitive indicator of a change in iron status following iron supplementation and is more reliable than either parameter alone for the identification of iron deficiency (13). The prevalence of iron deficiency in our study population was extremely low, with only 1.1% of participants having SF concentrations below 15 µg/L at baseline.
The overall mean intake of selenium, calculated using country-specific food composition tables, was approximately 42 µg/d at baseline, but increased to 52 µg/d with the intervention. When standardized associations between the intake of selenium-rich foods and selenium intakes at baseline were examined, fish intake accounted for 18% of the variance in selenium intakes. The importance of fish in relation to selenium status is well established. Bates et al. (16) reported that in the UK National Diet and Nutrition Survey, dietary fish was a strong predictor of plasma and red cell selenium concentrations, and Filippini et al. (32) observed a positive association between the intake of fish, legumes, and dry fruits with plasma selenium. In an RCT, Scheers et al. (17) found a significant increase in plasma selenium in overweight Swedish men after they consumed herring for 6 weeks.
The Italian center had the lowest estimated mean selenium intake (37 µg/d), which increased to 57 µg/d as a result of the intervention. The US National Academies of Sciences, Engineering, and Medicine Estimated Average Requirement (EAR) for selenium in men and women aged 51 y and older is 45 µg/d (33). The US EAR was achieved in participants from the United Kingdom and the Netherlands, but the average intake of the Italian participants was slightly lower, although when consuming the MD their intake exceeded the EAR.
Average plasma selenium concentrations in European adults range from 0.61–1.57 µmol/L (34), and concentrations from 0.9–1.3 μmol/L have been proposed by different authors to reflect selenium adequacy (35). In our study, the overall mean serum selenium concentration was 1.12 µmol/L at baseline, and remained unchanged after the intervention, despite an apparent increase in selenium intake. Although the 7-d food record is a reliable proxy of short-term current dietary intakes in the elderly (36), this may be a reflection of the inaccurate nature of food composition tables, as the selenium content of food is greatly affected by environmental factors, such as soil selenium (37).
It has been reported that low serum selenium is an independent risk factor for anemia in older women living independently in the United States (18). This finding was obtained from cross-sectional analyses and agrees with data from the UK National Diet and Nutrition Survey, in which a positive correlation between plasma selenium and hemoglobin was reported in people aged 65 y and over (38). A potential mechanism by which selenium could contribute to anemia is through the maintenance of optimal glutathione peroxidase concentrations in erythrocytes, a key antioxidant selenoenzyme (39). We found that an increase in serum selenium was accompanied by higher serum ferritin and body iron (P = 0.01), but there was no effect on hemoglobin. The observed effect of changes in serum selenium on iron status is intriguing and could represent an early stage of the interaction that eventually leads to anemia.
The daily intake of iron was nearly twice the average requirement of 6 mg/d (40). We observed a significant increase in iron intake for those in the MD group, which agrees with other published findings (5). It appears that despite a reduction in meat intake, the MD provides sufficient bioavailable iron to maintain body iron; depending on the baseline habitual diet, changing to an MD may actually induce a subtle increase in iron status.
The main strengths of this RCT were the study size (1294 elderly men and women from 5 different regions of Europe) and the length of the intervention (1 y). The exclusion criteria were kept to a bare minimum, as we wanted to recruit a representative group of elderly people. However, there was a degree of self-selection, as the more nutritionally aware members of the community were more interested in volunteering for dietary studies. The success of the intervention was facilitated through a personalized approach, in which every volunteer was interviewed and dietary changes were tailored to their food preferences. Compliance analyses, assessed through 7-d food records collected at the start and end of the 1-y intervention, showed improved adherence to an MD following the NU-AGE approach (22). Seasonal variations in dietary patterns and food intake (with potential impacts on nutritional status) were avoided by running the intervention for a full year; with staggered starting dates for the volunteers, any confounding effects of season were minimized. As the primary aim of the trial was to examine the effect of the MD on inflammaging, the measures of nutritional status were secondary outcomes and, therefore, were more limited in scope. It was, for example, not possible to measure whole-blood iron status biomarkers or to measure selenoprotein P as a biomarker of selenium status. The fact that the majority of our volunteers were apparently healthy at baseline may explain why the MD did not change iron and selenium statuses, but it would be interesting to undertake a similar intervention with individuals selected for low iron and selenium status.
The results of our RCT demonstrated that an MD significantly increased iron and selenium intakes, but had no overall effect on iron or selenium statuses, although a small increase in iron status was observed in participants in 3 of the 5 countries participating in the trial. These findings add weight to the body of evidence underpinning recommendations to consume an MD to improve overall health.
Supplementary Material
Acknowledgments
The authors’ responsibilities were as follows—SJF-T, AJ, AC, CF: conceived the study; AAMB, LCPGMdG: designed the dietary intervention; AJ, RG, AAMB, BP, MJ-B, EC, AC, RO, AS: carried out the intervention study and were responsible for data collection; JT, AP, JD, JS, WDF, CN: were responsible for the biochemical analysis; AS: coordinated the NU-AGE data collection across centers; AJ: was responsible for the data analysis; SJF-T, AJ: wrote the first draft of the manuscript; and all authors: were accountable for all aspects of the work in ensuring that questions related to the accuracy or integrity of any part of the work were appropriately investigated and resolved, critically revised the manuscript for important intellectual content, and read and approved the final manuscript. None of the authors declared a conflict of interest.
Notes
This project was supported by the European Union's Seventh Framework Program (266486).
Supplemental Tables 1 and 2 are available from the “Supplementary data” link in the online posting of the article and from the same link in the online table of contents at https://academic.oup.com/ajcn/.
Abbreviations used: AGP, ɑ1 acid glycoprotein; BRINDA, Biomarkers Reflecting Inflammation and Nutritional Determinants of Anemia; CRP, C-reactive protein; EAR, Estimated Average Requirement; ICP-MS, inductively coupled plasma mass spectrometer; MD, Mediterranean-style diet; NU-AGE, New Dietary Strategies Addressing the Specific Needs of the Elderly Population for Healthy Aging in Europe; RCT, randomized controlled trial; sTfR, soluble transferrin receptor.
References
- 1. Willett WC, Sacks F, Trichopoulou A, Drescher G, Ferro-Luzzi A, Helsing E, Trichopoulos D.. Mediterranean diet pyramid: A cultural model for healthy eating. Am J Clin Nutr. 1995;61(6 Suppl):1402S–6S. [DOI] [PubMed] [Google Scholar]
- 2. Trichopoulou A, Costacou T, Bamia C, Trichopoulos D. Adherence to a Mediterranean diet and survival in a Greek population. N Engl J Med. 2003;348(26):2599–608. [DOI] [PubMed] [Google Scholar]
- 3. Castro-Quezada I, Roman-Vinas B, Serra-Majem L. The Mediterranean diet and nutritional adequacy: A review. Nutrients. 2014;6:231–48. [DOI] [PMC free article] [PubMed] [Google Scholar]
- 4. Padro L, Benacer R, Foix S, Maestre E, Murillo S, Sanvicens E, Somoza D, Ngo J, Cervera P. Assessment of dietary adequacy for an elderly population based on a Mediterranean model. J Nutr Health Aging. 2002;6:31–3. [PubMed] [Google Scholar]
- 5. Feart C, Alles B, Merle B, Samieri C, Barberger-Gateau P. Adherence to a Mediterranean diet and energy, macro-, and micronutrient intakes in older persons. J Physiol Biochem. 2012;68:691–700. [DOI] [PubMed] [Google Scholar]
- 6. Dwyer BE, Zacharski LR, Balestra DJ, Lernere AJ, Perry G, Zhu X, Smith MA. Potential role of iron in a Mediterranean-style diet. Arch Neurol. 2010;67:1286–7. [DOI] [PubMed] [Google Scholar]
- 7. Vaquero MP, Sanchez-Muniz FJ, Carbajal A, Garcia-Lanares MC, Garcia-Fernandez MC, Garcia-Arias MT. Mineral and vitamin status in elderly persons from Northwest Spain consuming an Atlantic variant of the Mediterranean diet. Ann Nutr Metab. 2004;48:125–33. [DOI] [PubMed] [Google Scholar]
- 8. Price EA, Mehra R, Holmes TH, Schrier SL. Anemia in older persons: Etiology and evaluation. Blood Cells Mol Dis. 2011;46:159–65. [DOI] [PubMed] [Google Scholar]
- 9. Fairweather-Tait SJ, Wawer AA, Gillings R, Jennings A, Myint PK. Iron status in the elderly. Mech Ageing Dev. 2014;136−137;22–8. [DOI] [PMC free article] [PubMed] [Google Scholar]
- 10. Berr C, Akbaraly T, Arnaud J, Hininger J, Roussel AM, Barberger Gateau P. Increased selenium intake in elderly high fish consumers may account for health benefits previously ascribed to omega-3 fatty acids. J Nutr Health Aging. 2009;13:14–18. [DOI] [PubMed] [Google Scholar]
- 11. van Dronkelaar C, van Velzen A, Abdelrazek M, van der Steen A, Weijs PJM, Tieland M. Minerals and sarcopenia; The role of calcium, iron, magnesium, phosphorus, potassium, selenium, sodium, and zinc on muscle mass, muscle strength, and physical performance in older adults: A systematic review. JAMDA. 2018;19:6–11. [DOI] [PubMed] [Google Scholar]
- 12. Steinbrenner H, Al-Quraishy S, Dkhil MA, Wunderlich F, Sies H. Dietary selenium in adjuvant therapy of viral and bacterial infections. Adv Nutr. 2015;6:73–82. [DOI] [PMC free article] [PubMed] [Google Scholar]
- 13. Lynch S, Pfeiffer CM, Georgieff MK, Brittenham G, Fairweather-Tait S, Hurrell RF, McArdle HJ, Raiten DJ. Biomarkers of nutrition for development (BOND)—iron review. J Nutr. 2018;148:1001s–67s. [DOI] [PMC free article] [PubMed] [Google Scholar]
- 14. Hallberg L, Rossander L, Skanberg AB. Phytates and the inhibitory effect of bran on iron absorption in man. Am J Clin Nutr. 1987;45:988–96. [DOI] [PubMed] [Google Scholar]
- 15. Macfarlane BJ, Bezwoda WR, Bothwell TH, Baynes RD, Bothwell JE, MacPhail AP, Lamparelli RD, Mayet F. Inhibitory effect of nuts on iron absorption. Am J Clin Nutr. 1988;47:270–4. [DOI] [PubMed] [Google Scholar]
- 16. Bates CJ, Prentice A, Birch MC, Delves HT. Dependence of blood indices of selenium and mercury on estimated fish intake in a national survey of British adults. Public Health Nutr. 2007;10:508–17. [DOI] [PubMed] [Google Scholar]
- 17. Scheers N, Lindqvist H, Langkilde AM, Undeland I, Sandberg AS. Vitamin B12 as a potential compliance marker for fish intake. Eur J Nutr. 2014;53:1327–33. [DOI] [PubMed] [Google Scholar]
- 18. Semba RD, Ferrucci L, Cappola AR, Ricks MO, Ray AL, Xue QL, Guralnik JM, Fried LP. Low serum selenium is associated with anemia among older women living in the community: The women's health and aging studies I and II. Biol Trace Elem Res. 2006;112:97–107. [DOI] [PMC free article] [PubMed] [Google Scholar]
- 19. Santoro A, Pini E, Scurti M, Palmas G, Berendsen A, Brzozowska A, Pietruszka B, Szczecinska A, Cano N, Meunier N et al.. Combating inflammaging through a Mediterranean whole diet approach: The NU-AGE project's conceptual framework and design. Mech Ageing Dev. 2014;136-137:3–13. [DOI] [PubMed] [Google Scholar]
- 20. Berendsen A, Santoro A, Pini E, Cevenini E, Ostan R, Pietruszka B, Rolf K, Cano N, Caille A, Lyon-Belgy N et al.. A parallel randomized trial on the effect of a healthful diet on inflammageing and its consequences in European elderly people: Design of the NU-AGE dietary intervention study. Mech Ageing Dev. 2014;136-137:14–21. [DOI] [PubMed] [Google Scholar]
- 21. Fried LP, Tangen CM, Walston J, Newman AB, Hirsch C, Gottdiener J, Seeman T, Tracy R, Kop WJ, Burke G et al.. Frailty in older adults: Evidence for a phenotype. J Gerontol A Biol Sci Med Sci. 2001;56:M146–56. [DOI] [PubMed] [Google Scholar]
- 22. Berendsen AAM, van de Rest O, Feskens EJM, Santoro A, Ostan R, Pietruszka B, Brzozowska A, Stelmaszczyk-Kusz A, Jennings A, Gillings R et al.. Changes in dietary intake and adherence to the NU-AGE diet following a one-year dietary intervention among European older adults—Results of the NU-AGE randomized trial. Nutrients. 2018;10(12):E1905. [DOI] [PMC free article] [PubMed] [Google Scholar]
- 23. ANSES/Ciqual (French Agency for Food, Environmental and Occupational Health & Safety). The ANSES/Ciqual food composition data bank. Maisons-Alfort, France; 2016. [Google Scholar]
- 24. European Institute of Oncology. Food composition database for epidemiological studies in Italy. [Internet] 2008. Available from: www.ieo.it/bda2008/homepage.aspx. [Google Scholar]
- 25. RIVM/Voedingscentrum(Dutch National Institute for Public Health and the Environment). Nevo-Tabel; Nederlands Voedingsstoffenbestand 2011. Den Haag, The Netherlands: RIVM/Voedingscentrum; 2011. [Google Scholar]
- 26. Kunachowicz H, Nadolna I, Przygoda B, Iwanow K. Tabele składu i wartości odżywczej żywności/ Food composition tables. Warsaw, Poland: Wydawnictwo Lekarskie PZWL; 2005. [Google Scholar]
- 27. Food Standards Agency. McCance and Widdowsons's the composition of foods. Cambridge, United Kingdom: Royal Society of Chemistry; 2002. [Google Scholar]
- 28. Turner P, Merren T, Speakman J. Interface studies in the ICP-MS spectrometer. In: Holland G, Tanner S,eds. Plasma source mass spectrometry: Developments and applications. Cambridge, United Kingdom: Royal Society of Chemistry; 1997, 28. [Google Scholar]
- 29. Namaste SM, Aaron GJ, Varadhan R, Peerson JM, Suchdev PS. Methodologic approach for the Biomarkers Reflecting Inflammation and Nutritional Determinants of Anemia (BRINDA) project. Am J Clin Nutr. 2017;106:333s–47s. [DOI] [PMC free article] [PubMed] [Google Scholar]
- 30. Roberts C, Steer T, Maplethorpe N, Cox L, Meadows S, Nicholson S, Page P, Swan G. National diet and nutrition survey results from years 7 and 8 (combined) of the rolling programme (2014/2015 - 2015/2016). London, United Kingdom: Public Health England; 2018. [Google Scholar]
- 31. Cook JD, Flowers CH, Skikne BS. The quantitative assessment of body iron. Blood. 2003;101:3359–64. [DOI] [PubMed] [Google Scholar]
- 32. Filippini T, Michalke B, Wise LA, Malagoli C, Malavolti M, Vescovi L, Salvia C, Bargellini A, Sieri S, Krogh V et al.. Diet composition and serum levels of selenium species: A cross-sectional study. Food Chem Toxicol. 2018;115:482–90. [DOI] [PubMed] [Google Scholar]
- 33. Institute of Medicine Panel on Dietary Antioxidants and Related Compounds. Dietary reference intakes for vitamin C, vitamin E, selenium, and carotenoids. Washington, DC: National Academies Press; 2000. [PubMed] [Google Scholar]
- 34. Carmona-Fonseca J. Selenium in serum and plasma: epidemiology and reference values. Rev Panam Salud Publica. 2010;28:388–98. [PubMed] [Google Scholar]
- 35. Combs GF., Jr. Selenium in global food systems. Br J Nutr. 2001;85:517–47. [DOI] [PubMed] [Google Scholar]
- 36. Ostan R, Guidarelli G, Giampieri E, Lanzarini C, Berendsen AAM, Januszko O, Jennings A, Lyon N, Caumon E, Gillings R et al.. Cross-sectional analysis of the correlation between daily nutrient intake assessed by 7-day food records and biomarkers of dietary intake among participants of the NU-AGE study. Front Physiol. 2018;9:1359. [DOI] [PMC free article] [PubMed] [Google Scholar]
- 37. Hurst R, Siyame EW, Young SD, Chilimba AD, Joy EJ, Black CR, Ander EL, Watts MJ, Chilima B, Gondwe J et al.. Soil-type influences human selenium status and underlies widespread selenium deficiency risks in Malawi. Sci Rep. 2013;3:1425. [DOI] [PMC free article] [PubMed] [Google Scholar]
- 38. Bates CJ, Thane CW, Prentice A, Delves HT. Selenium status and its correlates in a British national diet and nutrition survey: People aged 65 years and over. J Trace Elem Med Biol. 2002;16:1–8. [DOI] [PubMed] [Google Scholar]
- 39. Liao C, Carlson BA, Paulson RF, Prabhu KS. The intricate role of selenium and selenoproteins in erythropoiesis. Free Radic Biol Med. 2018;127:165–71. [DOI] [PMC free article] [PubMed] [Google Scholar]
- 40. EFSA (European Food Safety Authority) NDA (Dietetic Products, Nutrition and Allergies) Panel. Scientific opinion on dietary reference values for iron. EFSA J. 2015;13:4254. [Google Scholar]
Associated Data
This section collects any data citations, data availability statements, or supplementary materials included in this article.