Abstract
Background
The aim of this study was to assess the diagnostic performance of radiological imaging in differentiating xanthogranulomatous cholecystitis (XGC) from gallbladder cancer (GBC).
Methods
A retrospective analysis of the radiological imaging performed in patients who had pathologically confirmed XGC or GBC between December 2004 to April 2016 was performed. The sensitivity, specificity, positive predictive value (PPV), and negative predictive value (NPV) of each imaging modality, and combined imaging modalities were calculated.
Results
A total of 218 patients (XGC =109, GBC =109) were identified; 19 patients received all of abdominal ultrasound (US), contrast-enhanced ultrasound (CEUS), computed tomography (CT), magnetic resonance imaging (MRI), and positron emission tomography-computed tomography (PET/CT); 21 received four of these imaging examination types; 45 received three examinations; 58 received two examinations; and 75 received only one examination. The sensitivity and specificity of CEUS was 90% and 93%, respectively, higher than abdominal US (80%, 86%), CT (71%, 92%), MRI (75%, 90%), and PET/CT (55%, 90%) (all values respective). The sensitivity, specificity, NPV, and PPV of the US combined with CEUS were 91%, 90%, 94%, and 85%, respectively. Although the specificity of CEUS + CT and CEUS + MRI were 100% and 92%, respectively, the sensitivity of CEUS + CT and CEUS + MRI were both only 67%.
Conclusions
The Abdominal US is not sufficiently accurate to confidently guide clinical practice, and CEUS showed better diagnostic performance than the other imaging modalities in differentiating XGC from GBC. The combination of abdominal CEUS and CT is helpful for differential diagnosis, as it indicates GBC with better specificity and PPV.
Keywords: Cholecystitis, gallbladder cancer (GBC), perioperative diagnosis, contrast-enhanced ultrasound (CEUS)
Introduction
Xanthogranulomatous cholecystitis (XGC) is a chronic gallbladder disease which is characterized by the proliferation of xanthoma within the gallbladder wall (1,2). Although XGC is a benign disease, it can often be mistaken for gallbladder carcinoma (GBC) due to the radiological finding of a thickened gallbladder wall. Histologically, due to rupture of the Rokitansky-Aschoff sinuses, XGC creates an inflammatory reaction, which can often extend to adjacent organs, forming dense adhesions. These appearances are similar to the radiological findings and clinical manifestations of GBC. In clinical practice, some patients with XGC are misdiagnosed as having GBC, leading to unnecessary radical surgery or being incorrectly informed as having advanced GBC (1,3).
Several studies have reported the imaging characteristics of XGC, which include a continuous mucosal line in a thickened gallbladder wall, an intramural gallbladder wall nodule, and the presence of gallstones on a background of chronic gallbladder disease (4,5). In clinical practice, abdominal ultrasound (US), computed tomography (CT), and magnetic resonance imaging (MRI) are the commonly used imaging modalities for the assessment of gallbladder disease. Positron emission tomography-computed tomography (PET/CT) has also been reported as being used to determine the presence or absence of malignancy and for more accurate staging (6,7).
Contrast-enhanced ultrasound (CEUS) is a specialized form of ultrasound with microbubble contrast agents injected intravenously (8,9). It has been suggested CEUS may improve the accuracy of the diagnosis of gallbladder disease as compared to abdominal US (5). However, few studies have evaluated the diagnostic performance of US, CEUS, CT, MRI, and PET/CT for differentiating XGC from GBC. Therefore, the aim of this study was to assess the diagnostic performance of these imaging modalities in differentiating XGC from GBC.
Methods
Patients
Patients who underwent surgery in the Zhongshan Hospital, Fudan University between December 2004 and April 2016 and were histopathologically proven to have XGC or GBC, were included for further analysis. This study was approved by the institutional ethical committees of Zhongshan Hospital. Informed consent was obtained from each patient. The epidemiological and clinical data reviewed included clinical features, tumor markers (CEA, CA199), and imaging modalities (US, CEUS, CT, MRI, PET/CT). Given the ubiquity of the abdominal US, this was used as the baseline, with other variables being added to it.
Imaging technique
US and CEUS
In total, 108 patients received ultrasound (XGC =50, GBC =58). All patients who accepted US were in ambrosia 8 hours before the examination. Meanwhile, 58 patients received CEUS (XGC =20, GBC =38). Before the CEUS, the patients first received gray-scale and color Doppler. For the CEUS, each patient was injected intravenously by 2.4 mL SonoVue (SF6, Bracco, Milan, Italy) followed by a flush of 5 mL saline. The low-acoustic power modes were used at a mechanical index (MI) of 0.05–0.10 in the contrast-enhanced study. The CEUS examinations were performed by two experienced technologists.
CT
A total of 81 patients received enhanced CT examination (XGC =30, GBC =51); 64-slice helical CT machines were used for CT examination with the imaging settings set as 0.5 mm × 64 mm collimation and 120 kV, 150–200 mA. Each patient received nonionic iodinated contrast material (Ultravist, Schering, Berlin, Germany) via the antecubital vein by power injection at a rate of 4 mL/s. The arterial phase sequence was obtained at 25–32 s after contrast material administration, followed by a portal venous phase sequence beginning at 60 s after contrast infusion.
MRI
A total of 83 patients received enhanced MRI examination (XGC =45, GBC =38). All the patients went through the exam on a 1.5-T MR system (Magnetom Aera, Siemens Medical Solution, Erlangen, Germany) with phased-array coils. Each patient was injected with 0.025 mmol/kg bodyweight of gadoxetic acid via a cubical or cephalic vein at a rate of 1 mL/s. T1 mapping was obtained at 20 min after gadoxetic acid administration for HBP. Three-scan trace free-breath diffusion-weighted (DW) images were obtained prior to gadoxetic acid injection using a single-shot spin-echo echo planar imaging sequence [TR/TE, 3,200/56 ms; slice thickness, 5.5 mm; matrix size, 84×128; field of view (FOV), 380–400×300–324 mm] with a b value of 0 and 500 s/mm2. A parallel imaging technique (R=2) was performed using GAPPA.
PET/CT
A total of 51 patients received PET/CT examination (XGC =21, GBC =30). The VCT 64 PET/CT machine was used for the exam with the scanning setting as 140 kV and 200 mA. Each patient fasted at least 6 hours and received 0.1 mCi/kg body weight of 18F-FDG followed by a 10-mL saline flush via a cubical or cephalic vein. A short CT scan was performed 35 min after injection for attenuation correction and anatomic localization. Three-dimensional whole-body PET acquisitions were obtained at 3 time points with nominal start times at 40, 65, and 90 min after injection. Reconstruction was performed by filtered backprojection (FBP) method. The PET/CT examinations were performed by two experienced technologists.
Statistical analysis
Statistical analyses were performed using the SPSS 22.0 software package (SPSS, Chicago, IL, USA). Continuous data were expressed as median ± (ranges), and discrete variables were expressed as numbers and percentages. The continuous variables were compared using the Mann-Whitney U test. A Chi-square or Fisher’s exact test was used for comparisons of categorical variables.
Results
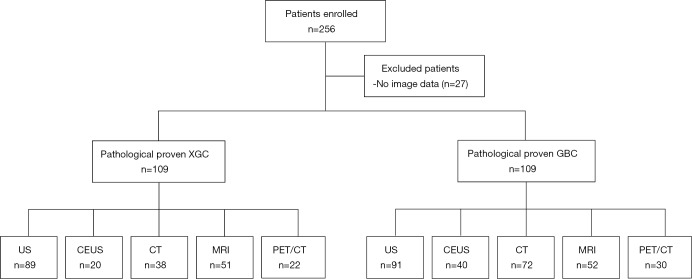
In total, 245 patients were enrolled in this study, and 27 patients were excluded due to the absence of image data (Figure 1). A total of 109 patients with XGC and 109 patients with GBC were included for the final analysis, in which 19 patients received all of US, CEUS, CT, MR, and PET/CT, 21 received four of these imaging examination types, 45 received three, 58 received two, and 75 received only one examination type. The clinical characteristics of these patients are shown in Table 1. A significant difference was observed in age (P<0.001), gender (P<0.001), CEA level (P<0.001), and CA199 level (P=0.012) between the two groups.
Figure 1.
Flow chart of enrolled patient selection.
Table 1. Clinical characteristics of recruited patients.
| Characteristics | XGC (n=109) | GBC (n=109) | P value |
|---|---|---|---|
| Median age, years (range) | 62 [15–80] | 69 [42–87] | <0.001 |
| Female, n (%) | 43 [40] | 74 [68] | <0.001 |
| WBC >9×10⁹/L | 13 | 19 | 0.339 |
| N% >70% | 19 | 30 | 0.104 |
| TB >20 mmol/L | 16 | 20 | 0.292 |
| ALT >50 μ/L | 20 | 23 | 0.367 |
| AST >40 μ/L | 27 | 24 | 0.375 |
| AFP >15 ng/L | 0 | 4 | 0.061 |
| CEA >3 ng/L | 11 | 38 | <0.001 |
| CA199 >35 μ/L | 31 | 48 | 0.012 |
WBC, white blood cell; N%, neutrophil percent; TB, total bilirubin; ALT, alanine aminotransferase; AST, aspartate aminotransferase; AFP, alpha fetoprotein; CEA, carcino-embryonic antigen; CA199, carbohydrate antigen 19-9.
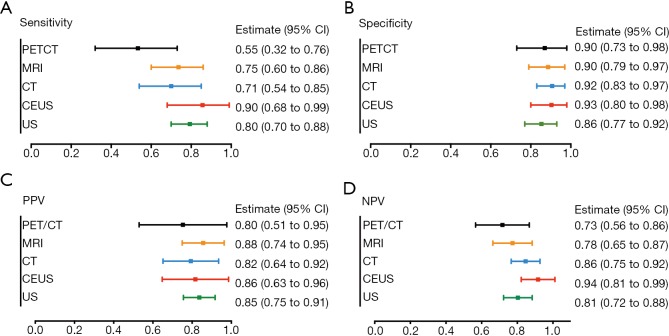
To discover the diagnostic value of each imaging modality, we calculated the sensitivity, specificity, PPV, and NPV of each individual examination. The diagnostic values are shown in Figure 2. As reported, compared with US, CT, MRI, PET/CT, and CEUS have the highest diagnostic value in sensitivity (90%), specificity (93%), PPV (86%), and NPV (94%) (Figure 2).
Figure 2.
Sensitivity, specificity, PPV, and NPV of US, CEUS, CT, MRI, and PET-CT for differentiating XGC. (A) The sensitivity of each imaging modality; (B) the specificity of each imaging modality; (C) PPV of each imaging modality; (D) NPV of each imaging modality. PPV, positive predictive value; NPV, negative predictive value; US, ultrasound; CEUS, contrast-enhanced ultrasound; CT, computed tomography; MRI, magnetic resonance imaging; PET, positron emission tomography; XGC, xanthogranulomatous cholecystitis.
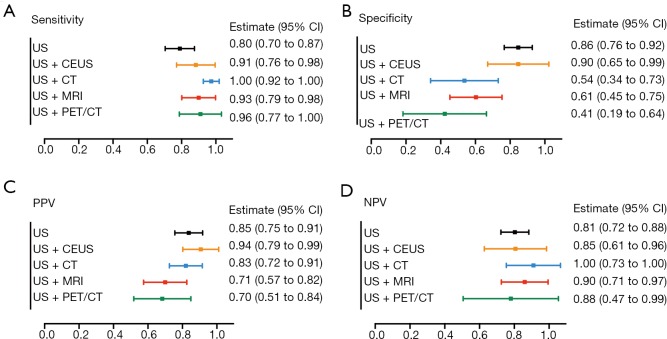
Surprisingly, although the US is a simple screening examination, the sensitivity of US was 80%, which was not inferior to CT (71%), MRI (75%), or PET/CT (55%). Moreover, it was found that US had a similar specificity (86%), PPV (85%), and NPV (81%) with PET/CT, MRI, and CT (Figure 2A,B,C,D). Meanwhile, compared with the other four examinations, PET/CT had relatively low sensitivity (55%), specificity (90%), PPV (80%), and NPV (73%) (Figure 2A,B,C,D). Consequently, we explored the diagnostic value of US combined with other imaging modalities (Figure 3). The results showed that US plus CT had better sensitivity (100%; 95% CI, 92–100%) and NPV (100%; 95% CI, 73–100%) than the other three combined methods. However, the specificity (54%; 95% CI, 34–73%) of US plus CT was relatively low among the combined examinations. US plus CEUS also showed improved diagnostic value with relatively high sensitivity (91%; 95% CI, 76–98%), specificity (90%; 95% CI, 65–99%), PPV (94%; 95% CI, 79–99%), and NPV (85%; 95% CI, 61–96%).
Figure 3.
Sensitivity, specificity, PPV, and NPV of US and US + CEUS, CT, MRI and PET/CT. (A) Sensitivity of US and US + CEUS, CT, MRI, and PET/CT; (B) specificity of US and US + CEUS, CT, MRI, and PET/CT; (C) PPV of US and US + CEUS, CT, MRI, and PET/CT; (D) NPV of US and US + CEUS, CT, MRI, and PET/CT. PPV, positive predictive value; NPV, negative predictive value; US, ultrasound; CEUS, contrast-enhanced ultrasound; CT, computed tomography; MRI, magnetic resonance imaging; PET, positron emission tomography; XGC, xanthogranulomatous cholecystitis.
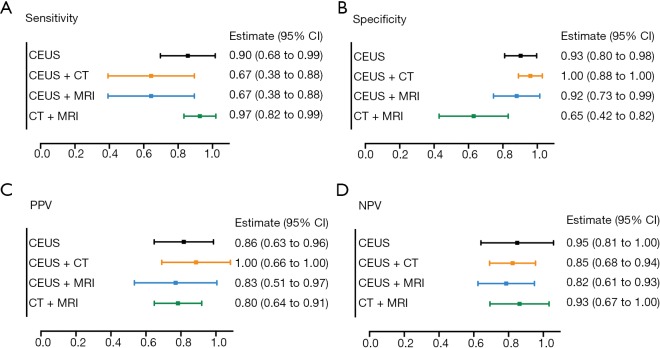
Taking the highest diagnostic value of CEUS, we further analyzed the diagnostic efficacy of CEUS plus CT or MRI. Clinically, CT plus MRI is widely used to differentiate XGC and GBC, as it is both convenient and non-invasive. Consequently, CT plus MRI was also compared with the CEUS combined imaging methods (Figure 4). Results indicated that CEUS plus CT had markedly better specificity (100%; 95% CI, 88–100%) and PPV (100%; 95% CI, 66–100%) than the other two kinds of combined examinations, even though the sensitivity was relatively low among the three combined methods (67%; 95% CI, 38–88%). CT plus MRI had better sensitivity (97%; 95% CI, 82–99%) and NPV (93%; 95% CI, 67–100%) than the other two combined methods. However, the specificity (65%; 95% CI, 42–82%) of CT plus MRI was relatively low among the combined examinations.
Figure 4.
Sensitivity, specificity, PPV, and NPV of CEUS, CEUS + CT, CEUS + MRI, and CT + MRI. (A) Sensitivity of CEUS, CEUS + CT, CEUS + MRI, CT + MRI; (B) specificity of CEUS, CEUS + CT, CEUS + MRI, and CT + MRI; (C) PPV of CEUS, CEUS + CT, CEUS + MRI, and CT + MRI; (D) NPV of CEUS, CEUS + CT, CEUS + MRI, and CT + MRI. PPV, positive predictive value; NPV, negative predictive value; US, ultrasound; CEUS, contrast-enhanced ultrasound; CT, computed tomography; MRI, magnetic resonance imaging; PET, positron emission tomography; XGC, xanthogranulomatous cholecystitis.
Discussion
XGC is a benign chronic gallbladder disease, which can be difficult to distinguish from GBC due to the similarity in their clinical manifestation and radiographic imaging. The similarities of imaging characteristics between XGC and GBC include the thickening of the gallbladder wall and the tendency to involve neighboring organs. The purpose of this study was to assess the diagnostic value of different imaging modalities (US, CEUS, CT, MRI, PET/CT) in differentiating XGC from GBC (10).
As US is a clinically preferred and ubiquitous imaging examination method, the diagnostic value of US for differentiating XGC and GBC was evaluated first. Unexpectedly, the sensitivity of US was 80%, which was superior to CT, MRI, and PET/CT. Despite the specificity of US being relatively low compared with the other four examinations, the PPV and NPV were not inferior to CT, MRI, and PET/CT. Recently, several studies have analyzed the diagnostic value of US, CT, MRI, and PET/CT in differentiating XGC from GBC. CT findings that are characteristic for XGC can provide excellent accuracy for the differentiation of XGC and GBC (4,11). The addition of diffusion-weighted imaging (DWI) to conventional MRI improves discrimination between xanthogranulomatous cholecystitis and the wall-thickening indication of GBC (12). Lee et al. assessed the diagnostic value of US, CT, and MRI in differentiating XGC from GBC and concluded that MRI showed the best diagnostic performance among the three imaging modalities, with US having better performance than CT (10). Moreover, it has been found that US-guided fine-needle aspiration (FNA) is a safe and effective method for diagnosing mass lesions of the gallbladder (13,14). Therefore, it is important to understand the diagnostic value of US combined with other imaging modalities. In the present study, US plus CT had better sensitivity and NPV than the other three combined methods. However, the specificity of US plus CT was relatively low among the combined examinations. Of the four additional imaging modalities assessed, US plus CEUS showed improved diagnostic efficacy in sensitivity, specificity, PPV, and NPV, and was thus effective in ruling out GBC.
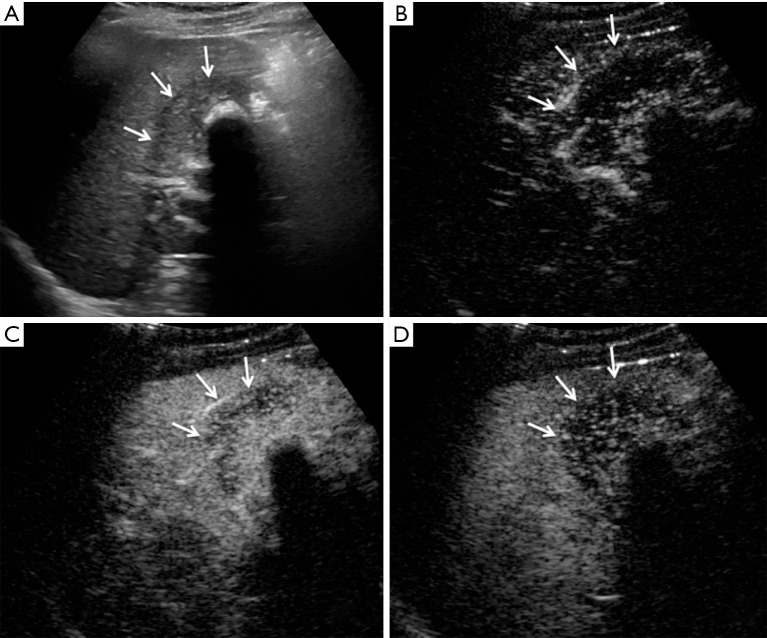
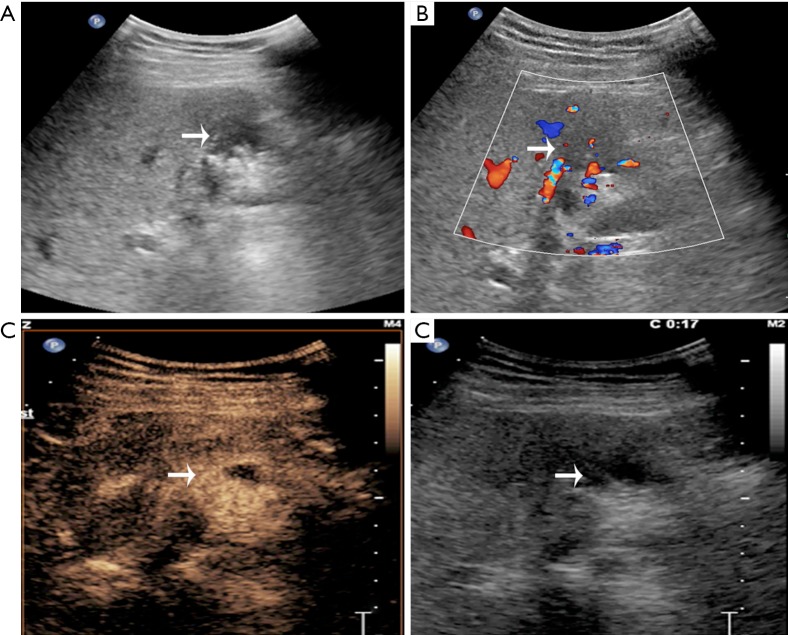
CEUS has been recently reported to be a promising method in differentiating XGC from GBC. It demonstrates superior detection of gallbladder wall thickness and hypoechoic nodules compared with US (5). In another recent study for differentiating XGC and GBC, CEUS was adopted to detect gallbladder wall thickness, gallbladder stones, and hypoechoic nodules in the gallbladder wall that had the same appearance on contrasted CT and MR; CEUS had a specific hypo-enhancement time for the differentiation of XGC and GBC (5). In the current study, CEUS showed better diagnostic value than the other five imaging modalities. As in Figure S1, the anterior gallbladder wall was regularly thickened, and the boundary between the gallbladder and peripheral liver parenchyma was clear in XGC patients. Furthermore, after the injection of contrast agent, the thickened gallbladder wall showed hyper-enhancement in the arterial phase and washout in the portal and late phase. In the case of GBC (Figure S2), hypoechoic lesions detected in the gallbladder area and gallbladder wall were not clear. After the injection of the contrast agent, the gallbladder wall was enhanced, a hyper-enhancement lesion was seen in the gallbladder, and invasion into the liver parenchyma was detected in the portal vein phase.
Figure S1.
A 71-year-old male with clinical suspicion of gallbladder carcinoma. The post-operative histopathology was XGC. (A) The anterior gallbladder wall was regularly thickened, while the posterior wall could not be displayed due to the shadow of the cholecystolithiasis on gray scale ultrasound. The boundary between the gallbladder and peripheral liver parenchyma was clear (arrow); (B,C,D) after the injection of contrast agent, the thickened gallbladder wall showed hyper-enhancement in the arterial phase (B) and washout in the portal (C) and late phases (D). The continuity and integrity of gallbladder serous layer was demonstrated on enhanced images (arrow). XGC, xanthogranulomatous cholecystitis.
Figure S2.
A 68-year-old male with clinical suspicion of gallbladder carcinoma. The post-operative histopathology was GBC. (A) CUS image: a hypoechoic lesion was detected in the gallbladder area, and the gallbladder wall was not clear; (B) color Doppler ultrasound detected blood flow signals in the gallbladder wall; (C,D) dual-mode images (CEUS on left and CUS on right): the gallbladder wall was enhanced, a hyper-enhancement lesion was seen in the gallbladder cavity which could not be detected on CUS (arrows in image D), and the inner and outer wall were still blurred on CEUS. CEUS, contrast-enhanced ultrasound; GBC, gallbladder cancer.
Considering CEUS, CT, and MRI all have specific characteristic imaging traits and perform well in diagnosing XGC, we further compared the diagnostic value between CEUS plus CT, CEUS plus MRI, and CT plus MRI. Notably, the relevant evidence concerning combined imaging methods remains sparse. In this study, although CT plus MRI had better sensitivity and NPV than the other two combined methods, it also had the lowest specificity. For specificity and PPV, CEUS plus CT showed the best diagnostic value than the other kinds of combinations (Figure 4B,C). Although CT plus MRI is commonly used in the clinic, with the advantages of being non-invasive, simple, and safe, CEUS uses several similar imaging features, which make it superior to contrasted CT and MRI for the differential diagnosis of XGC and GBC. These features include diffuse thickening pattern, gallbladder inner wall continuity, and intramural nodules. It was found that CEUS had a clearly higher positive rate in intramural nodules than CT and MRI. Besides, hypo-enhancement time was a distinct imaging feature of CEUS, which was reported to be effective in discriminating between benign and malignant gallbladder lesions (5). All of these characteristics suggest that CEUS has outstanding accuracy for diagnosing XGC.
This study has some limitations. It was a retrospective analysis, and thus selection bias may exist. Secondly, not all patients received each of the imaging examinations. Thirdly, US and CEUS are operator-dependent examinations.
Conclusions
Compared to each of the other imaging modalities, abdominal US, with its distinct characteristics, was an effective but not an accurate screening examination in the differential diagnosis of XGC and GBC. CEUS showed outstanding diagnostic performance in preoperative diagnosis. Although CEUS plus US showed better sensitivity than the other combination methods, CEUS plus CT showed promising specificity and PPV for discriminating between GBC from XGC.
Acknowledgments
Funding: This study was supported by grants from the National Natural Science Foundation of China (No. 81872352), the Foundation of Shanghai Science and Technology Committee (16411952000), the Jianfeng project of Xuhui Provincial Commission of Health and Family Planning (SHXH201703), the Shanghai Medical Discipline of Key Programs for General Surgery (2017ZZ02007), and the Clinical Study of Zhongshan Hospital (2018ZSLC24).
Ethical Statement: The authors are accountable for all aspects of the work in ensuring that questions related to the accuracy or integrity of any part of the work are appropriately investigated and resolved. This study was approved by the institutional ethical committees of Zhongshan Hospital. Informed consent was obtained from each patient.
Footnotes
Conflicts of Interest: The authors have no conflicts of interest to declare.
References
- 1.Zhuang PY, Zhu MJ, Wang JD, et al. Xanthogranulomatous cholecystitis: a clinicopathological study of its association with gallbladder carcinoma. J Dig Dis 2013;14:45-50. 10.1111/j.1751-2980.2012.00645.x [DOI] [PubMed] [Google Scholar]
- 2.Zhang LF, Hou CS, Liu JY, et al. Strategies for diagnosis of xanthogranulomatous cholecystitis masquerading as gallbladder cancer. Chin Med J (Engl) 2012;125:109-13. [PubMed] [Google Scholar]
- 3.Yabanoglu H, Aydogan C, Karakayali F, et al. Diagnosis and treatment of xanthogranulomatous cholecystitis. Eur Rev Med Pharmacol Sci 2014;18:1170-5. [PubMed] [Google Scholar]
- 4.Zhao F, Lu PX, Yan SX, et al. CT and MR features of xanthogranulomatous cholecystitis: an analysis of consecutive 49 cases. Eur J Radiol 2013;82:1391-7. 10.1016/j.ejrad.2013.04.026 [DOI] [PubMed] [Google Scholar]
- 5.Yuan HX, Wang WP, Wen JX, et al. Xanthogranulomatous cholecystitis: contrast-enhanced ultrasound features and differential diagnosis from wall-thickening gallbladder carcinoma. Discov Med 2016;21:89-98. [PubMed] [Google Scholar]
- 6.Goel M, Tamhankar A, Rangarajan V, et al. Role of PET CT scan in redefining treatment of incidental gall bladder carcinoma. J Surg Oncol 2016;113:652-8. 10.1002/jso.24198 [DOI] [PubMed] [Google Scholar]
- 7.Suzuki H, Wada S, Araki K, et al. Xanthogranulomatous cholecystitis: Difficulty in differentiating from gallbladder cancer. World J Gastroenterol 2015;21:10166-73. 10.3748/wjg.v21.i35.10166 [DOI] [PMC free article] [PubMed] [Google Scholar]
- 8.Feier D, Socaciu M, Anton O, et al. The combined role of intravenous contrast enhanced ultrasound (CEUS) and computed tomography (CT) in liver abscess diagnosis. Chirurgia (Bucur) 2012;107:343-51. [PubMed] [Google Scholar]
- 9.Yang WY, Park HS, Kim YJ, et al. Visibility of focal liver lesions: Comparison between kupffer phase of CEUS with sonazoid and hepatobiliary phase of gadoxetic acid-enhanced MRI. J Clin Ultrasound 2017;45:542-50. 10.1002/jcu.22499 [DOI] [PubMed] [Google Scholar]
- 10.Lee ES, Kim JH, Joo I, et al. Xanthogranulomatous cholecystitis: diagnostic performance of US, CT, and MRI for differentiation from gallbladder carcinoma. Abdom Imaging 2015;40:2281-92. 10.1007/s00261-015-0432-x [DOI] [PubMed] [Google Scholar]
- 11.Shetty GS, Abbey P, Prabhu SM, et al. Xanthogranulomatous cholecystitis: sonographic and CT features and differentiation from gallbladder carcinoma: a pictorial essay. Jpn J Radiol 2012;30:480-5. 10.1007/s11604-012-0080-9 [DOI] [PubMed] [Google Scholar]
- 12.Kang TW, Kim SH, Park HJ, et al. Differentiating xanthogranulomatous cholecystitis from wall-thickening type of gallbladder cancer: added value of diffusion-weighted MRI. Clin Radiol 2013;68:992-1001. 10.1016/j.crad.2013.03.022 [DOI] [PubMed] [Google Scholar]
- 13.Hijioka S, Mekky MA, Bhatia V, et al. Can EUS-guided FNA distinguish between gallbladder cancer and xanthogranulomatous cholecystitis? Gastrointest Endosc 2010;72:622-7. 10.1016/j.gie.2010.05.022 [DOI] [PubMed] [Google Scholar]
- 14.Rana C, Krishnani N, Kumari N. Ultrasound-guided fine needle aspiration cytology of gallbladder lesions: a study of 596 cases. Cytopathology 2016;27:398-406. 10.1111/cyt.12296 [DOI] [PubMed] [Google Scholar]


