Abstract
Temperature measurements with thin thermocouples embedded in ultrasound fields are strongly subjected to a viscous heating artifact (VHA). The artifact contribution decays over time, therefore it can be minimized at late temperature readings. However, previous studies have failed to demonstrate a rigorous method for determining the optimal time point at which the artifact contribution is negligible. In this study, we present an iterative processing method based on successive curve fittings using an artifact-independent model. The fitting starting point moves at each iteration until the maximum R2 indicates where the viscous heating is minimum. A solution of the bioheat transfer equation is used to account for blood perfusion, thus enabling in vivo measurements. Three T-type thermocouples with different diameters and sensitivities were assessed in excised canine liver and in the mouse brain in vivo. We found that the artifact constitutes up to 81±5% of wire thermocouple readings. The best-fit time varied in liver samples (n=3) from 0 to 3.335±0.979s and in the mouse brain (n=5) from 0 to 0.498±0.457s at variable experimental conditions, which clearly demonstrates the need of the method for finding the appropriate starting time point of the fit. This study introduces a statistical method to determine the best time to fit a curve that can back estimate temperature in tissues under ultrasound exposure using thermocouples. This method allows temperature evaluation in vivo and in vitro during validation and safety assessment of a wide range of therapeutic and diagnostic ultrasound modalities.
Keywords: focused ultrasound, thermocouple, viscous heating artifact
I. Introduction
Thermal dose estimation [1], [2] is essential in determining the acoustic power necessary to achieve effective temperature rise and degree of cell damage during ultrasound-induced hyperthermia and ablation [2], [3]. Temperature estimation is also important to characterize acoustic parameters that ensure safe temperature levels of ultrasound imaging techniques [4], [5]. In addition to that, accurate temperature monitoring may provide insights into the mechanisms involved in novel techniques such as ultrasound neuromodulation [6], [7].
Thermocouples are widely used to measure temperature in biological tissues exposed to ultrasound. The experimental data obtained from thermocouple measurements can be used to adjust modelling parameters [8], provide the absorption coefficient of tissues [9], [10], and calibrate non-invasive thermometry techniques [11], [12]. However, the presence of metal thermocouples in biological tissues under ultrasound exposure introduces errors in the measurements that are associated with viscous heating artifact (VHA). This artifact occurs at the thermocouple-tissue interface due to motion caused by the difference of density between the thermocouple and the surrounding tissue [13], [14]. Morris et al. 2008 have shown that temperature measurements with wire thermocouples could comprise up to 80% viscous heating [15]. Different methods have been proposed to minimize the VHA, thus providing the ability to retrieve the true absorption heating, both spatially and temporally, from thermocouple measurements.
The first methods were based on the fact that the viscous heating contribution is greater at the beginning of sonication and decays during time [13], [16]. This method (a.k.a. the ‘wait then measure’ approach) consisted in waiting certain time to measure temperature so the viscous heating was minimized. The drawback of this approach is the inconsistency of the waiting time to perform measurements as the tissue properties, acoustic parameters, and thermocouple properties varied across studies, i.e., 0.5 s after ultrasound onset [16], or after sonication cessation: 200 ms [17], 2 s [10], and 5 s [15]. In addition to that, the cooling model adopted in the previous studies focused only on in vitro measurements and did not account for blood perfusion. Another approach consisted in characterizing the VHA in phantoms with low acoustic absorption, with other properties otherwise similar to the tissue under investigation [18]. This solution seems reasonable for homogeneous tissues, but can be troublesome for heterogeneous media such as multiple layer of tissues with different attenuation coefficients (i.e. transcranial ultrasound). Additionally, simulations could be used to estimate the increase in temperature due to viscous heating and correct the temperature readings [19]. However, similar issues with the estimation of tissue properties and heterogeneities can limit the application to a few experimental conditions. Lastly, thin-film thermocouples present a very low VHA (<3%), but their flat, relatively large format (85 mm) in comparison to needle or wire thermocouples (<1 mm) limits the insertion of the probe into the sample [15], [20]. Overall, methods based on the ‘wait then measure’ approach appear to be easier to implement as they mainly depend on experimental data processing. Thus, if further implementation of this approach can overcome the variability across studies, it could be used for a large variety of commercial thermocouple types.
In this study, we developed a method to estimate the VHA from thermocouple measurements. An iterative curve fitting methodology was developed to evaluate the cooling process after sonication. An analytical solution of the bioheat transfer equation was used to account for thermal diffusion and blood perfusion in vivo. This method was used to estimate the temperature increase without the artifact.
II. Material and Methods
A. Iterative curve fitting of Bioheat transfer equation
A common method for the in vivo estimation of temperature evolution over time is modelling perfused biological tissues using the Pennes’ bioheat transfer equation [21]:
| (1) |
where is the tissue density, is the specific heat of tissue, T is the tissue temperature at a spatial coordinate r and time t, is the tissue thermal conductivity, are the perfusion-related coefficients, respectively, the perfusion rate per unit volume of tissue, the blood density, the blood specific heat, and the blood temperature. Finally, is the volume rate of heat deposition, which in the case of an ultrasound heating source can be described as , where α is the absorption coefficient and is the derated acoustic intensity [22].
The algebraic solution of the bioheat transfer equation to model the tissue temperature evolution in time and space can be obtained after a Fourier transformation over the space coordinates [23]
| (2) |
where * denotes the Fourier transform, is the spatial frequency coordinates, and is the Fourier transform of initial temperature at t=0.
Given that the viscous heating decays over time, the iterative curve fitting process consisted of progressively moving the starting point of the curve fitting in steps from the end of sonication () until the goodness-of-fit indicated where the viscous heating was negligible during the temperature decay (maximum R2; ).
B. Algorithm validation
The analytical solution of the temperature decay expected in soft tissue (Eq. 2) was used to validate the iterative curve fitting considering an initial temperature increase of 3°C above the baseline set as 25°C ( =28°C). The contribution of the VHA in the temperature decay was simulated by adding an exponential decay term that simulated the rapid temperature decrease due to thermal diffusion at the thermocouple junction. The temperature decay due to the tissue diffusion and perfusion and viscous heating effect was given by
| (3) |
where, is the initial temperature generated by the thermocouple viscous heating effect, τ is the time constant of the temperature decay of the VHA, and is a ±1% random noise of the temperature decay. A wide range of values for and τ was chosen to validate the processing, which simulated different experimental conditions and thermocouple types. The temperature contribution due to the VHA ( was varied from 10% to 90% of the total temperature at t=0 (Supplementary Fig. 1a). For each of the VHA contributions, the time constant τ was set 0.25, 0.5, 1.0, 2.0, 5.0, and 10.0, which generated slow to fast decay times (Supplementary Fig. 1b). The tissue property parameters and perfusion-related coefficients were kg.m−3, J.kg−1.°C−1, W.m−1.°C−1, kg.m−3.s−1, J.kg−1.°C−1 based on values for soft tissue found in [23]. The iterative processing was tested using preset values for tissue properties and coefficients, and also using free parameter fitting, which consisted of testing the algorithm without pre-setting those values. In addition, the iterative processing was also tested using preset values ranging from −25% to +25% in steps of 1.25% of the expected values for all parameters to simulate errors introduced by wrong assumptions of tissue parameters and coefficients. All temperature estimations (validation, in vitro and in vivo) were performed with 5 ms Δt steps unless otherwise noted.
C. Sonication protocol
Iterative curve fitting was implemented using Eq. (2) to fit the experimental data obtained after sonication using three different T-type thermocouples (Table I). The data acquisition was performed at 2 kHz sampling frequency with a USB datalogger controlled by Matlab (model DI-245, DataQ Instruments, Akron, Ohio, USA).
TABLE I.
Thermocouples used in this study
| Brand/model | Probe type | Ø (mm) | Trange (°C) | Time Constant (s) | Accuracy (°C) |
|---|---|---|---|---|---|
| ThemoWorks IT-1E | Wire T-type (W30) | 0.30 | −50 to 150 | 0.005 | ±0.1 |
| Omega HYP1 a | Needle T-type (N25) | 0.25 | −200 to 350 | N/A | ±0.5 |
| ThemoWorks T-23X | Needle T-Type (N64) | 0.64 | −50 to 200 | 0.025 | ±0.1 |
Full model name: HYP1–30-1/2-T-G-60-SMP-M
In vitro
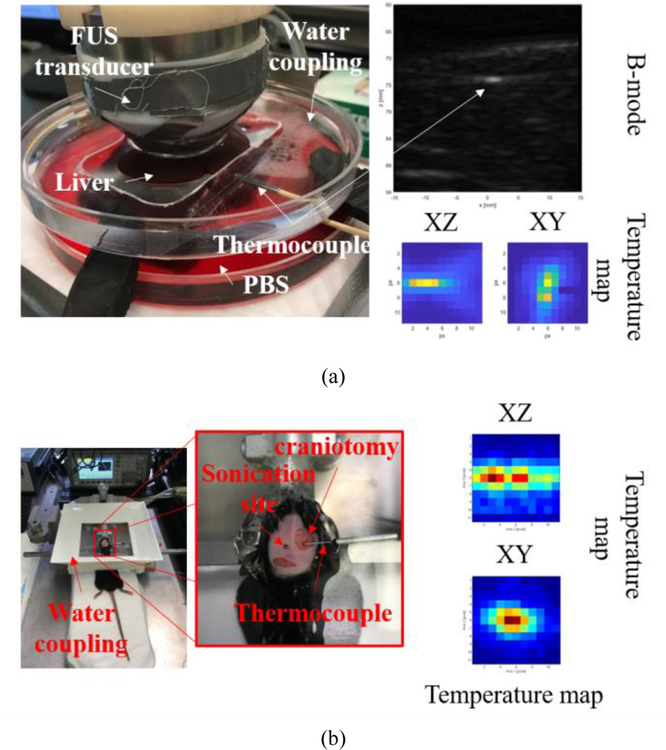
The iterative curve fitting process was validated both in vitro and in vivo. The in vitro validation was performed in fresh canine liver samples (n=3) degassed for at least 4h in Phosphate-buffered saline (PBS) using a desiccator at room temperature (20°C). The thermocouple probes were inserted 5–8 mm deep in the liver sample (figure 1a). Sonication of liver samples was performed using a single element 3.1 MHz transducer (−6 dB focal zone: 0.4 mm x 2.6 mm; radius of curvature: 50 mm; SonicConcepts, WA, USA) driven by a function generator (33220A, Agilent Technologies, CA, USA) connected to a 50-dB power amplifier (ENI Inc., NY, USA). Targeting was performed first using B-mode to locate the thermocouple tip (figure 1a, top right) using an ultrasound probe (P12–5, ATL/Philips, WA, USA) axially aligned to the focused ultrasound (FUS) transducer. The transducers were fixed in a 3-D positioning system (Velmex, inc., NY, USA). Then, the thermocouple was fine-aligned at the FUS focus using temperature maps obtained from 3-D raster scanning of the FUS beam using short-pulses with low intensity (3.1 MHz, 100 ms, 1 MPa) to cause mild temperature elevations (<1°C) (figure 1a, bottom right). After alignment, acoustic parameters were explored as follows: peak-negative-pressure (PNP): 0.9, 1.3, and 1.7 MPa (continuous wave-CW); pulse repetition frequency (PRF): 10, 100, and 1000 Hz (15% duty cycle); spatial location: 0.00, 0.19, 0.30, 0.50, 0.75, 1.00, 1.25, and 1.50 mm (CW, following the lateral FUS beam profile), with all pulses with 3-s duration.
Fig. 1.
Experimental setups. (a) In vitro validation in canine liver with thermocouple inserted perpendicular to the axial direction of the FUS beam. The thermocouple was placed at the FUS focus using B-mode images and XY/XZ temperature maps obtained from the raster scanning of the FUS beam. (b) In vivo validation in the mice brain, where the thermocouple was inserted into the brain through a small craniotomy (<1mm). The thermocouple sensitive tip was placed right below the skull in the contralateral side, where skin and skull were intact. Temperature maps were also performed to place the thermocouple at the FUS focus. In both temperature maps, the temperature elevation was less than 1°C.
In vivo
All animal procedures in this experiment were reviewed and approved by the Institutional Animal Care and Use Committee of Columbia University (IACUC). The in vivo validation was performed in mice brain (n=5, wild-type mice C57BL-6). Animals were deeply anesthetized with 2% isoflurane with oxygen at 0.8 L.min−1 (SurgiVet, Smiths Medical PM, Inc., Wisconsin, USA) and immobilized within a stereotaxic frame (David Kopf Instruments, Tujunga, CA, USA) where isoflurane was continuosly delivered at the same rate. The fur of the head was shaved and the skin was removed around the region where a small craniotomy (~1 mm) was then performed. The thermocouple probe was inserted laterally underneath the skull. The tip of the probe was placed on the contralateral side of the craniotomy, where the skull and skin were kept intact (figure 1b). Sonication of the mouse brain was performed using a single element 2-MHz transducer (focal zone: 1.0 mm x 8.7 mm; radius of curvature: 70 mm; Imasonic SAS, Voray-sur-l’Ognon, France) driven by a function generator (33500B, Keysight Technologies, CA, USA) connected to a 50-dB power amplifier (ENI Inc., NY, USA). Acoustical coupling between the transducer and the skull was achieved with a water tank at room temperature and coupling gel. The thermocouple alignment was performed similarly as in the in vitro validation using short pulses (2 MHz, 100 ms, 1 MPa) to cause mild temperature elevations (<1°C) (figure 1b, right). We could confirm the thermocouple location by comparing the temperature maps with the echo location of skull using a pulser-receiver (NDT-5800, Panametrics, MA, USA) and a pulse-echo transducer located at the center of the 2-MHz transducer (center frequency: 10 MHz, focal depth: 60 mm, diameter: 22.4 mm; model U8517133, Olympus NDT, Waltham, MA, USA). If adjusts of the focal zone location indicated by the temperature maps exceeded more than 1 mm, the thermocouples were removed and reinserted. The needle thermocouple was easier to position as its rigid body facilitated sensing with hands when the thermocouple tip touched the skull. Thus, wire thermocouple was more susceptible to location variation. After probe alignment, 3-s duration sonications were performed using either continuous wave (CW) or pulsed ultrasound (PRF: 10, 100, 1000 Hz; 50% duty cycle). Trials were performed at several distances from the recording area of the thermocouple (0, 0.5 0.9, 1.2, and 1.5 mm). The impact of changing the Δt value was verified using the dataset of in vivo brain sonication using 0.5 MPa and 1.2 MPa for 3s. Δt was varied from 0.5 ms to 0.25 s by downsampling data from 2 kHz to 4 Hz, which demonstrates the use of the algorithm for different acquisition sampling frequencies.
Pulse sequences relevant to ultrasound neuromodulation were also assessed following parameters described by Kamimura et al. [6]: PRF=1 kHz (50% duty cycle), PNP=1.76 MPa, pulse duration=1 s, and interval inter-stimulus=1 s for multiple pulses (10 pulses).
III. Results
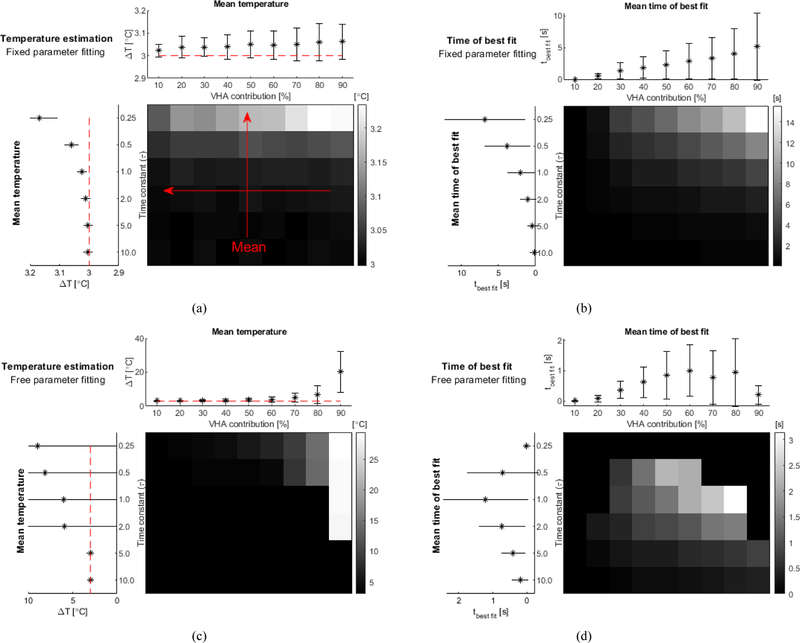
The validation of the iterative method using the analytical solution of the bioheat equation in soft tissue is presented in figure 2. The iterative processing using preset values for the tissue parameters resulted in more accurate temperature estimation. Low time constants of VHA (<0.50) generated a slight overestimation of temperature (<0.2°C) and it was nearly invariant with changes in the VHA contribution for the fixed parameter fitting (figure 2a). The time for the best fit increased with both VHA contribution and decay time (inversely proportional to the time constant) (figure 2b). On the other hand, the temperature estimation obtained without presetting values (free parameter fitting) generated errors larger than 0.2°C for VHA contributions higher than 80% and time constant lower than 1.0 (figure 2c). For VHA contributions of 90% the free fitting method could still estimate temperature accurately (<0.2°C), but only for fast decays (time constant > 5.0). The time for best fit shows a consistent increase in the mean values obtained for VHA contributions up to 60% (figure 2d). Fails in the determination of the time for the best fit mainly happened for time constants lower than 0.5 and VHA contribution higher than 80%. Finally, the robustness of the fixed parameter fitting was tested by varying all tissue parameters by ±25% of the expected values (namely the tissue density , the specific heat of tissue , the tissue thermal conductivity , the perfusion rate per unit volume of tissue , the blood density , and the blood specific heat ). 3-D plots with the temperature estimations obtained for each parameter variation are presented in the supplementary material (Supplementary figure 2). Higher errors occurred for higher VHA contributions and lower time constants (time constant of artifact decay: 0.25, and VHA magnitude: 90%). The maximum estimated temperature errors were +1.3°C and −0.3°C found respectively for a value offset of −25% and −15% in tissue density and specific heat. For the same range, errors in the assumptions of the tissue thermal conductivity generated a maximum overestimation of 0.2°C and errors in perfusion related coefficients generated a maximum error of 1.0°C both for values shifts of 25%. In the worst case scenario, combining parameters values that independently resulted the highest errors would generate an overestimation of temperature of 2.5°C.
Fig. 2.
Validation of the iterative processing performed in simulated data based on soft tissue properties ( kg.m−3, J.kg−1.°C−1, W.m−1.°C−1, kg.m−3.s−1, J.kg−1.°C−1). The VHA was simulated using an exponential decay with different VHA contributions (from 10–90%) and different time constant for the VHA artifact decay (0.25, 0.50, 1.00, 2.00, 5.00, and 10.00). (a) Temperature estimation obtained from fitting using fixed parameters for tissue properties. The grayscale grid is the normalized estimated temperature obtained for all combinations of VHA contributions and time constants. The plot on top is the average values of the estimated temperature for different VHA contribution (red arrow indicates that average data was obtained from data represented in the columns of grayscale grid). The plot on the left is the average values obtained for different time constants (average data using rows of grid). (b) Time of best fit identified by the iterative processing using preset tissue parameters. (c) and (d) show data in similar fashion using iterative fitting with non-defined tissue properties (free parameter fitting). (VHA – viscous heating artifact)
The iterative curve fitting processing is demonstrated in an excised liver sample (figure 3). The initial temperature was estimated from the extrapolation of the fitted curve at back to . The sample temperature before sonication was 22.2°C (t<5 s). The sonication started at 5 s. A peak temperature of 41.4°C (at tend=8 s) was generated using a 3.1 MHz pulse (CW) at −1.3 MPa, with a total sonication duration of 3 s (figure 3, top). The curve fitting using Eq. (2) was applied iteratively during the temperature-cooling phase with the starting point moving in Δt steps of 0.005 s from 8 s (the end of sonication) to 19 s. The goodness-of-fit increased over time, reached a maximum at 9.7 s (R2 = 0.99), and then decreased (figure 3, bottom). The inflexion point indicates the time of the best fit where the viscous heating is negligible. The best-fitted curve at 9.7 s was used to retrieve the temperature at the beginning of cooling right after the cessation of sonication (8 s), where the actual temperature increase due to absorption only (no viscous heating) was 5.1°C. At this point, the viscous heating represented 66% of the temperature reading. A non-iterative fitted curve (figure 3, top in green) is also provided to demonstrate how the experimental data fits the bioheat transfer equation with the lowest R2 value (equal to 0.91) at the beginning of cooling at 8 s (figure 3, bottom).
Fig. 3.
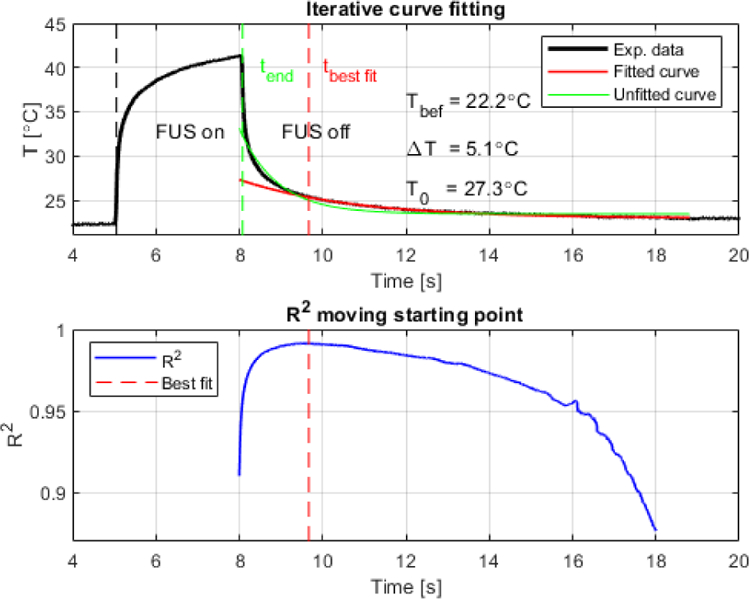
Representative plots of iterative curve fitting process during cooling from acquisition using wire thermocouple in excised canine liver (3.1 MHz, −1.3 MPa, 3 s, CW). (Top) Original experimental data and best fitted curve indicating the retrieved peak temperature at the end of sonication (T0) equal to 27.3°C, resulting in a total temperature variation of 5.1°C during 3 s sonication (temperature before sonication Tbef was equal to 22.2°C). A fit curve from t=8 s (green) is also provided to demonstrate the lowest R2. (Bottom) Full goodness of fit profile indicated by R2 showing in dashed red line when the artifact was minimum (9.7 s).
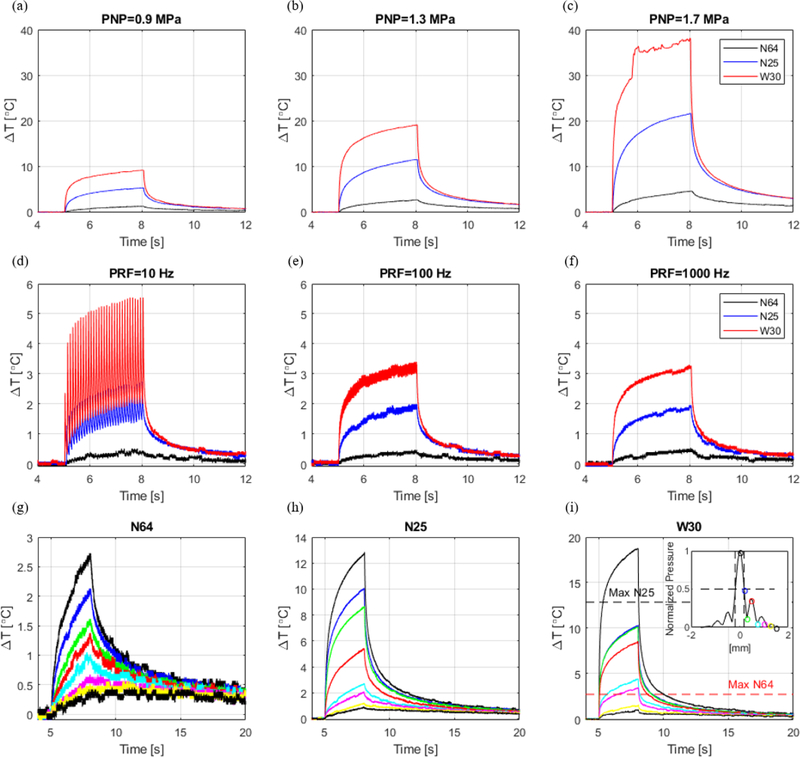
The same processing was applied in vitro for different acoustic parameters and thermocouple types. The temperature elevation during sonication varied with pressure, pulse repetition frequency, location, and type of thermocouple. Figure 4 summarizes the temperature readings in in vitro canine liver using different thermocouples at same experimental conditions (figure 4 shows raw data for one representative dataset). The variation of the temperature readings is attributed to the VHA. The needle thermocouples (N64 and N25) presented closer temperature readings during sonication in comparison to the wire thermocouple (W30), which was much more susceptible to the VHA. Figures 4 c, d and f depict how readings can be strongly affected by motion artifacts characterized by fast temperature increase and non-smooth temperature readings especially when using the fast-response wire thermocouple W30 (time constant: 0.005 s). As expected, the temperature proportionally increased with pressure (3-s continuous wave pulses) (figure 4a–c). The relative location of the thermocouple to the ultrasound focus also demonstrates that the temperature decays proportionally with pressure following the lateral beam profile (figure 4g–i).
Fig. 4.
In vitro temperature measurements in canine liver at 3.1 MHz and 3-s pulse duration using 3 different thermocouples: needle T-type with 0.64 mm (N64), needle T-type with 0.25 mm diameter (N25), and wire T-type with 0.30 mm diameter (W30). (a)(b)(c) Temperature variation measured at different peak-negative-pressures. (d)(e)(f) Temperature variation measured with different pulse repetition frequencies. (g)(h)(i) Temperature variation measured at different locations following the beam lateral profile (0.00 mm, 0.19 mm, 0.30 mm, 0.50 mm, 0.75 mm, 1.00 mm, 1.25 mm, and 1.50 mm).
Table II presents the results of the iterative processing applied to all datasets (figure 4 shows representative data of one dataset). The viscous heating contribution was estimated by the ratio of the temperature increase due to the artifact by the raw temperature measured without processing (100%xTart/Tmeasured). The maximum artifact contribution with the thermocouples located at the focus were: 37±5%, 66±17%, and 81±5% for the N64, N25, and W30 thermocouples, respectively. The strongest artifacts were observed with the wire thermocouple (W30) for PNP=1.7 MPa (figure 4c). The artifact caused an increase in the standard deviation of the temperature variation (ΔT) in comparison to measurements with needle thermocouples (N64 and N25) from ±1.4°C to ±2.9°C. The tbest fit varied considerably from 0 s (at the end of sonication) with artifact contribution of a minimum of 13±10% for N64 at 0.9 MPa to 3.335 s for the thermocouple W30 at 1.7 MPa. These results show that the time of best fit varies with acoustic parameters and thermocouple type and cannot be defined by a single value for all measurements.
TABLE II.
SUMMARY OF RESULTS OBTAINED WITH ITERATIVE PROCESSING IN CANINE LIVER SAMPLE. THERMOCOUPLES WERE: N64 - NEEDLE T-TYPE WITH 0.64 MM DIAMETER, N25 – NEEDLE T-TYPE WITH 0.25 MM DIAMETER, AND W30 – WIRE T-TYPE WITH 0.30 MM DIAMETER
| Location [mm] at 1.3 MPa | PNP [MPa] | PRF [Hz] | |||||||||||||
|---|---|---|---|---|---|---|---|---|---|---|---|---|---|---|---|
| 1.5 | 1.25 | 1 | 0.75 | 0.5 | 0.3 | 0.19 | 0 | 1.7 | 1.3 | 0.9 | 1000 | 100 | 10 | ||
| 0 | 0 | 0 | 0.032±0.055 | 0.003±0.003 | 0.010±0.009 | 0.192±0.131 | 0.162±0.090 | 0.785±0.507 | 0.195±0.177 | 0.002±0.003 | 0 | 0 | 0 | tbest fit (s) | N64 |
| 0.11±0.07 | 0.20±0.10 | 0.58±0.19 | 0.86±0.08 | 0.94±0.04 | 0.96±0.02 | 0.98±0.01 | 0.98±0.01 | 0.98±0.01 | 0.98±0.01 | 0.94±0.03 | 0.65±0.11 | 0.77±0.07 | 0.83±0.03 | R2 | |
| 28±9 | 22±9 | 17±5 | 15±7 | 12±1 | 12±3 | 18±3 | 23±2 | 37±5 | 19±6 | 13±10 | 34±6 | 16±14 | 21±5 | Tart [%] | |
| 0 | 0.020±0.023 | 0.132±0.114 | 0.075±0.069 | 0.317±0.275 | 0.647±0.556 | 0.790±0.668 | 0.765±0.646 | 2.555±1.957 | 0.912±0.788 | 0.257±0.220 | 0.010±0.017 | 0.055±0.071 | 0.090±0.115 | tbest fit (s) | N25 |
| 0.44±0.38 | 0.61±0.50 | 0.73±0.42 | 0.86±0.17 | 0.93±0.10 | 0.96±0.05 | 0.97±0.04 | 0.97±0.03 | 0.98±0.02 | 0.97±0.03 | 0.94±0.09 | 0.82±0.23 | 0.85±0.19 | 0.83±0.23 | R2 | |
| 28±11 | 25±9 | 26±3 | 19±7 | 31±11 | 44±18 | 48±16 | 51±15 | 66±17 | 52±16 | 42±10 | 15±16 | 31±10 | 48±8 | Tart | |
| 0 | 0.128±0.188 | 0.197±0.038 | 0.360±0.175 | 0.622±0.186 | 0.908±0.377 | 0.905±0.331 | 1.795±1.342 | 3.335±0.979 | 1.772±1.025 | 0.400±0.233 | 0.262±0.208 | 0.178±0.168 | 0.183±0.163 | tbest fit (s) | W30 |
| 0.44±0.22 | 0.87±0.07 | 0.96±0.01 | 0.98±0.01 | 0.99±0.01 | 0.99±0.01 | 0.99±0.01 | 0.99±0.01 | 0.99±0.01 | 0.99±0.01 | 0.98±0.01 | 0.94±0.06 | 0.93±0.07 | 0.94±0.07 | R2 | |
| 29±9 | 34±5 | 41±7 | 45±5 | 55±3 | 61±3 | 63±5 | 75±6 | 81±5 | 67±17 | 55±9 | 48±12 | 50±10 | 64±8 | Tart [%] | |
| 0.7±0.4 | 1.0±0.6 | 1.6±0.9 | 2.2±1.2 | 3.0±1.5 | 3.8±1.8 | 4.2±1.8 | 4.9±2.2 | 6.3±2.9 | 4.9±2.2 | 2.8±1.5 | 1.3±0.8 | 1.2±0.7 | 1.2±0.7 | ΔTall (°C) | |
| 0.6±0.3 | 0.7±0.3 | 1.1±0.6 | 1.7±0.8 | 2.3±1.2 | 3.0±1.5 | 3.3±1.4 | 3.7±1.5 | 4.7±1.4 | 3.8±1.2 | 2.1±0.8 | 0.9±0.7 | 0.8±0.5 | 0.9±0.4 | ΔTneedle (°C) | |
tbest fit – time of best fit; Tart – contribution of viscous heating in the temperature measurement; Δtall – average temperature using all thermocouples and Δtneedle average temperature using needle thermocouples after correction using the iterative processing
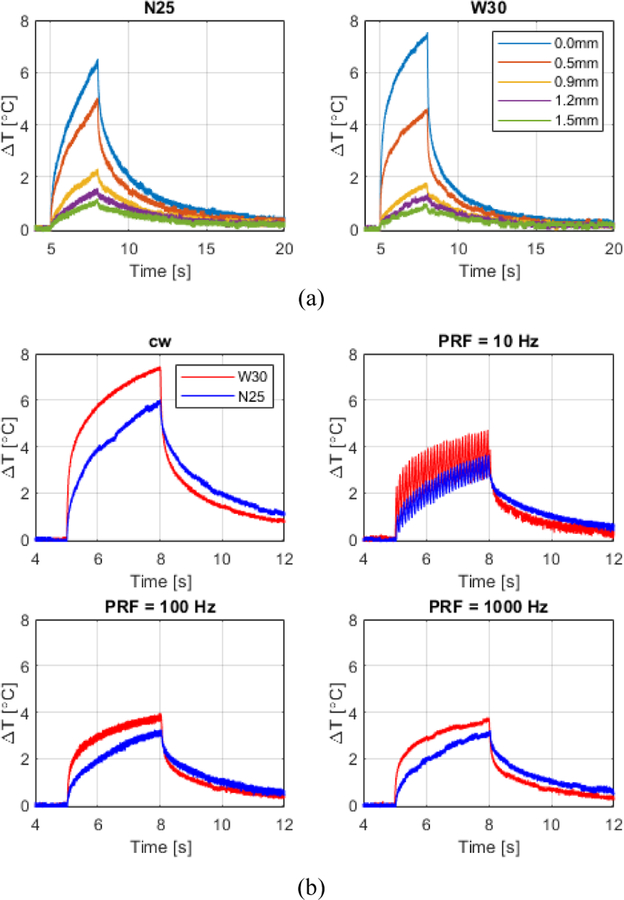
A similar analysis of the viscous heating was performed in vivo in the mouse brain (figure 5). The average temperature of the brain right below the skull before sonication was 25.0±0.5°C. The deep anaesthesia level and the low temperature (20°C) of the coupling water tank caused brain hypothermia, especially at the brain portion under the skull in contact with the coupling tank. Table III presents a summary of the temperature analysis.
Fig. 5.
In vivo temperature measurements in mouse brain at 2.0 MHz and 3-s pulse duration using 2 different thermocouples: needle T-type with 0.25 mm diameter (N25) and wire T-type with 0.30 mm diameter (W30). (a) Temperature variation measured at different locations following the beam lateral profile (0.00 mm, 0.50 mm, 0.90 mm, 1.20 mm, and 1.50 mm). (b) Temperature variation measured with pulses driven in cw- and burst-mode with different PRF’s for both thermocouples.
TABLE III.
SUMMARY OF RESULTS OBTAINED WITH ITERATIVE PROCESSING IN THE MOUSE BRAIN IN VIVO. ONLY THE THINNER THERMOCOUPLES N25 (Ø=0.25 MM) AND W30 (Ø=0.30 MM) WERE USED FOR THIS VALIDATION TO PRESERVE THE BRAIN TISSUE.
| Location [mm] at 1.2 MPa | PNP [MPa] | PRF [Hz] | ||||||||||
|---|---|---|---|---|---|---|---|---|---|---|---|---|
| 1.5 | 1.2 | 0.9 | 0.5 | 0 | 1.2 | 0.7 | 0.5 | 1000 | 100 | 10 | ||
| 0.0 | 0.020±0.026 | 0.031±0.037 | 0.260±0.272 | 0.276±0.235 | 0.498±0.457 | 0.124±0.186 | 0.023±0.045 | 0.085±0.139 | 0.130±0.228 | 0.11±0.153 | tbest fir (s) | N25 |
| 0.62±0.53 | 0.73±0.49 | 0.98±0.02 | 0.99±0.01 | 0.99±0.01 | 0.99±0.01 | 0.96±0.05 | 0.85±0.18 | 0.95±0.05 | 0.94±0.06 | 0.94±0.06 | R2 | |
| 45±50 | 25±31 | 11±7 | 20±11 | 25±8 | 26±11 | 16±16 | 13±12 | 7±17 | 12±18 | 18±16 | Tart (%) | |
| 0.0 | 0.003±0.004 | 0.028±0.039 | 0.258±0.095 | 0.378±0.074 | 0.403±0.131 | 0.068±0.060 | 0.0 | 0.162±0.071 | 0.205±0.068 | 0.138±0.067 | tbest fit (s) | W30 |
| 0.66±0.31 | 0.70±0.34 | 0.50±0.66 | 0.97±0.02 | 0.99±0.01 | 0.99±0.01 | 0.96±0.03 | 0.89±0.04 | 0.97±0.02 | 0.98±0.01 | 0.96±0.02 | R2 | |
| 30±11 | 26±11 | 30±11 | 48±6 | 54±4 | 51±3 | 27±23 | 11±11 | 46±11 | 47±7 | 51±6 | Tart | |
| 0.5±0.4 | 1.0±0.6 | 1.3±0.9 | 2.5±1.2 | 3.3±1.7 | 3.7±1.5 | 1.9±0.7 | 1.0±0.5 | 1.8±1.0 | 1.7±1.0 | 1.8±1.0 | ΔT (°C) | |
tbest fit – time of best fit; Tart – contribution of viscous heating in the temperature measurement; ΔT – temperature variation after correction using the iterative processing.
The VHA contribution in the brain right below the skull was 7±17% and 54±4% for the N25 and W30 thermocouples, respectively. The viscous heating contribution and the final derated (actual) temperature decreased laterally with the relative positioning of the thermocouples following the FUS beam profile. The temperature increase was approximately 1.8°C for all PRF’s tested. The peak temperature observed was 37.4°C (with viscous heating) with 51±3% of VHA and an actual temperature increase of ΔT=3.7±1.5°C. Changes in the Δt steps of the iterative processing (supplementary Table I) varied the time of the best fit (tbest) and estimated temperature (ΔT) within the range of the standard deviation for measurements for 0.5 and 1.2 MPa. However, downsampling the data by a factor of 10, significantly decreased the processing time by the same order.
Finally, the temperature generated by pulse sequences used for neuromodulation based on our previous publication [6] was assessed in vivo in the mouse brain using the thinner thermocouples (N25 and W30). The raw temperature readings (solid lines) and the corrected temperature decays (dashed lines) for single-sonication and for multiple sonications (10 pulses) are shown in figure 6. The average temperature increase was 5.8±0.3°C for single pulses and 6.8±0.7°C at the end of 10 pulses with same parameters with 1-s interval between pulses. The contribution of the VHA was about 80% and 8.1% for the W30 and N25 thermocouples, respectively.
Fig. 6.
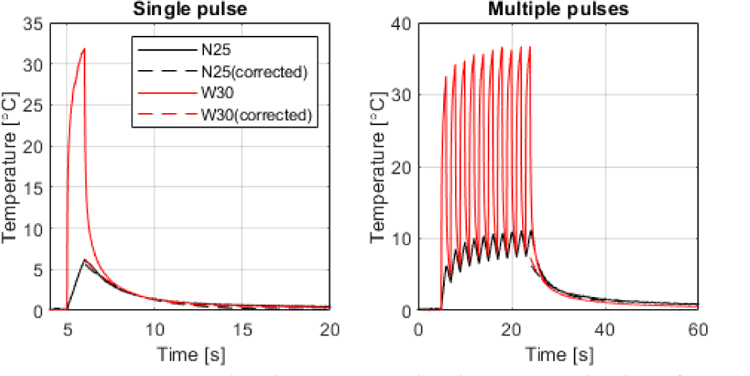
Temperature evaluation in vivo in the mouse brain of a pulse sequence used during ultrasound neuromodulation [6]. (Left) Temperature measured using the N25 and W30 thermocouples for a single FUS pulse of 1-s duration, 2 MHz, 1 kHz PRF, 1.76 MPa. (Right) Temperature evaluation at the end of 10 pulses repeated with 1-s interval between pulses.
IV. Discussion
In this study, an iterative curve fitting processing technique implementing the bioheat transfer equation was developed to estimate the VHA in both in vivo and in vitro experimental conditions. As opposed to the Newton cooling law, the bioheat transfer equation accounts for blood perfusion, which is necessary for the in vivo estimation of temperature variation in highly-perfused tissues such as the brain and liver. The solution of the bioheat transfer equation was used to estimate the peak temperature at the end of sonication, by assuming that the VHA decays with time.
Among the causes of the variability across studies in previous methods also based on the ‘wait then measure’ approach, the wrong estimation of tissue properties could introduce errors in temperature estimation. The pulse-decay technique [10] requires knowledge of the tissue thermal diffusivity, tissue density and speed-of-sound, whereas the rate-of-heating measurements [14] requires knowledge of the tissue density and speed of sound. Furthermore, the thermal pulse-decay method is limited to ultrasound fields generated by transducers with f-number greater than one and it assumes that the intensity distribution is constant in the axial beam direction and has a Gaussian decay in the radial beam direction. In addition to that, this method models the temperature decay in a homogeneous conducting medium with an initial temperature distribution described by the Newton cooling law, where no perfusion is taken into account. Thus, this method is not suitable for in vivo measurements. The curve fitting proposed here uses the bioheat transfer equation and can be used for both in vitro and in vivo measurements, since the diffusion and perfusion terms are coupled in the coefficients of the exponential decay (Eq. (2)). In the case of in vitro measurements, perfusion-related terms, namely perfusion rate per unit volume of tissue, blood specific heat, and blood temperature would be zero and only diffusion would dissipate heating. Eq. (2) can be simplified when running temperature measurements at the FUS focus and no tissue properties assumptions are necessary to fit the experimental data. Then, using the best-fit curve during the cooling phase to determine the point of negligible viscous heating, the actual initial temperature can be estimated by extrapolating back to when the sonication ended.
The validation using simulation shows that the free parameter processing has to be carefully employed as slow artifact decays combined with strong artifact magnitudes generate overestimation of temperature. Despite this limitation, the free parameter method can be useful when the tissue properties are unknown or the results obtained from the fixed parameter processing are inconsistent. A characterization of the thermocouple performed in phantom or tissue with known properties is necessary to ensure that the chosen thermocouple presents magnitude and decay values of VHA within the range that the free parameter processing can perform accurately. Based on the in vitro and in vivo tests presented here, the free parameter fitting would be more suitable for needle thermocouples. The larger metal surface area of needle thermocouple helps draining heating faster than wire thermocouples, which results in a higher artifact decay time constant (faster artifact decay). Nevertheless, other thermocouple types with slower responses such as K-type thermocouples may generate lower VHA magnitudes (as opposed to T-type used in this study), thus enabling the use of wire thermocouples. In general, the pre-assumed value processing should be the preferred method as small errors in the tissue parameters (<25%) generates temperature estimation errors lower than 1.3°C. In fact, variation in values for tissue properties found in the literature (at room to body temperatures) are lower than 5% for brain and liver ( kg.m−3, J.kg−1.°C−1, W.m−1.°C−1, kg.m−3, J.kg−1.°C−1, W.m−1.°C−1) and lower than 8.3% for blood ( J.kg−1.°C−1) [24]–[32] 1. Higher parameter variation of about 18% would occur for very high temperature (i.e. J.kg−1.°C−1 at 83.5°C) caused by tissue water loss [33]. Thus, temperature estimation with thermocouple could be more affected, for example, during thermal ablation.
The artifact contribution decreased with the pressure amplitude and FUS beam location. These results corroborate previous studies that suggested placing the thermocouple tip slightly off the FUS focal spot to reduce the artifact [15], [19], [34]. This is a feasible approach, but a correction of the temperature decay with the beam profile is necessary to correctly retrieve the temperature estimation at the focal spot. On the other hand, the temperature estimation for the PRF range tested here (PRF=10, 100, and 1000 Hz) generated a stable temperature increase of approximately 1.8°C in the brain and 1.2°C in the liver. In both cases, the duty cycles were kept the same for all PRF’s (50% duty cycle in the brain and 15% duty cycle in the liver). Therefore, the spatial peak temporal average intensity (Ispta) did not vary with PRF (liver: Ispta=8.2 W.cm−2 and brain: 23.4 W.cm−2), which explains why the temperature increase did not vary in these cases. Higher temperatures were observed for the CW sonications in liver using Ispta=54.87 W.cm−2 (1.7 MPa) and in brain 46.75 W.cm−2 (1.2 MPa) that generated 6.3±2.9°C and 3.7±1.5°C, respectively (Table II and III). The supplementary Table II presents all parameters deration.
The wire thermocouple presented higher contribution of the VHA in all experimental conditions tested here. The contributions of the VHA using the wire thermocouple were up to 81±5% of the measured temperature, which corroborates previous studies [15]. T-type thermocouples present lower time constants, which in combination with a high sampling frequency acquisition can provide a fast response capable of capturing with higher sensitivity temperature variations. At higher pressures and lower PRFs the artifact from the wire thermocouple causes very noisy temperature readings (Fig. 4c and d) with an estimated standard deviation up to ±2.9°C. Needle thermocouples in the same experimental conditions presented standard deviations ≤1.4°C. Thus, wire thermocouple should be used carefully in ultrasound fields. Needle thermocouples are more suitable for local measurements at high pressure levels.
Regarding acquisition and processing parameters, the best trade-off for the lowest processing time versus highest temperature estimation accuracy was found for sampling frequencies from 10 to 200 Hz. The larger time step Δt = 0.25 s in the processing of in vivo data that presented the lowest and highest standard deviations (Table III: 0.5 MPa and 1.2 MPa, respectively) caused the highest difference in the mean value. However, all temperature estimations were within the standard deviation of measurements, which demonstrates the robustness of the method for a wide range of data loggers available in the market.
A limitation of this study was the lack of an experimental validation using other methods such as MR thermometry [39]–[41]. Other experimental methods would estimate the temperature increase achieved in tissue without VHA, which would serve to better estimate the error introduced by the iterative method. This would especially be applied to ablation protocols where higher temperature increase and stronger VHA are expected. Future work will explore the algorithm during HIFU ablation using MR thermometry.
The approach presented here can estimate temperature for both short and long sonication as the viscous heating contribution is always present during ultrasound exposure. However, the method is limited for the analysis of the cooling time only. An analysis of the heating pattern would require simulations of heating due to both ultrasound absorption and viscous heating effect, as we presented in a recent work [19]. However, simulations require the estimation of the viscous heating contribution in different experimental conditions which, as we demonstrate here, is highly variable with acoustic parameters and thermocouple type. As opposed to that, the current method relies only on the analysis of experimental data, where abnormal tissue temperature decay is attributed to viscous heating effects. Nevertheless, both methods are complementary for temperature estimation.
Despite the invasive nature of thermocouples, measurements with thin thermocouples enable in vivo preclinical studies in highly perfused tissues such as liver and brain with minimal tissue destruction. Studies under this condition may provide insight into mechanisms involved in new ultrasound modalities such as ultrasound neuromodulation. We have demonstrated here that an ultrasound neuromodulation pulse sequence [6] in vivo in mice caused brain heating right below the skull corroborating previous simulation results [7]. Other neuromodulation techniques can also cause temperature increase, which can be a side effect as in electric stimulation [35] or a direct mechanism involved in the neuron activation as in infrared stimulation [36]. The study of the mechanisms involved in ultrasound neuromodulation involves several other hypotheses [37] and the study of these mechanisms is clearly beyond the scope of this study. Future studies using the iterative processing developed here will explore temperature measurements in the brain in attempt to correlate effects on tissue displacement [38] and neuronal activation during ultrasound neuromodulation.
Finally, the best starting fit time of the curve fitting was demonstrated here to vary significantly with the acoustic parameters, type of thermocouple, and tissue type. The statistical test adopted in the iterative processing allows finding the best time at which the temperature analysis can be performed with negligible VHA. This process avoids inconsistencies in the measurements generated by arbitrary choice of the time reported in previous studies.
V. Conclusions
An iterative curve fitting processing was developed to estimate the VHA of thermocouples embedded in ultrasound fields. The method consists in testing the time during cooling (after sonication), where the VHA is negligible. An estimation of the initial peak temperature at the end of sonication is obtained from the extrapolation of the best-fitted curve. The curve fitting is performed using a solution of the bioheat transfer equation, which enables in vivo temperature measurements in highly-perfused tissues such as the brain and the liver. We demonstrate that the method eliminates the arbitrary choice of the time where the artifact is minimum. As a result, inconsistencies in the measurements are avoided as the curve fitting can detect the best starting fit time at variable experimental conditions including acoustic parameters, type of tissue, and type of thermocouple.
Supplementary Material
Acknowledgment
We thank Lea Melki and Vincent Sayseng for the assistance in the liver sample harvesting and preparation. We also thank Mr. Pablo Abreu for the administrative assistance in the project.
This study was supported in part by SoundStim Therapeutics, National Institutes of Health (NIH) under award numbers R01CA228275 and R01EB027576, and the Defense Advanced Research Projects Agency (DARPA) Biological Technologies Office (BTO) Electrical Prescriptions (ElectRx) under award number HR0011-15-2-0054.
Biography

Hermes A. S. Kamimura (M’16) received the B.S. degree in medical physics in 2008 and the M.S./Ph.D. in physics applied to medicine and biology in 2011/2016 from University of Sao Paulo, SP, Brazil.
During his graduate studies, he conducted research projects in therapeutic and ultrasound imaging at Mayo Clinic (2010) and Columbia University (2014) in student exchange programs. After that, he was a postdoctoral research scientist at CEA, France and Columbia University in the City of New York, USA. Currently, he is an associate research scientist at Columbia University. His research interests include harmonic motion imaging and therapeutic ultrasound spanning both ultrasound neuromodulation and ultrasound-mediated blood-brain barrier disruption for targeted drug delivery in the central nervous system.
Dr. Kamimura is a member of the IEEE Ultrasonics, Ferroelectrics, and Frequency Control Society and the Brazilian Physical Society. He is recipient of the Outstanding Reviewer Award (2018) for Physics in Medicine and Biology, IOP Publishing and the best Ph.D. dissertation award in the field of Medical Physics (2016) by the Brazilian Physical Society.

Christian Aurup (M’17) was born in Roskilde, Denmark in 1991 and moved to the United States in 1996. He received a Bachelor of Biomedical Engineering from the University of Delaware in 2014. His senior design project was focused on creating an MR-compatible device for use in lumbar elastography. During his undergraduate career, he also assisted with research on the DarkSide dark matter project at Princeton University, helping design water distillation techniques for removing Polonium-210 from ground water and implementing them at the Laboratorio Nazionali del Gran Sasso in Italy.
After leaving Delaware, he began a M.S. degree in biomedical engineering at Columbia University and joined the Ultrasound Elasticity and Imaging Laboratory (UEIL) as an intern with work centered around ultrasonic neuromodulation. After finishing his M.S. in 2015, he joined the UEIL as a Ph.D. student, continuing work in ultrasound-based techniques for neuromodulation and functional neuroimaging.
Mr. Aurup has previously been a member of IEEE and presented graduate work at several IEEE IUS conferences.

Ethan V. Bendau is a Ph.D. student in biomedical engineering at Columbia University, New York, NY, USA. He received his B.A. in French at the University of Oregon, Eugene, OR, USA in 2013 and B.S. degree in physics from The City College of New York in New York, NY, USA in 2018.
During his undergraduate studies in physics, he was a researcher in biomedical optics at the Institute for Ultrafast Spectroscopy and Lasers. His summer research experience includes the AEOP Undergraduate Research Apprenticeship Program and the CCNY-MSK Partnership Undergraduate Research Training program. He is currently researching ultrasound neuromodulation of the central nervous system in mice.
Mr. Bendau was a recipient of the City College Fellowship during his undergraduate studies and is a current recipient of the Blavatnik Doctoral Fellowship for research at the intersection of health and engineering at Columbia University.

Niloufar Saharkhiz was born in Tehran, Iran, in 1991. She received the B.S. degree in electrical engineering with a major in electronics from Iran University of Science and Technology (IUST), Tehran, Iran, in 2014, and the M.Sc. degree in biomedical Engineering with a major in medical physics from Imperial College London, London, U.K., in 2015.
She is currently pursuing the Ph.D. degree in biomedical engineering with Columbia University, New York City, NY, USA. She is with the Elasticity Imaging and Ultrasound Laboratory (UEIL) and her current research interests include diagnosis and treatment monitoring of breast cancer using Harmonic Motion Imaging (HMI).

Min Gon Kim (M’14) received his B.S. and M.S. degrees in electrical engineering from Kwangwoon University, Seoul, South Korea in 2009 and University of Southern California, Los Angeles, CA, USA and 2012, respectively and his Ph.D. degree in biomedical engineering from University of Southern California, Los Angeles, CA, USA in 2017.
He is currently working on image guided-focused ultrasound induced modulation of motor and sensory neuron activity in the mouse peripheral nervous system in vivo as a Postdoctoral Research Scientist at Columbia University, New York, NY, USA.
Dr. Kim is a member of IEEE Ultrasonics, Ferroelectrics, and Frequency Control Society. He is a recipient of Best Poster Award at the 19th Annual Fred S. Grodins Graduate Research Symposium, Los Angeles, CA.

Elisa E. Konofagou (S’98–A’99–M’03) is currently the Robert and Margaret Hariri Professor of biomedical engineering and a Professor of radiology as well as the Director of the Ultrasound and Elasticity Imaging Laboratory with the Biomedical Engineering Department, Columbia University, New York, NY, USA. She has co-authored over 170 peer-reviewed journal articles. Her current research interests include the development of novel elasticity imaging techniques and therapeutic ultrasound methods and more notably, myocardial elastography, electromechanical and pulse wave imaging, harmonic motion imaging, focused ultrasound therapy, and drug delivery in the brain, with several clinical collaborations in the Columbia Presbyterian Medical Center, New York, NY, USA, and elsewhere.
Prof. Konofagou was a recipient of awards, such as the CAREER Award from the National Science Foundation and the Nagy Award from the National Institutes of Health as well as others from the American Heart Association, the Acoustical Society of America, the American Institute of Ultrasound in Medicine, the Wallace H. Coulter Foundation, the Bodossaki Foundation, the Society of Photo-Optical Instrumentation Engineers, and the Radiological Society of North America. She is a Technical Committee Member of the Acoustical Society of America, the International Society of Therapeutic Ultrasound, the IEEE Engineering in Medicine and Biology Conference, the IEEE International Ultrasonics Symposium, and the American Association of Physicists in Medicine. She serves as an Associate Editor for the IEEE Transactions On Ultrasonics, Ferroelectrics, And Frequency Control, Ultrasonic Imaging, and Medical Physics.
Footnotes
An extensive list of tissue properties and references can be found at https://itis.swiss/virtual-population/tissue-properties/downloads/database-v4-0/
References
- [1].Sapareto SA and Dewey WC, “Thermal dose determination in cancer therapy,” Int. J. Radiat. Oncol. Biol. Phys, 1984. [DOI] [PubMed]
- [2].O’Neill BE, Karmonik C, Sassaroli E, and Li KC, “Estimation of thermal dose from MR thermometry during application of nonablative pulsed high intensity focused ultrasound,” J. Magn. Reson. Imaging, 2012. [DOI] [PMC free article] [PubMed]
- [3].Schlesinger D, Benedict S, Diederich C, Gedroyc W, Klibanov A, and Larner J, “MR-guided focused ultrasound surgery, present and future,” Med. Phys, vol. 40, no. 8, p. 080901, July 2013. [DOI] [PMC free article] [PubMed] [Google Scholar]
- [4].Barnett SB, “Intracranial temperature elevation from diagnostic ultrasound,” in Ultrasound in Medicine and Biology, 2001. [DOI] [PubMed]
- [5].Abramowicz JS, Barnett SB, Duck FA, Edmonds PD, Hynynen KH, and Ziskin MC, “Fetal thermal effects of diagnostic ultrasound,” in Journal of Ultrasound in Medicine, 2008. [DOI] [PubMed]
- [6].Kamimura HAS et al. , “Focused ultrasound neuromodulation of cortical and subcortical brain structures using 1.9 MHz,” Med. Phys, vol. 43, no. 10, pp. 5730–5735, September 2016. [DOI] [PMC free article] [PubMed] [Google Scholar]
- [7].Constans C, Mateo P, Tanter M, and Aubry J-F, “Potential impact of thermal effects during ultrasonic neurostimulation: retrospective numerical estimation of temperature elevation in seven rodent setups,” Phys. Med. Biol, 2017. [DOI] [PubMed]
- [8].Dasgupta S, Banerjee RK, Hariharan P, and Myers MR, “Beam localization in HIFU temperature measurements using thermocouples, with application to cooling by large blood vessels,” Ultrasonics, vol. 51, no. 2, pp. 171–180, February 2011. [DOI] [PubMed] [Google Scholar]
- [9].Goss SA, Frizzell LA, and Dunn F, “Ultrasonic absorption and attenuation in mammalian tissues,” Ultrasound Med. Biol, vol. 5, pp. 181–186, 1979. [DOI] [PubMed] [Google Scholar]
- [10].Parker KJ, “The thermal pulse decay technique for measuring ultrasonic absorption coefficients,” J. Acoust. Soc. Am, vol. 74, no. 5, pp. 1356–1361, November 1983. [Google Scholar]
- [11].McDannold N, Hynynen K, and Jolesz F, “MRI monitoring of the thermal ablation of tissue: Effects of long exposure times,” J. Magn. Reson. Imaging, 2001. [DOI] [PubMed]
- [12].Lewis MA, Staruch RM, and Chopra R, “Thermometry and ablation monitoring with ultrasound,” International Journal of Hyperthermia 2015. [DOI] [PMC free article] [PubMed]
- [13].Fry WJ and Fry RB, “Determination of Absolute Sound Levels and Acoustic Absorption Coefficients by Thermocouple Probes—Experiment,” J. Acoust. Soc. Am, vol. 26, no. 3, pp. 311–317, May 1954. [Google Scholar]
- [14].Goss SA, Cobb JW, and Frizzell LA, “Effect of Beam Width and Thermocouple Size on the Measurement of Ultrasonic Absorption Using the Thermoelectric Technique,” in 1977 Ultrasonics Symposium, 1977, pp. 206–211.
- [15].Morris H, Rivens I, Shaw A, and Ter Haar G, “Investigation of the viscous heating artefact arising from the use of thermocouples in a focused ultrasound field,” Phys. Med. Biol, vol. 53, no. 17, pp. 4759–4776, September 2008. [DOI] [PubMed] [Google Scholar]
- [16].Fry WJ and Fry RB, “Determination of Absolute Sound Levels and Acoustic Absorption Coefficients by Thermocouple Probes—theory,” J. Acoust. Soc. Am, vol. 26, no. 3, pp. 311–317, May 1954. [Google Scholar]
- [17].Hynynen K, Martin CJ, Watmough DJ, and Mallard JR, “Errors in temperature measurement by thermocouple probes during ultrasound induced hyperthermia,” Br. J. Radiol, vol. 56, no. 672, pp. 969–970, December 1983. [DOI] [PubMed] [Google Scholar]
- [18].Huang J, Holt RG, Cleveland RO, and Roy RA, “Experimental validation of a tractable numerical model for focused ultrasound heating in flow-through tissue phantoms,” J. Acoust. Soc. Am, vol. 116, no. 4, pp. 2451–2458, October 2004. [DOI] [PubMed] [Google Scholar]
- [19].Tiennot T, Kamimura HAS, Lee SA, Aurup C, and Konofagou EE, “Numerical modeling of ultrasound heating for the correction of viscous heating artifacts in soft tissue temperature measurements,” Appl. Phys. Lett, vol. 114, no. 20, p. 203702, May 2019. [DOI] [PMC free article] [PubMed] [Google Scholar]
- [20].Matsuki K et al. , “Temperature distributions measurement of high intensity focused ultrasound using a thin-film thermocouple array and estimation of thermal error caused by viscous heating,” in Proceedings of the Annual International Conference of the IEEE Engineering in Medicine and Biology Society, EMBS, 2013. [DOI] [PubMed] [Google Scholar]
- [21].Pennes HH, “Analysis of Tissue and Arterial Blood Temperatures in the Resting Human Forearm,” J. Appl. Physiol, vol. 1, no. 2, pp. 93–122, August 1948. [DOI] [PubMed] [Google Scholar]
- [22].Nyborg WL, “Solutions of the bio-heat transfer equation,” Phys. Med. Biol, vol. 33, no. 7, pp. 785–792, July 1988. [DOI] [PubMed] [Google Scholar]
- [23].Dillenseger J-L and Esneault S, “Fast FFT-based bioheat transfer equation computation,” Comput. Biol. Med, vol. 40, no. 2, pp. 119–123, 2010. [DOI] [PubMed] [Google Scholar]
- [24].Williams LR and Leggett RW, “Reference values for resting blood flow to organs of man,” Clin. Phys. Physiol. Meas, vol. 10, no. 3, pp. 187–217, 1989. [DOI] [PubMed] [Google Scholar]
- [25].Bowman HF, Cravalho EG, and Woods M, “Theory, Measurement, and Application of Thermal Properties of Biomaterials,” Annu. Rev. Biophys. Bioeng, vol. 4, no. 1, pp. 43–80, June 1975. [DOI] [PubMed] [Google Scholar]
- [26].Collins CM et al. , “Temperature and SAR calculations for a human head within volume and surface coils at 64 and 300 MHz,” J. Magn. Reson. Imaging, vol. 19, no. 5, pp. 650–656, May 2004. [DOI] [PubMed] [Google Scholar]
- [27].MCINTOSH RL and ANDERSON V, “A COMPREHENSIVE TISSUE PROPERTIES DATABASE PROVIDED FOR THE THERMAL ASSESSMENT OF A HUMAN AT REST,” Biophys. Rev. Lett, vol. 05, no. 03, pp. 129–151, September 2010. [Google Scholar]
- [28].Van Den Berg PM, De Hoop AT, Segal A, and Praagman N, “A Computational Model of the Electromagnetic Heating of Biological Tissue with Application to Hyperthermic Cancer Therapy,” IEEE Trans. Biomed. Eng, vol. BME-30, no. 12, pp. 797–805, 1983. [DOI] [PubMed] [Google Scholar]
- [29].Bernardi P, Cavagnaro M, Pisa S, and Piuzzi E, “Specific absorption rate and temperature elevation in a subject exposed in the far-field of radio-frequency sources operating in the 10–900-MHz range,” IEEE Trans. Biomed. Eng, vol. 50, no. 3, pp. 295–304, 2003. [DOI] [PubMed] [Google Scholar]
- [30].F. A. B. T.-P. P. of T. Duck, Ed., “Appendix A - Tissue Perfusion Rates,” London: Academic Press, 1990, p. 329. [Google Scholar]
- [31].Duck FA, “Chapter 5 - Mechanical Properties of Tissue,” F. A. B. T.-P. P. of T. Duck, Ed. London: Academic Press, 1990, pp. 137–165. [Google Scholar]
- [32].Duck FA, “Chapter 2 - Thermal Properties of Tissue,” F. A. B. T.-P. P. of T. Duck, Ed. London: Academic Press, 1990, pp. 9–42. [Google Scholar]
- [33].Haemmerich D, dos Santos I, Schutt DJ, Webster JG, and Mahvi DM, “In vitro measurements of temperature-dependent specific heat of liver tissue,” Med. Eng. Phys, vol. 28, no. 2, pp. 194–197, 2006. [DOI] [PubMed] [Google Scholar]
- [34].Holt RG and Roy RA, “Measurements of bubble-enhanced heating from focused, mhz-frequency ultrasound in a tissue-mimicking material,” Ultrasound Med. Biol, vol. 27, no. 10, pp. 1399–1412, 2001. [DOI] [PubMed] [Google Scholar]
- [35].Janca R et al. , “Intraoperative Thermography of the Electrical Stimulation Mapping: A Safety Control Study,” IEEE Trans. Neural Syst. Rehabil. Eng, vol. 26, no. 11, pp. 2126–2133, November 2018. [DOI] [PubMed] [Google Scholar]
- [36].Shapiro MG, Homma K, Villarreal S, Richter C-P, and Bezanilla F, “Infrared light excites cells by changing their electrical capacitance,” Nat. Commun, vol. 3, p. 736, 2012. [DOI] [PMC free article] [PubMed] [Google Scholar]
- [37].Sassaroli E and Vykhodtseva N, “Acoustic neuromodulation from a basic science prospective,” J. Ther. Ultrasound, vol. 4, no. 1, p. 17, 2016. [DOI] [PMC free article] [PubMed] [Google Scholar]
- [38].Suomi V, Han Y, Konofagou E, and Cleveland RO, “The effect of temperature dependent tissue parameters on acoustic radiation force induced displacements,” Phys. Med. Biol, vol. 61, no. 20, pp. 7427–7447, October 2016. [DOI] [PubMed] [Google Scholar]
- [39].Köhler MO et al. , “Volumetric HIFU ablation under 3D guidance of rapid MRI thermometry,” Med. Phys, vol. 36, no. 8, pp. 3521–3535, August 2009. [DOI] [PubMed] [Google Scholar]
- [40].Cline HE, Hynynen K, Hardy CJ, Watkins RD, Schenck JF, and Jolesz FA, “MR temperature mapping of focused ultrasound surgery,” Magn. Reson. Med, vol. 31, no. 6, pp. 628–636, June 1994. [DOI] [PubMed] [Google Scholar]
- [41].Hynynen K et al. , “Pre-clinical testing of a phased array ultrasound system for MRI-guided noninvasive surgery of the brain—A primate study,” Eur. J. Radiol, vol. 59, no. 2, pp. 149–156, 2006. [DOI] [PubMed] [Google Scholar]
Associated Data
This section collects any data citations, data availability statements, or supplementary materials included in this article.


